 Newshot
Main
A central objective in neuroscience is to characterize the computational transformations that occur across successive nodes of neural circuits. In the visual system, this requires defining the mechanisms by which retinal signals are integrated and processed as they ascend to higher brain centres. Among these, motion signals are particularly salient, providing the sensory substrate for critical behaviours such as predatory pursuit, escape and spatial navigation9,10. Over the past half-century, neurons in various brain areas have been found to respond to visual motion. A particularly common form of motion sensitivity is a preference for stimuli moving in a certain direction, a property known as direction selectivity that is observed in the retina, SC and cortex1,2,3,4,5. However, relationships between direction-selective cell types in different brain areas are unknown, leaving equally unclear how direction-selective activity is used and transformed across different stages of the visual hierarchy. A key obstacle has been the lack of a wiring diagram to guide understanding of information flow between the tens of different retinal ganglion cell (RGC) types and similarly diverse neuronal cell types in target areas such as SC. Here, we describe the development of a technological platform that enabled us to address these knowledge gaps.
Efforts to map neural circuits have yielded a diverse array of methodologies, yet existing ‘gold-standard’ approaches face considerable scalability and molecular identification constraints. Although electron microscopy provides high-resolution reconstructions11,12,13,14, it remains incompatible with the molecular profiling of pre- and postsynaptic partners and is currently impractical for brain-wide mammalian applications. Similarly, physiological techniques such as channelrhodopsin-assisted circuit mapping (CRACM)12 and Patch-seq15,16 provide precise functional data but are limited by low throughput. Recent sequencing-based strategies (such as Retro-Seq, Project-Seq, VECTOR-Seq, MAPseq and BARseq)17,18,19,20,21 have advanced the field by using RNA barcodes to define projection targets of starter neurons at high throughput, but these strategies trace axonal projection targets in the brain, and do not identify their synaptic target cell types within those areas. Additionally, these methods often rely on tissue microdissection, thereby losing anatomical context. These limitations underscore the need for next-generation, readily adoptable methods for comprehensive connectivity mapping at cell-type resolution.
To fill this gap, with a particular focus on comprehensive mapping of synaptic target cell types, we integrated a genetically encoded anterograde fluorescent trans-neuronal tracer, mWGA–mCherry (mWmC)6, (Fig. 1a) with the spatial transcriptomics technology, MERFISH7,8 (Fig. 1b). This combined platform, which we named TransA-MERFISH, required two major technical advances. First, we established an experimental workflow that enables the combination of anterograde trans-neuronal tracer immunostaining and MERFISH-based spatial transcriptomics. Second, we developed an automated data processing pipeline to align connectivity and transcriptomic data—that is, to overlay fluorescent signals from anterograde tracers on the spatially resolved neural identity data derived from multiplexed RNA signals in MERFISH (Fig. 1c). We then applied TransA-MERFISH to investigate the aforementioned half-century-old unresolved problem in visual neuroscience: the relationship between direction-selective neuron types and computations at different stages of the visual hierarchy. We used TransA-MERFISH to establish a comprehensive, cell-type-resolution wiring diagram downstream of ooDSGCs, a well-studied RGC subclass attuned to stimuli moving in one of the four cardinal directions: nasal, temporal, dorsal or ventral22,23. Using Cre transgenic mice, we mapped the SC synaptic target cell types of ooDSGCs that prefer particular directions24,25,26. We unexpectedly found that although ooDSGCs strongly innervate several SC cell types, they do not innervate the cell type that a previous study27 claimed was most direction-selective in SC. These surprising results were validated using multiple genetic, anatomical and electrophysiological tests. Subsequent in vivo imaging studies of SC activity before and after ablation of retinal direction-selective circuits confirmed that computationally distinct ooDSGC-dependent and ooDSGC-independent direction-selective cell types are commingled in SC. Our research establishes TransA-MERFISH as a high-throughput approach for generating cell-type-level wiring diagrams and reveals divergent computational strategies for visual motion detection.
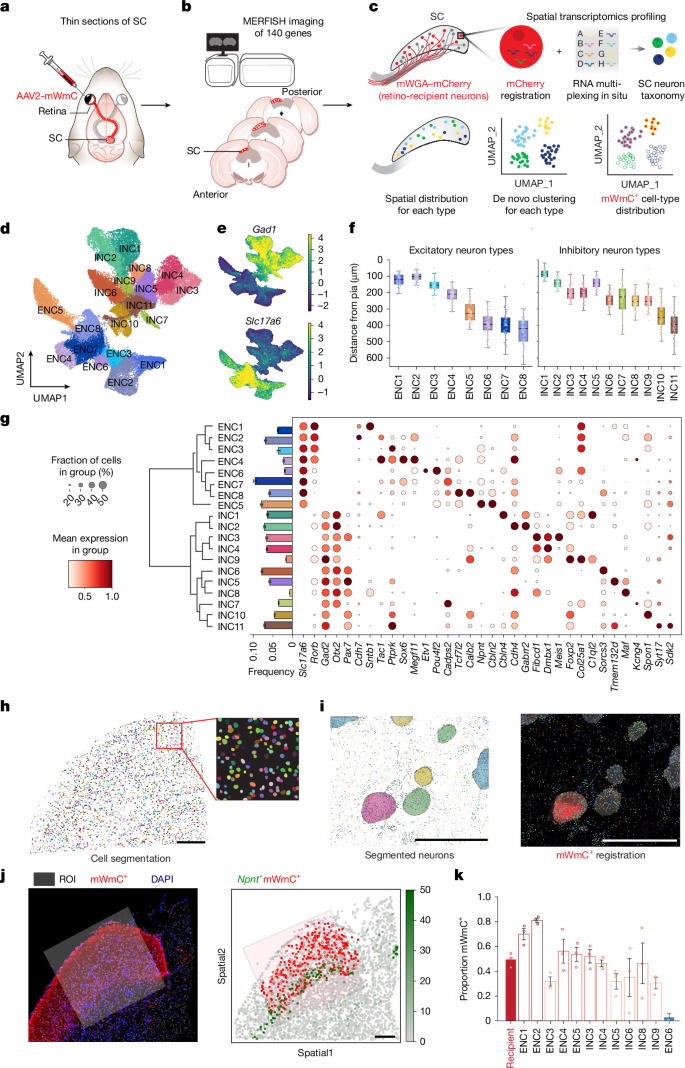
a–c, Schematic of the TransA-MERFISH workflow. a, AAV2-mWGA-mCherry is delivered to left retina for trans-neuronal transfer of mWmC from all RGCs onto retino-recipient neurons in right SC. b, At 4 weeks post-injection (wpi), sSC was imaged. c, A 140-gene panel was used to classify sSC neurons. Anti-RFP immunostaining was used for mWmC+ cell identification in the MERFISH-segmented atlas. d,e, Uniform manifold approximation and projection (UMAP) plot classifying sSC neurons into 8 ENCs and 11 INCs (d) and with superimposed Slc17a6 (excitatory neurons) and Gad1 (inhibitory neurons) expression (e). f, Median positions of somata along the dorsal–ventral axis for all clusters. Box plots show the median, with the lower and upper bounds of the box representing the 25th and 75th percentiles, respectively. Whiskers indicate the minimum and maximum values. g, Left, dendrogram designating the transcriptomic similarities between clusters. Middle, bar plot showing cluster frequencies. Right, dot plots for sSC marker genes for each ENC or INC. For data in d–g, n = 16 mice, 46,277 cells. h,i, A sample image for segmentation and registration of RNA transcripts (h) and mWmC overlay (i). Colour shades denote cell-mask boundaries generated by Cellpose, and each dot represents a distinct transcript. mWmC+ cells (red neurons) were quantified using a control-derived fluorescence intensity threshold applied to the distribution of red fluorescence intensities (Methods). Scale bars, 200 µm (h) and 25 µm (i). Representative images from five independent experiments with similar results. j, mWmC registration on a sample sSC section. Left, maximum-intensity projection images of DAPI and mWmC overlaid with segmented cell masks in white. Right, Npnt (ENC5 marker) expression overlaid on mWmC registration. Scale bars, 200 µm. ROI, region of interest. k, Bar graphs reporting all retino-recipient neuron clusters. 49.3 ± 3.3% (mean ± s.e.m.) of the sSC neurons are annotated as recipients. n = 3 mice. Data are presented as mean ± s.e.m. P < 0.05, P < 0.01, P < 0.001, ****P < 0.0001; NS, not significant (P ≥ 0.05).
Adapting MERFISH in fixed tissue for taxonomy
Single-cell RNA-sequencing (scRNA-seq)-based methods have laid the groundwork for understanding neuronal taxonomy, including scRNA-seq studies covering the entire SC region28,29. However, these methods require tissue dissociation and microfluidics-based single-cell isolation, which reduce spatial resolution, the completeness of cell-type identification, and scalability for large-scale mapping. We therefore developed a preparation to combine anterograde trans-neuronal tracing with spatial transcriptomics (MERFISH). Because the established MERFISH protocol uses fresh-frozen tissue to maximize RNA preservation30,31, it is incompatible with immunostaining for protein markers such as the anterograde trans-neuronal tracer mWmC. Therefore, we developed a protocol to perform MERFISH on fixed tissue. To benchmark this protocol, we sought to create a reference atlas of SC neurons in the retino-recipient superficial SC (sSC) (Fig. 1c). We referred to existing scRNA-seq data6,19,28 to select 140 neuron-type marker genes to classify retino-recipient neurons in the superficial SC (sSC) (Fig. 1b, Extended Data Figs. 1e,f and 2f,i and Methods). We developed a perfusion–fixation MERFISH protocol that ensured that RNA integrity and neuronal morphology were not compromised compared with fresh-frozen tissue, while preserving protein localization (Extended Data Fig. 1a–d and Methods). We then performed MERFISH on sSC, followed by Cellpose-based segmentation (as in past MERFISH studies in the mouse brain31), which covered all sSC neurons (Fig. 1h,i and Methods). This pipeline classified sSC neurons into 8 excitatory cell types (ENC1–8, marked by Slc17a6) and 11 inhibitory cell types (INC1–11, marked by Gad1) (Fig. 1d–g and Extended Data Fig. 1g–j). Data quality for SC cell classification from the modified TransA-MERFISH protocol (Extended Data Fig. 3a–e) closely matched that of several published scRNA-seq datasets19,27,28 (Extended Data Fig. 2c,e–j), as well as the cell types and supertypes reported in the Allen Brain Atlas dataset30 (Extended Data Fig. 2a,b). Together, these data validate the feasibility of performing MERFISH in fixed tissue.
Analysis of spatial distributions found that each ENC cluster is restricted to a specific sublamina along the dorsal–ventral axis (Fig. 1f and Extended Data Fig. 4f), consistent with past observations in rodents and zebrafish6,32,33,34. INC1, INC2, INC5 and INC6 are also restricted to specific sublaminae along the dorsal–ventral axis, whereas INC3, INC4 and INC7–11 are spread across multiple sublaminae (Fig. 1f and Extended Data Fig. 4g). In addition, we observed a consistent distribution of all ENCs and INCs along the anterior–posterior and medial–lateral axes, which largely follows the sublaminar arrangement, without layer swapping (Extended Data Fig. 4a–e). Collectively, the MERFISH data map the sublaminar distribution of sSC neurons along the dorsal–ventral axis at single-cell-type resolution. Each cluster is further compared and quantified in Extended Data Table 1.
Registering mWmC onto each MERFISH cluster
Having established a MERFISH protocol compatible with immunostaining and created an atlas of sSC cell types, we next sought to overlay cell connectivity information onto it. To do so, adeno-associated virus (AAV) encoding mWmC was delivered to the left eye to yield nearly complete coverage across all RGC types (Fig. 1a and Extended Data Fig. 6a). mWmC protein was transferred anterogradely and monosynaptically to the synaptic targets of RGCs in the contralateral (right) sSC, which receives innervation from around 90% of RGCs35. We then performed MERFISH on fixed tissue followed by anti-RFP immunostaining on the same microscope to facilitate registration with the MERFISH data. As a result, mWmC signals identified by anti-RFP immunostaining could be clearly registered with the RNA-based Cellpose segmentation masks (Fig. 1i,j and Methods). All mWmC+ neurons in the SC downstream of a given RGC starter neuron could be captured by imaging approaches and molecularly identified using MERFISH. Based on co-registered mWmC signals and MERFISH transcripts, we established a computational pipeline to assign mWmC signals to segmented neurons at single-cell resolution, followed by manual proofreading (Fig. 1i,j and Methods). The optimized workflow enabled high-throughput registration. This computational pipeline determines the percentages of mWmC+ neurons within each neuronal cluster, providing a quantitative measure of connectivity at cell-type resolution (Fig. 1k and Methods). We termed this integrated workflow TransA-MERFISH because it combines anterograde trans-neuronal tracing with MERFISH-based cell classification to read out connectivity.
Using TransA-MERFISH, we examined the synaptic target cell types of all RGCs. Roughly half (49 ± 3%, mean ± s.e.m.) of sSC neurons had a detectable mWmC signal (Fig. 1k). Across sSC neuron types defined by MERFISH, 5 out of 8 ENCs and 6 out of 11 INCs were classified as retino-recipient neurons based on mWmC signals above baseline, including a cell type that we recently showed to be retino-recipient (Npnt+)6 (Figs. 1k and 2a,c and Extended Data Fig. 3f–h). Notably, multiple ENCs and INCs in the sSC did not receive mWmC and were therefore not categorized as recipient neurons of RGCs, including a cell type that was previously6 characterized as not retino-recipient (Etv1+) (Figs. 1k and 2c,o). These data thus suggest TransA-MERFISH possesses the sensitivity and specificity to map synaptic connectivity at scale.
The spatially resolved map of all retino-recipient neurons in SC (Fig. 2b) generated with TransA-MERFISh enabled direct comparison of connectivity across cell types within shared sublaminar contexts. Notably, several SC neuron pairs exhibited divergent RGC connectivity despite occupying similar sublaminar distributions (Figs. 1f and 2a,b,g–o). For example, in the most superficial SC, ENC1 and ENC2 neurons were retino-recipient, whereas neighbouring INC1 neurons were not; similarly, in slightly deeper layers, ENC5 and INC6 neurons received retinal input, whereas neighbouring ENC6 neurons did not. These observations suggested that sublaminar position alone is insufficient to explain synaptic targeting by RGC axons. To test whether molecular cell-type identity contributes to synaptic specificity beyond sublaminar organization, we implemented a permutation-based framework in which cell-type labels were randomly shuffled within depth bins along the dorsal–ventral axis (Fig. 2d and Methods). This procedure preserves the sublaminar distribution of mWmC labelling while disrupting the association between molecular identity and connectivity. Cell-type specificity was quantified by comparing observed mWmC enrichment or depletion for each cell type against the permutation-derived null distribution. Using this approach, we identified multiple retino-recipient clusters, including ENC1, ENC2 and ENC5, with significant enrichment of mWmC labelling after accounting for sublaminar positions (Fig. 2e). By contrast, multiple non-retino-recipient clusters, including INC1 and ENC6, characterized here, showed significant depletion relative to sublaminar expectations (Fig. 2e,p). Together, these results indicate that RGC axons innervate SC neurons in a cell-type-specific way rather than simply according to their sublaminar distributions; that is, molecular identity, rather than sublaminar distribution, determines wiring specificity from the retina to SC.
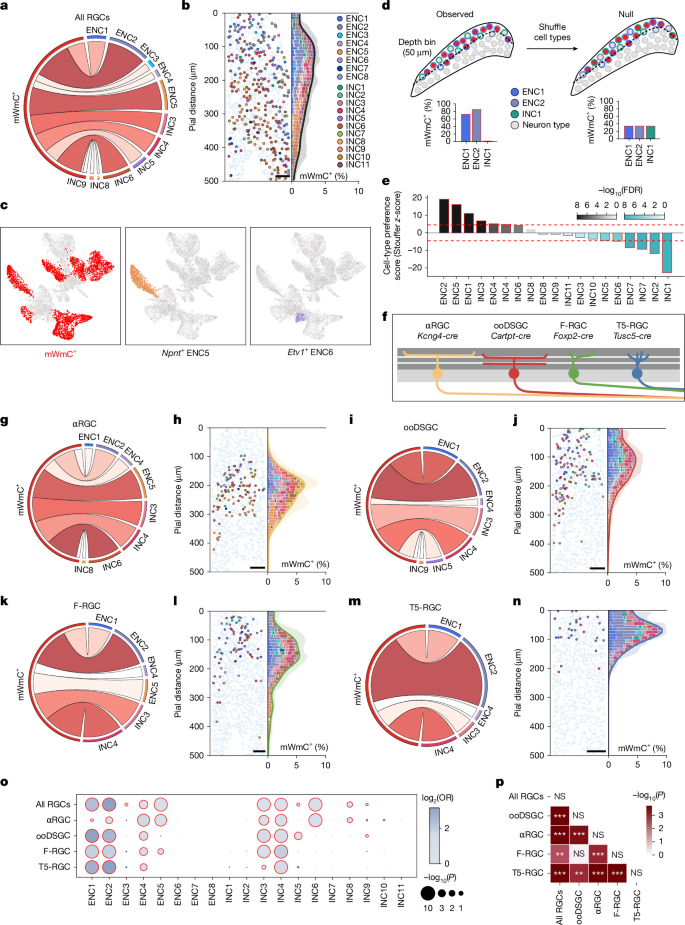
a, Chord diagrams from all RGCs. Each line represents one mWmC+ neuron type, and the width represents the number of mWmC+ neurons. b, Sublaminar distribution of mWmC+ cells across all RGCs and their spatial cell-type composition profiles. Left, spatial embeddings of mWmC+ cells, coloured by molecular cell type, spanning 0–500 µm from pial surface (n = 1,181 cells). Right, spatial distribution of mWmC+ neurons. Coloured lines denote the mean. Scale bar, 20 µm. c, UMAP plots for all retino-recipient neurons in the sSC, with red denoting retino-recipient neurons labelled by mWmC. ENC5 (yellow) but not ENC6 (purple) are mWmC+. a–c, n = 3 mice. d, Permutation test. sSC neuron-type labels were shuffled within 50 µm depth bins while randomizing molecular identity. e, Ranked bar plots of cell-type preference score (aggregated Stouffer z-score) computed using a sublaminar-controlled permutation test (Methods). Bar height represents the combined Stouffer z-score across mice. Positive values indicate enrichment of mWmC+ labelling beyond sublaminar expectation, whereas negative values indicate depletion. f, Schematic of four RGC subclasses. g,i,k,m, Chord diagrams of αRGC (g), ooDSGC (i), F-RGC (k) and T5-RGC (m) synaptic target cell types. h,j,l,n, Sublaminar distributions of mWmC+ αRGC (h), ooDSGC (j), F-RGC (l) and T5-RGC (n) neurons, together with spatial cell-type profiles. Left, cell spatial embedding plots of representative ROIs. n = 829 cells (h), 1,423 cells (j), 1,256 cells (l) and 733 cells (n). Right, cell spatial distribution curves. Scale bars, 20 µm. o, Dot plot reporting mWmC+ cell enrichment across all TransA-MERFISH experiments (Methods). p, P values of pairwise statistical comparisons of depth distributions as in b,h,j,l,n (Methods). In o,p, αRGCs, n = 3 mice, 7,375 cells; ooDSGCs, n = 4 mice, 10,799 cells; F-RGCs, n = 3 mice, 8,635 cells; and T5-RGCs, n = 3 mice, 6,063 cells. All statistical tests were two-sided.
We validated the sensitivity and specificity of TransA-MERFISH using CRACM. We first examined ENC5, which corresponds to genetically labelled Npnt+ wide-field neurons6 (Extended Data Fig. 5i and Extended Data Table 1). ENC5 was known to receive strong RGC input: 54 ± 6% (mean ± s.e.m.) of Npnt+ neurons contained mWmC labelling (Fig. 1j,k). CRACM quantitatively validated the TransA-MERFISH prediction, with a comparable percentage (52 ± 2%, mean ± s.e.m.) of Npnt+ wide-field neurons innervated by RGCs (Extended Data Fig. 5a,b,d). By contrast, ENC6 neurons, marked by Etv1, were in the same sublamina as ENC5 but did not receive direct retinal input in the TransA-MERFISH data (Fig. 1k). Consistently, these neurons did not receive RGC input in CRACM experiments (Extended Data Fig. 5a,c,d). These results validated the finding that ENC5 neurons receive input from the retina, whereas ENC6 neurons are not innervated by RGCs (Extended Data Fig. 5e–h). Together, these data support the notion that TransA-MERFISH provides a high-throughput platform for quantitatively defining neuronal synaptic target cell types at cell-type resolution.
Decoding neuronal outputomes of distinct RGCs
To demonstrate the power of TransA-MERFISH to enable the discovery of synaptic target cell types of genetically defined starter cells, we decoded synaptic target cell types in SC of four major RGC subclasses that detect distinct visual features36: αRGCs (Kcng4-cre); ooDSGCs (Cartpt-cre); F-RGCs (Foxp2-cre); and T5-RGCs (Tusc5-cre)24,37,38,39,40 (Fig. 2f and Extended Data Fig. 6). These parallel TransA-MERFISH experiments yielded a comprehensive connectivity matrix at cell-type resolution. We observed highly distinct synaptic target cell-type compositions for different RGC subclasses (Fig. 2g–n). For example, ENC5 (Npnt+) neurons receive input from αRGCs, but not from ooDSGCs, consistent with our CRACM and trans-neuronal tracing results, and ENC6 (Etv1+) neurons receive no input from any of the four RGC subclasses (Figs. 1k, 2f–n,p and Extended Data Fig. 7). In addition, because different RGC subclasses arborize in distinct sSC sublaminae, we sorted the synaptic target cell types by their sublaminar distributions and connectivity frequencies (Fig. 2b,h,j,l,n and Extended Data Fig. 7). We found that retino-recipient neurons largely share the sublaminar distributions of the axonal arbors from that RGC subclass. For example, robust connectivity was reported from αRGCs to ENC4 and ENC5 neurons in lower stratum griseum superficiale (SGS) and stratum opticum (SO) (Fig. 2g,h and Extended Data Fig. 7b), with αRGC axons primarily ramifying in the same sublaminae24,26,40,41 (Extended Data Fig. 6i). By contrast, ooDSGCs, F-RGCs and T5-RGCs primarily innervated superficial ENC1 and ENC2 (Fig. 2i–n and Extended Data Fig. 7b–f), correlated with their axons primarily innervating the upper SGS (Extended Data Fig. 6i). Collectively, the TransA-MERFISH data provided a detailed neuronal connectivity map from the retina to SC at the level of cell types, offering functional insights into parallel retinotectal circuit organization and further validating the sensitivity and specificity of this tool for mapping comprehensive connectomes in a high-throughput manner.
Selective connectivity from ooDSGCs to SC neurons
A notable finding emerged from analysis of the synaptic target cell types of Cartpt-cre-labelled RGCs, which are ooDSGCs that are reported to prefer upward (dorsal) or downward (ventral) motion24,42. Cartpt+ ooDSGCs innervated 3 ENC clusters (ENC1, ENC2 and ENC4) as well as 4 INC clusters (INC3, INC4, INC5 and INC9) (Figs. 2i,j and 3c). The strongest targets of ooDSGCs, ENC1 and ENC2, are excitatory clusters marked by Cdh7 (Figs. 1g and 3a–d and Extended Data Fig. 2d). They are in the most superficial 100 µm of SGS, commingled with INC1 neurons, which are marked by Cbln4 (Fig. 1g) and are negative for mWmC labelling (Fig. 3c,d). Notably, the permutation test on TransA-MERFISH data (Fig. 2d,e) also showed that ENC1 and ENC2 have the highest synaptic enrichment for innervation from the retina, whereas INC1 neurons have the lowest (Fig. 2e), emphasizing the importance of cell-type-specific molecular properties among these neuron clusters in recruiting ooDSGC input.
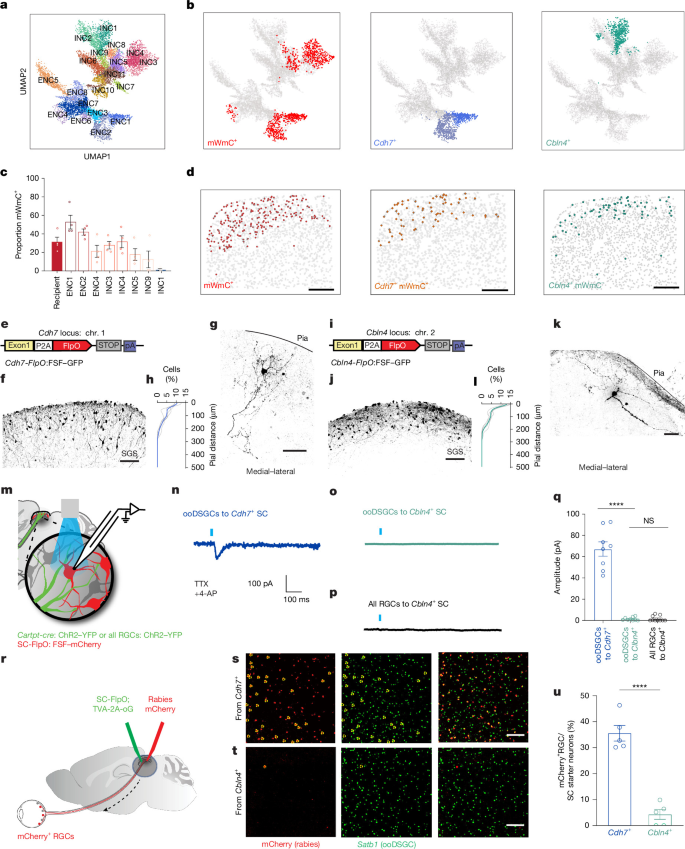
a,b, UMAP plot (a) and mWmC+ ooDSGCs-recipient neurons (b, left). b, Middle, Cdh7 marks all ENCs innervated by ooDSGCs (ENC1 and ENC2). b, Right, Cbln4 marks one mWmC− SC cluster (INC1). c, Proportion of mWmC+ neurons in clusters. INC1 (Cbln4+) does not receive retinal inputs. a–c, n = 4 mice. d, Spatial embedding plots showing sublaminar distributions of mWmC+ neurons innervated by ooDSGCs (left), Cdh7+ mWmC+ ENCs (middle) and Cbln4+ mWmC− INC1 neurons (right). n = 1,423 cells. Scale bars, 200 µm. e,i, Cdh7-FlpO (e) and Cbln4-FlpO (i) knock-in alleles. Chr. chromosome. f,j, Representative images of Cdh7-FlpO (f) and Cbln4-FlpO (j) expression. Scale bars, 250 µm. g,h,k,l, Cdh7-FlpO; FSF–eGFP labelling of ENC1 and ENC2 (g) and quantification of the distribution along the dorsal–ventral axis (h) (n = 5 mice). Cbln4-FlpO; FSF–EGFP labelling of INC1 in the superficial sublamina (k) and quantification of the distribution along the dorsal–ventral axis (l). n = 5 mice. Biocytin filling of Cdh7+ (g) and Cbln4+ (l) SC neurons. Scale bar, 100 µm. Representative images from three independent experiments with similar results. m, Schematic of method used to examine connectivity using CRACM. Adapted from ref. 6, Springer Nature. n, Average of excitatory postsynaptic current (EPSC) traces in a Cdh7+ SC neuron evoked by ChR2 in ooDSGCs. The blue rectangle indicates the stimulation. n = 3 mice, 8 cells. o, Sample EPSC in a Cbln4+ SC neuron, evoked by exciting ChR2 in ooDSGCs. n = 6 mice, 9 cells. p, Sample EPSC recorded in a Cbln4+ SC neuron, evoked by exciting ChR2 in all RGCs. n = 5 mice, 10 cells. q, Quantification of EPSCs in n–p. Each dot represents one cell. ****P = 3.14 × 10⁻⁸. r–t, Schematic of retrograde tracing from SC (r) to retina, and immunostaining for Satb1+ (green) and rabies-infected (red) RGCs from Cdh7+ SC neurons (s) or Cbln4+ SC neurons (t). Scale bars, 200 µm. Adapted from ref. 6, Springer Nature. u, Ratios of retrogradely labelled mCherry+ RGCs to starter neurons in SC, presented as percentages. P = 2.29 × 10⁻⁵. Two-sided unpaired Student’s t-test. n = 5 mice. Data are mean ± s.e.m.
The lack of mWmC labelling from ooDSGCs in INC1 was unexpected, because a recent study combining calcium imaging with post hoc in situ hybridization found that Cbln4+ SC neurons were strongly direction-selective31. Moreover, other studies have suggested that SC direction selectivity depends on ooDSGCs43,44. Together, these results appear to predict that the strongly direction-selective Cbln4+ SC neurons would be innervated by ooDSGCs. Therefore, to verify these findings, we generated the FlpO knock-in lines Cdh7-FlpO (Fig. 3e–h, Extended Data Fig. 5j,k,p,q and Methods) and Cbln4-FlpO (Fig. 3i–l, Extended Data Fig. 5l–o and Methods), and performed CRACM, mWmC anterograde tracing and rabies retrograde tracing. All of these methods confirmed strong monosynaptic input from ooDSGCs to Cdh7+ SC neurons (Fig. 3m,n,r,s and Extended Data Fig. 8a–c,h,j,l) but not from ooDSGCs to Cbln4+ SC neurons (Fig. 3m,o,r,t and Extended Data Fig. 8d,e,i,j,m). Moreover, mWmC anterograde and rabies retrograde tracing found negligible input from RGCs in either the contralateral or ipsilateral eye to Cbln4+ SC neurons, and CRACM using all RGC expression of ChR2 did not detect monosynaptic input from contralateral RGCs to Cbln4+ SC neurons, consistent with the TransA-MERFISH data (Figs. 2a and 3p,q,u and Extended Data Fig. 8f,g,k,n,o). These experiments thus validate the unexpected finding from TransA-MERFISH that the strongly direction-selective Cbln4+ SC neurons are not innervated by ooDSGCs from either the contralateral or ipsilateral eye (Figs. 2f,i,j and 3q and Extended Data Fig. 8d,e,k,o). These results demonstrate the specificity and sensitivity of TransA-MERFISH for systematic synaptic target cell-type mapping, enabling biological discovery.
Direction selectivity of Cbln4 + cells is ooDSGC-independent
The preceding circuit tracing data suggested that Cdh7+ SC neurons may inherit their direction selectivity from ooDSGCs, whereas Cbln4+ SC neurons may not. A key functional prediction of this differential wiring is that the direction selectivity of Cdh7+ SC neurons depends on the retinal ooDSGC circuit, whereas that of Cbln4+ SC neurons does not. To test this prediction, we used two-photon calcium imaging (Fig. 4a,d,i,l) to analyse the direction selectivity of both SC cell types at baseline and after ablation of starburst amacrine cells (SACs), which reduces direction selectivity of ooDSGCs45 (Fig. 4b,c,j,k,q,r and Extended Data Fig. 9a–f). Consistent with predictions from our TransA-MERFISH experiments, SAC ablation reduced the direction selectivity of Cdh7+ SC neurons (Fig. 4c,f–h) but not of Cbln4+ SC neurons (Fig. 4k,n–p). We further examined the contribution of ipsilateral retinal ooDSGCs by covering the ipsilateral eye and ablating SACs bilaterally (Extended Data Fig. 9m,o) and found no changes in direction selectivity in Cbln4+ SC neurons (Extended Data Fig. 9n,p). These data indicate that the direction selectivity of Cbln4+ SC neurons is independent of retinal ooDSGCs, whereas Cdh7+ SC neurons inherit direction selectivity from retinal ooDSGCs. Together, these data support the notion that multiple mechanisms underlie computationally distinct direction selectivity across different SC neuron types, including retinal ooDSGC-dependent direction selectivity in Cdh7+ SC neurons and retinal ooDSGC-independent direction selectivity in Cbln4+ SC neurons. Analysis of the preferred directions of these two populations revealed another marked difference: in the imaged region of SC (posterior and medial), Cdh7+ SC neurons showed a broad distribution in preferred directions (Fig. 4q and Extended Data Fig. 9g–i), whereas Cbln4+ SC neurons preferred a very narrow distribution of direction, mainly preferring dorsal-to-nasal motion (Fig. 4r and Extended Data Fig. 9j–l). These differential population biases suggest that these neurons are likely to participate in distinct circuits (Fig. 4s).
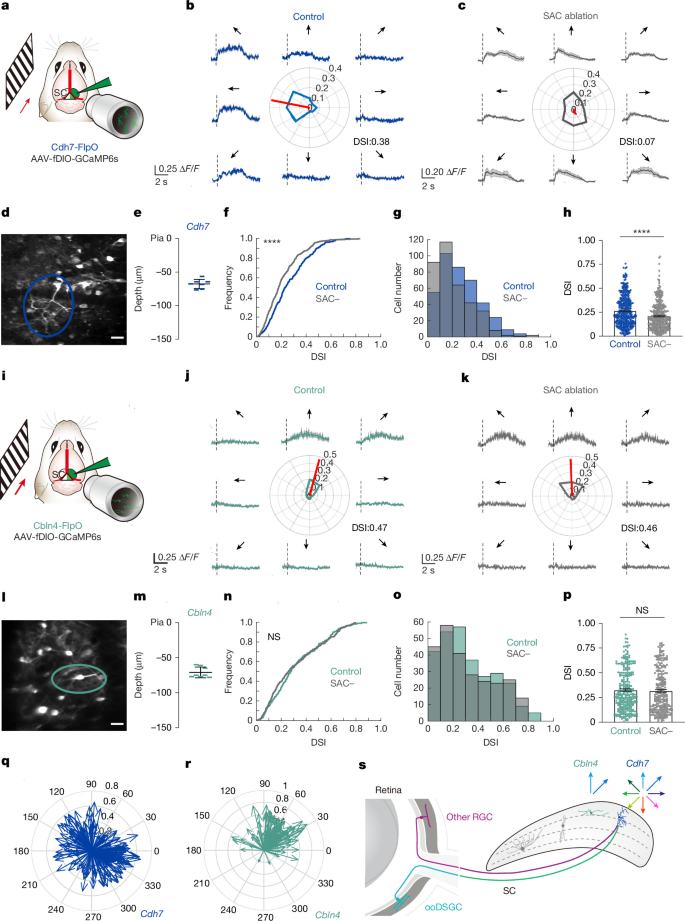
a, Schematic of two-photon calcium imaging in SC with moving grating visual stimuli in eight directions. b,c, Sample traces for one Cdh7+ SC neuron in a control mouse. Colour-coded traces are the mean of six trials; grey traces are the s.e.m. b, Sample traces of one Cdh7+ SC neuron before (b) and after (c) retinal SAC ablation. The red arrow indicates the preferred direction and direction selectivity index (DSI). The colour-coded polygon is the vector sum of responses in each direction. d,e, Imaged Cdh7+ SC neurons showing stellate neuron morphology (d; within blue circle) and depths from pia of imaged populations (e). Scale bar, 10 µm. n = 7 mice. f–h, Cumulative frequency (f; Kolmogorov–Smirnov test, P = 1.02 × 10⁻⁵), distribution (g) and average (h; two-sided unpaired Student’s t-test, P = 7.355 × 10⁻⁷) DSI in control (blue) and SAC ablation (SAC−) conditions. Each dot represents one cell. Control: mean DSI = 0.27; SAC ablation: mean DSI = 0.21. n = 5 mice, 393 cells. i–k, As in a–c, but for Cbln4+ SC neurons. l,m, Imaged Cbln4+ SC neurons showing horizontal cell morphology (l; inside green circle) and depths from pia of imaged neurons (m). Scale bar, 10 µm. n = 8 mice. n–p, As in f–h, but for Cbln4+ SC neurons. Control: mean DSI = 0.32; SAC ablation: mean DSI = 0.32. n = 5 mice, 283 cells. NS, P = 0.4144. q, Distribution of preferred directions across imaged Cdh7+ SC neurons: Cdh7+ SC neurons showed a broad distribution. r, As in q, but for Cbln4+ SC neurons. Cbln4+ SC neurons exhibited a very narrow distribution, mainly preferring dorsal-to-nasal motion. s, Illustrative model of the wiring diagram from ooDSGCs to Cdh7+ SC neurons, but not to Cbln4+ SC neurons. Both SC neuron populations display strong direction selectivity. Data are mean ± s.e.m. Two-sided unpaired Student’s t-test unless stated otherwise.
Discussion
Here we establish TransA-MERFISH as a high-throughput platform for systematic circuit mapping in the mammalian brain. Using this platform, we implemented a stepwise strategy to decode direction-selective circuits in the early visual pathway. First, we applied TransA-MERFISH to four major RGC subclasses and generated a comprehensive wiring diagram of their synaptic target cell types in the SC at the resolution of individual neuron types. Second, by focusing on the downstream targets of ooDSGCs, we identified two distinct, genetically defined SC neuron populations within the same sublamina of the sSC: Cdh7+ SC neurons, which receive monosynaptic ooDSGC inputs, and Cbln4+ SC neurons, which do not receive such inputs. Third, we used in vivo two-photon calcium imaging to show that selective removal of direction-selective responses from ooDSGCs reduces direction selectivity in Cdh7+ but not in Cbln4+ SC neurons. This result reveals that the SC contains intermingled cell types whose direction selectivity arises from distinct circuit origins and computational mechanisms. Finally, we note that the TransA-MERFISH approach introduced here could be generalized to other regions of the mammalian central nervous system (CNS)46 to directly merge connectivity and cellular taxonomy at cell-type resolution. Scaling up the TransA-MERFISH approach may offer an efficient pathway to achieve comprehensive mammalian connectivity mapping at neuron type resolution, by benchmarking with recent connectomic milestones in zebrafish34 and Drosophila47.
Our study presents the following technical innovations. First, TransA-MERFISH bridges cell identity and connectivity, enabling high-throughput, single-cell-type connectivity reconstruction while reducing cost and complexity. Its throughput lays the groundwork for scalable mapping of synaptic target cell types throughout the CNS. Validation using orthogonal methods, including CRACM and rabies tracing, confirmed the sensitivity and specificity of TransA-MERFISH. Second, we applied TransA-MERFISH to generate an atlas of retinal-to-SC wiring that links molecular identity, connectivity and function, thereby assigning genetically defined cell types to their roles in motion processing across visual relays. These datasets complement existing large-scale resources such as the Projectome Atlas48, which lacks postsynaptic specificity, and mesoscale input atlases that do not specify presynaptic molecular identities. Collectively, TransA-MERFISH offers a scalable method for multi-region circuit mapping that combines molecular, anatomical and physiological brain features, providing a way to substantially improve understanding of the formation and function of networks of genetically defined neurons. Future applications of this approach should also help us to better understand circuit degeneration, such as in glaucoma49,50, or circuit reconstitution, such as in regenerative therapies for optic neuropathies51.
Our study establishes a streamlined, scalable workflow for circuit mapping by combining single-component anterograde trans-neuronal tracer (mWmC) with hybridization-based spatial transcriptomics technology (MERFISH). Although mWmC-mediated anterograde tracing6 and TransA-MERFISH yield non-zero false-positive and false-negative rates, these are largely negligible at the level of specific cell types and frequently reflect inherent biological variability in cell-type connectivity, as also evident in our CRACM data. Furthermore, we independently validated these connectivity predictions using complementary genetic and functional experiments. mWmC-mediated anterograde circuit decoding can be generalized to various circuits in the nervous system, including thalamocortical circuits46, hypothalamic circuits52, hippocampal circuits53 and enteric circuits54. Thus, TransA-MERFISH will serve as a scalable circuit-mapping approach that will be broadly applicable across the mammalian nervous system, beyond retina-to-brain connectivity mapping6,46. Ultimately, these experiments establish a powerful proof of principle for pairing anterograde trans-neuronal tracing with spatial transcriptomics. This generalized framework is highly adaptable to other spatial transcriptomics platforms, as well as to other anterograde trans-neuronal tracers, including genetically encoded reporters with AAV1-Cre/Flpo55,56 for regional targeting or ATLAS57 for isolating strictly excitatory synaptic connections.
Using TransA-MERFISH, we gleaned critical insights into how motion information encoded by retinal direction-selective circuits is transmitted and transformed along mammalian early visual pathways. Since their discovery more than half a century ago1, ooDSGCs have served as a powerful model for dissecting the circuit mechanisms underlying motion selectivity in the retina. However, how downstream cell populations process this information remains unclear. SC has also been extensively studied for its direction selectivity, with abundant direction-selective responses observed across species from mice to primates. Direction selectivity in SC is thought to depend on ooDSGCs because SAC perturbations reduce overall direction selectivity in SC. However, these effects were not analysed at the level of genetically defined SC cell types43. Using TransA-MERFISH to systematically map connectivity between ooDSGCs and SC cell types, we found an unexpected relationship between the reported direction selectivity of SC cell types and their connectivity with ooDSGCs. Most notably, the cell type (Cbln4+) that was previously reported as the most strongly direction-selective in SC receives little to no input from ooDSGCs. This wiring diagram yielded testable predictions, which functional experiments confirmed: direction selectivity of Cbln4+ SC neurons is ooDSGC-independent, whereas the direction selectivity of other SC cell types is ooDSGC-dependent. Notably, a prominent body of literature has debated the relationship between retinal and cortical direction selectivity, revealing that the primary visual cortex mostly computes direction selectivity de novo through intrinsic cortical circuitry while also containing a subset of neurons that inherit hardwired, specialized retinal motion streams via the dorsal lateral geniculate nucleus58,59. Recent findings suggest that these parallel channels serve distinct functional roles: inherited retinal pathways appear to sense more local motion, such as object motion, and non-inherited retinal pathways appear to sense more global motion, such as optic flow60. Our findings demonstrate that parallel inherited and computed direction selectivity responses are a fundamental strategy used by both cortical and subcortical structures that may support detection of different forms of behaviourally relevant motion, such as self-generated versus external motion. Together, our findings suggest that SC comprises intermingled subnetworks of disparate genetically defined direction-selective cell types: one downstream of ooDSGCs and a second ooDSGC-independent. Thus, TransA-MERFISH enables systematic, high-throughput discovery of neuronal wiring diagrams at cell-type resolution to reveal circuit mechanisms.
Methods
Mice
All animal experiments were approved by the Institutional Animal Care and Use Committees at the University of California, San Francisco. Mice were maintained on a C57BL/6 background under specific pathogen-free conditions in a 12 h light:12 h dark cycle with food and water available ad libitum. Immunohistochemistry experiments were carried out using postnatal day 30–90 (P30–P90) mice unless indicated otherwise. Slice electrophysiological recordings and in vivo calcium imaging were performed in young adults (P60–P90). MERFISH experiments on the SC were performed in P30–P90 mice. Both sexes were used in approximately equal numbers; no sex-specific differences were observed in retinotectal connectivity, electrophysiological recording and calcium imaging experiments. Genotypes were determined by PCR from toe biopsies. The following mouse lines were used in this study: Kcng4-cre (JAX, 029414)37 was previously established for studies of RGC subclasses—Kcng4-cre marks all αRGC subtypes; Cartpt-cre (JAX, 028533)38 was previously established for studies of RGC subclasses—Cartpt-cre marks multiple subtypes of ooDSGCs42; Foxp2-cre (JAX, 030541)39 was previously established for studies of RGC subclasses—it marks 5 Foxp2-RGC subtypes categorized as F-RGCs; Tusc5-cre was generated in this study to mark all T5-RGCs31—the specific retinal expression pattern in RGCs is verified in Extended Data Fig. 6 (a detailed characterization of the Tusc5 knock-in line is in a separate manuscript in preparation by X.D.); ChAT-Cre mice (JAX, 006410) have been characterized as a tool to label and manipulate SACs in conjunction with AAV-mediated perturbations61.
Generation of Cdh7-FlpO and Cbln4-FlpO mouse lines
To generate the Cdh7-FlpO mouse line for genetic access to Cdh7-expressing SC excitatory neurons, a FlpO recombinase cassette was inserted into exon 1 of the endogenous Cdh7 locus (chr. 1:109909967–110073002) by CRISPR–Cas9-mediated homology-directed repair. The donor construct contained the FlpO coding sequence flanked by 5′ and 3′ homology arms corresponding to the targeted Cdh7 genomic locus. Founder mice were screened by PCR using both internal and external primer pairs to verify correct 5′ and 3′ integration of the knock-in allele, and the targeted locus was further confirmed by Sanger sequencing across the insertion junctions. Two single guide RNA (sgRNA) sequences were used for the recombination: (sgRNA-Cdh7#1: AAAGATGAAGCTGGGCAAAGTGGAG and sgRNA-Cdh7#2: TTTTCTACAGCTTATAGCTC). Two germline-transmitting founders were bred to establish the Cdh7-FlpO mouse line. One line was validated for its FlpO expression specificity when compared with endogenous Cdh7 transcripts using RNAscope fluorescent in situ hybridization (Extended Data Fig. 5).
To generate the Cbln4-FlpO mouse line for genetic access to Cbln4-expressing SC inhibitory neurons, a FlpO recombinase cassette was inserted into exon 1 of the endogenous Cbln4 locus (chr. 2:171878256–171885386) using CRISPR–Cas9-mediated homology-directed repair strategy. Correct targeting was verified by PCR across both the 5′ and 3′ recombination junctions using internal and external primer pairs, followed by Sanger sequencing of the targeted allele. One sgRNA sequence was used for recombination: sgRNA-Cbln4#1 (TTGCGCACGCGGGCTCACCATG). Three germline-transmitting founders were bred to establish the Cbln4-FlpO mouse line. One line was validated for its FlpO expression specificity when compared with endogenous Cbln4 transcripts using RNAscope fluorescent in situ hybridization (Extended Data Fig. 5j–q).
Viral vectors
- 1. AAV2-CAG-mWGA-mCherry (mWmC, Addgene ID 263583) was produced as AAV Serotype 2 (Virovek, catalogue no. 117-UCSF89, at 2 × 10¹³ vg ml−1), following Tsai et al.6 and produced at Virovek using bacterial artificial chromosome (BAC)-to-AAV technology to enable stable expression and high-titre AAV production. This vector was used in Fig. 2 to label all RGCs and examine their neuronal output in SC.
AAV2-CAG-mWGA-mCherry (mWmC, Addgene ID 263583) was produced as AAV Serotype 2 (Virovek, catalogue no. 117-UCSF89, at 2 × 10¹³ vg ml−1), following Tsai et al.6 and produced at Virovek using bacterial artificial chromosome (BAC)-to-AAV technology to enable stable expression and high-titre AAV production. This vector was used in Fig. 2 to label all RGCs and examine their neuronal output in SC.
- 2. AAV2-CAG-DIO-mWGA-mCherry (DIO-mWmC, Addgene ID 263584) was produced as AAV Serotype 2 (Virovek, catalogue no. 117-UCSF86, at 4 × 10¹³ vg ml−1) following Tsai et al.6 and produced at Virovek using BAC-to-AAV technology. This vector was used in Fig. 3 and Extended Data Fig. 6 to label specific types of RGCs and analyse their output in SC.
AAV2-CAG-DIO-mWGA-mCherry (DIO-mWmC, Addgene ID 263584) was produced as AAV Serotype 2 (Virovek, catalogue no. 117-UCSF86, at 4 × 10¹³ vg ml−1) following Tsai et al.6 and produced at Virovek using BAC-to-AAV technology. This vector was used in Fig. 3 and Extended Data Fig. 6 to label specific types of RGCs and analyse their output in SC.
- 3. AAV2-CAG-ChR2-mCherry-WPRE (Addgene ID 100054) (Serotype 2 produced at Boston Children’s Hospital Viral Core, at 2× 10¹³ vg ml−1) was used in Fig. 2 for CRACM experiments from all RGCs to examine their connectivity onto SC neurons.
AAV2-CAG-ChR2-mCherry-WPRE (Addgene ID 100054) (Serotype 2 produced at Boston Children’s Hospital Viral Core, at 2× 10¹³ vg ml−1) was used in Fig. 2 for CRACM experiments from all RGCs to examine their connectivity onto SC neurons.
- 4. AAV2-EF1α-DIO-ChR2(H134R)-mCherry (Addgene ID 20297) (Serotype 2 produced at UNC Viral Core, at 2 × 10¹³ vg ml−1) was used in Fig. 3 for CRACM experiments in Cartpt-cre mice to assess connectivity with SC neurons in the RFP channel.
AAV2-EF1α-DIO-ChR2(H134R)-mCherry (Addgene ID 20297) (Serotype 2 produced at UNC Viral Core, at 2 × 10¹³ vg ml−1) was used in Fig. 3 for CRACM experiments in Cartpt-cre mice to assess connectivity with SC neurons in the RFP channel.
- 5. AAV2-EF1α-FDIO-GFP-WPRE (Addgene ID 203843) was used to label SC neurons in Cdh7-FlpO and Cbln4-FlpO lines in the GFP channel.
AAV2-EF1α-FDIO-GFP-WPRE (Addgene ID 203843) was used to label SC neurons in Cdh7-FlpO and Cbln4-FlpO lines in the GFP channel.
- 6. AAV8-EF1α-FDIO-GCaMP6s (Addgene ID 105714) was used to label SC neurons in Cdh7-FlpO and Cbln4-FlpO lines for in vivo calcium imaging.
AAV8-EF1α-FDIO-GCaMP6s (Addgene ID 105714) was used to label SC neurons in Cdh7-FlpO and Cbln4-FlpO lines for in vivo calcium imaging.
- 7. AAV2-Flex-taCasp3-TEVp (Addgene ID 45580) (Serotype 2 produced at UNC Viral Core, at 2 × 10¹³ vg ml−1)62 was used to selectively ablate retinal SACs in ChAT-Cre mice.
AAV2-Flex-taCasp3-TEVp (Addgene ID 45580) (Serotype 2 produced at UNC Viral Core, at 2 × 10¹³ vg ml−1)62 was used to selectively ablate retinal SACs in ChAT-Cre mice.
- 8. AAV8-hSyn-FRT-TVA-P2A-EGFP-2A-oG63 was modified and produced by X.C., as Serotype 8, at 2× 10¹³ vg ml−1, which enabled efficient, FlpO-dependent retrograde tracing in restricted neuronal subsets, including Cdh7-FlpO and Cbln4-FlpO SC neurons, as shown in Fig. 3.
AAV8-hSyn-FRT-TVA-P2A-EGFP-2A-oG63 was modified and produced by X.C., as Serotype 8, at 2× 10¹³ vg ml−1, which enabled efficient, FlpO-dependent retrograde tracing in restricted neuronal subsets, including Cdh7-FlpO and Cbln4-FlpO SC neurons, as shown in Fig. 3.
- 9. EnvA G-deleted Rabies–mCherry (Addgene ID 32636) was obtained from the Salk GT3 Core (catalogue no. 32636). Used in combination with TVA-2A-oG, it enabled retrograde labelling of presynaptic retinal neurons of defined SC starter populations in Fig. 3.
EnvA G-deleted Rabies–mCherry (Addgene ID 32636) was obtained from the Salk GT3 Core (catalogue no. 32636). Used in combination with TVA-2A-oG, it enabled retrograde labelling of presynaptic retinal neurons of defined SC starter populations in Fig. 3.
- 10. AAV2-CAG-membrane bound YFP (AAV-CAG-mYFP, Addgene ID 263585) was modified from AAV-EF1a-BbTagBY (Addgene ID 45185)64. AAV serotype 2 was produced at 2 × 10¹³ vg ml−1 and used for projection axon labelling65. Following intraocular injection, it enabled visualization of axonal projections in SC.
AAV2-CAG-membrane bound YFP (AAV-CAG-mYFP, Addgene ID 263585) was modified from AAV-EF1a-BbTagBY (Addgene ID 45185)64. AAV serotype 2 was produced at 2 × 10¹³ vg ml−1 and used for projection axon labelling65. Following intraocular injection, it enabled visualization of axonal projections in SC.
- 11. AAV2-CAG-DIO-membrane bound YFP (AAV-CAG-DIO-mYFP, Addgene ID 263586) was modified from AAV-EF1a-BbTagBY (Addgene ID 45185). AAV serotype 2 was produced at 2 × 10¹³ vg ml−1 and used in combination with Cre-driver mouse lines to selectively label axons of defined RGC starter populations. This enabled visualization of cell-type-specific RGC axonal projections in SC.
AAV2-CAG-DIO-membrane bound YFP (AAV-CAG-DIO-mYFP, Addgene ID 263586) was modified from AAV-EF1a-BbTagBY (Addgene ID 45185). AAV serotype 2 was produced at 2 × 10¹³ vg ml−1 and used in combination with Cre-driver mouse lines to selectively label axons of defined RGC starter populations. This enabled visualization of cell-type-specific RGC axonal projections in SC.
Optimized protocol to preserve the mouse brain for TransA-MERFISH
The brain preparation for TransA-MERFISH was optimized to preserve immunohistochemical staining and maximize RNA quality for subsequent RNA multiplexing experiments. Young adult mice were deeply anaesthetized and transcardially perfused with ice-cold saline (0.9% NaCl solution), followed by ice-cold 4% paraformaldehyde (PFA) in 0.1 M phosphate buffer (pH 7.4). After dissection, the brains were post-fixed in the same fixative solution overnight at 4 °C. The target brain regions (SC in this study, about 10 mm3 in volume) were micro-dissected, with anteroposterior and dorsoventral orientations carefully marked. This was followed by cryoprotection in 30% sucrose in PBS at 4 °C until the tissues sank (2–4 h). The target regions were embedded in OCT compound and rapidly frozen in a dry ice-cooled 2-methylbutane (Supelco, MX0760-1). Then, approximately 12 µm coronal sections were prepared on a cryostat and collected under RNase-free conditions on MERSCOPE Slides (Vizgen) for RNA-grade processing.
Tissue sectioning for TransA-MERFISH
For each mouse, about 10 coronal sections were obtained using the right SC, which receives contralateral retinal input from the left eye injected with mWmC tracer, from the perfusion–fixation protocol described above. Sections were collected at intervals of every 9 slices (12 µm each, totalling about 100 µm), spanning the anterior-to-posterior axis of the right SC. The coronal sections encompassing the SC were selected based on the Allen Mouse Brain Atlas, corresponding to stereotaxic coordinates relative to Bregma ranging from −3.0 mm to −5.0 mm. The section captures the full dorsoventral extent of the SC, from the superficial visual layers stratum zonale (SZ), SGS, to deep motor-associated layers stratum griseum profundum (SGP) and stratum album profundum (SAP).
Optimized TransA-MERFISH workflow using MERSCOPE
The SC tissues on MERSLIDES (Vizgen, 20400001) were first permeablized in 70% ethanol (4°C) overnight, followed by a series of ethanol gradient dehydration: 90% ethanol at room temperature for 5 min, 100% ethanol at room temperature for 1 h, 90% ethanol at room temperature for 5 min, and then incubated with 70% ethanol at room temperature for 5 min. SC sections were then prepared for MERSCOPE imaging using the MERSCOPE Sample Preparation Kit (Vizgen, 10400012) and following the MERSCOPE User Guide (Fresh and Fixed Frozen Tissue Sample Preparation, 91600002 RevF).
For protein staining, the sample was washed with 5 ml of PBS. Blocking solution (10:1 Blocking Buffer C Premix: RNase inhibitor) (Blocking Buffer C, Vizgen 20300100; RNase inhibitor Murine, NEB M0314L) was then added to the centre of the tissue section and incubated at room temperature for 1 h. The sample was incubated in Primary Staining Solution (100:10:1 Blocking Buffer C Premix: RNase inhibitor: Primary antibody) at room temperature for 1 h. Notably, anti-RFP (rabbit, Rockland 46510) was diluted 1:100 for this step. The sample was subsequently washed with PBS. Secondary Staining Solution (100:10:3:1 Blocking Buffer Premix: RNase inhibitor: Secondary Stain Mix : Protein Stain) (Anti-Rabbit Protein Stain Kit, Vizgen, 10400107) was then added to the sample and incubated for 1 h. The sample was then washed with PBS. Fixation Buffer (4% PFA in PBS) was then added to the tissue section, and the section was incubated at room temperature for 15 min. The sample was then washed with PBS.
Next, for encoding probe hybridization, the sample was incubated in 5 ml Formamide Wash Buffer (Vizgen, 20300002) at 37 °C for 30 min. The Formamide Wash Buffer was then carefully aspirated, and the custom 140-Gene MERSCOPE Gene Panel Mix (Vizgen, VZG180, mouse superficial SC panel; Supplementary Table 1) was added to the tissue section, which was then incubated in a humidified chamber at 37 °C for at least 36 h and up to 48 h. Then, in the post-encoding probe hybridization washes, Formamide Wash Buffer was added to the sample and incubated at 47 °C for 30 min. This wash step was repeated, then the sample was incubated in the Sample Prep Wash Buffer (Vizgen, 20300001) for 2 min.
Then for gel embedding, wash buffer was aspirated from the MERSLIDE, and Gel Embedding Solution (2:10:1 Gel Embedding Premix: 10% w/v ammonium persulfate solution: N,N,N′,N′-tetramethylethylenediamine) (Gel Embedding Premix, Vizgen 20300004; ammonium persulfate, Sigma-Aldrich 09913; N,N,N′,N′-tetramethylethylenediamine, Sigma-Aldrich T7024) was added to cover the tissue sections. A coverslip pretreated with Gel Slick (VWR, 12001-812) was placed directly over the tissue sections and incubated at room temperature for 90 min to allow the gel to solidify. The coverslip was then removed. Then, the sample was treated to clear it. The sample was incubated in a pre-warmed Clearing Solution (100:1 Clearing Premix: Proteinase K) (Clearing Premix, Vizgen 20300003; Proteinase K, NEB P8107S) at 47 °C for 24 h.
For DAPI and PolyT staining, after removing the Clearing Solution, the sample was washed with a Sample Prep Wash Buffer. DAPI and PolyT Staining Reagent (Vizgen 20300021) were then added to the sample, which was incubated at room temperature for 15 min on a rocker. This was followed by a 10-min wash with Formamide Wash Buffer, then a 5 ml wash with 5 ml Sample Prep Buffer.
Finally, for MERFISH imaging, the sample was loaded onto the MERSCOPE instrument (MERSCOPE1.0, VIZGEN) for imaging, using the MERSCOPE 140 Gene Imaging Kit (Vizgen, 10400004), which automates the MERFISH probe exchange and readout.
MERFISH gene panel design and evaluation
To design an SC-specific MERFISH gene panel, we first assessed the number of genes required to classify SC neuron types. To this end, we implemented a simulation framework based on gradient boosting (XGBoost) using SC single-nucleus RNA sequencing (snRNA-seq) data. In brief, for each neuron cluster, the top k non-redundant specific genes were selected to form a panel. The validation accuracy (using a 70:30 training:test split) was evaluated until a plateau was reached. Thus, after subsetting neuron cells from the adult SC snRNA-seq data28, we then re-clustered the cells using the Seurat standard log-normalization pipeline with the following functions: “NormalizeData” with default parameters, “FindVariableFeatures” (selection.method = ‘vst’), ScaleData (vars.to.regress =”nCount_RNA”), “RunPCA” (npcs=50), FindNeighbors (dims=1:35, dimension chosen by “ElbowPlot”), “FindClusters”, and “RunUMAP” (dim=35). The clusters were labelled based on the original cell-type labels, and 19 Leiden clusters recapitulating the original neuronal cell-type compartments were generated (Extended Data Fig. 2e). We then derived top marker genes for each type using the “FindAllMarkers” function with the “MAST” test (min.pct = 0.2, logfc.threshold=0.25, latent.vars = “nCount_RNA”).
To rank the marker genes, an integrated specificity score was calculated for each gene by retaining only those genes detected in over 40% of cells within the target cell type and calculating a log-ratio specificity score as:
where pct.1 and pct.2 represent the proportion of expressing cells in the target and background populations, respectively, and ϵ = 0.02 is a pseudocount. To integrate both specificity and fold change, z-scores were independently computed for the log-ratio specificity score and the average log2-transformed fold change (avg_log2FC) within each cluster. The final Stouffer score was computed as:
The hybrid score captures both binary specificity (expression prevalence) and quantitative magnitude (fold change), enabling robust ranking of marker genes per cluster.
We next selected the top k (k = 1 to 10) non-redundant, high-specificity marker genes for each neuronal subtype (a total of 19 types, as identified above). We used them as features to train an XGBoost classifier. To ensure comparability across genes, the normalized expression matrix was subset to the selected gene panel and scaled by centreing each gene to its mean and dividing by its standard deviation (z-score normalization across cells). The classifier was trained using a multi-class softmax objective (multi:softprob) over 200 boosting rounds, with a learning rate (η) of 0.2, maximum tree depth of 6, and subsampling rate of 0.6 to mitigate overfitting. The number of output classes was set to the number of unique neuronal subtypes. Training was performed on 70% of the cells (stratified by cluster), and performance was evaluated on the 30% held-out data. For each cell, the predicted label corresponded to the class with the highest probability. A confusion matrix comparing predicted and true labels demonstrated high concordance, confirming that the MERFISH panel accurately recovered neuronal subtype heterogeneity. Classification accuracy as a function of gene panel size was summarized in a line plot (Extended Data Fig. 1e), revealing a performance plateau at 0.8414 when k = 9 (171 genes), followed by a slight decline to 0.8403 at k = 10 (190 genes). Notably, despite the inclusion of additional top marker genes, this accuracy remained lower than that achieved with the MERFISH gene panel (0.91).
Among the 140 genes included in the panel, we selected markers enriched in pan-excitatory, pan-inhibitory and type-specific neuronal populations. The 140 genes include Ntng1, Meis1, Cpne4, Cacna2d1, Sgcd, Spon1, Kctd8, Gpc5, Ptprk, Nxph1, Robo1, Hs3st4, Sorcs3, Chrm3, Mgat4c, Syt1, Car10, Pcbp3, Reln, Trpm3, Meis2, Prkd1, Epha3, Fras1, Il1rapl2, Tmem132d, Fstl4, Erbb4, Ebf3, Ebf1, Maf, Ptprt, Cdh18, Npas3Htr2c, Tfap2b, Etv1, Tshz2, Sorcs1, Lhfp, Col25a1, Sox6, Adarb2, Megf11, Pde1c, Csgalnact1, Cdh8, Chrm2, Tcf7l2, Sphkap, Arpp21, Kirrel3, Zfhx3, Tmem132c, Hcn1 Hdac9, Rorb, Pdzd2, Adam12, Ankfn1, Sntb1, Npnt, Gpc3, Kcnd3, Tpd52l1, Myh8, Cdh7, Barhl1, Kcnab1, Rd3l, Cbln4, Otx2, Gabrr2, Cdhr1, Sox14, Dmbx1, Lhx1os, Galnt14, Tnnt1, Tnni3, Fibcd1, Mgarp, Lmo1, Vwc2, Npffr1, Rnf152, Zfhx4, Tal1, Trim66, Gata3, Syt2, Nrtn, Smim17, Pax7, Cdh13, Slc17a6, Tac1, Cbln2, Kcng3, Kcng4, Cdh4, Pde5a, Gda, Foxp2, Pou4f2, Sema3e, Gad2, Npas4, Sdk2, Ppia, Atp5md, Mllt11, Calb2, Nap1l5, Gap43, Tacr1, C1ql2, Fabp5, Cxcl14, Stmn1, Fos, Snap25, Junb, Pmfbp1, Ntng2, Pcdh20, Satb1, Sv2c, Fign, Gfra1, Syt17, Rasgrf2, Lmo3, Slc19a1, Cplx3, Marcksl1, Cadps2, Calb1, Syt4 and Gad1.
To further benchmark performance, we compared the 140-gene TransA-MERFISH panel against 2 control gene sets: (1) 140 genes randomly sampled from the full snRNA-seq expression matrix; and (2) 140 genes randomly sampled from the top 2,000 highly variable genes (HVGs). For each control set, we sampled genes without replacement and repeated the process 15 times to estimate variability (error bars) in classification accuracy. Using the same classification framework, our panel consistently outperformed both controls and the marker gene approach described above (Extended Data Fig. 1e). Two genes among the 140-gene panel (Sgcd and Ppia) were excluded due to low transcript detection in the TransA-MERFISH SC dataset and poor specificity for SC neuronal types.
Image preprocessing and ROI selection
For each 12 µm tissue section, the MERFISH protocol generated seven 1.7 µm optical sections (z0, z1, … , z6) for DAPI, polyT and mCherry/RFP channels, respectively, as Tiff files under the images folder, together with the micron_to_mosaic_pixel_transform.csv to link the micrometre scale (transcripts and MERSCOPE visualizer) to mosaic pixel scale (Tiff files). Each MERFISH data folder also contains the detected_transcripts.csv file, which includes coordinates for detected transcripts along with their spatial coordinates, as well as other metadata and cell-by-gene information. Cell segmentation information is also generated by the Vizgen Post-processing Tool (VPT). To improve cell segmentation accuracy, we performed independent segmentation using custom scripts and a fine-tuned Cellpose2.0 model tailored to the SC, as described below.
The following steps were conducted: (1) DAPI image preprocessing and initial region-of-interest (ROI) selection. The DAPI image of z-plane 0 for each region is loaded into a Python Jupyter notebook (tifffile.imread), and overexposed pixels are filtered using a cut-off at the 0.95 quantile (np.quantile) to enhance the signal for downstream ROI selection. For each region, the initial ROI was restricted to the right SC hemisphere as our AAV2-mWmC injection was onto the left eye (Fig. 1a) and manually delineated using the processed DAPI image in ImageJ (Analyze-Tools-ROI manager), from the pial surface to encompass superficial SC layers (SZ and SGS) medially toward the midline, extending ventrally to the level of the cerebral aqueduct. This ROI includes both superficial and deeper layers as defined by cytoarchitectonic boundaries in the Allen Mouse Brain Atlas. We then cropped the original DAPI Tiff images of each seven z-plane images of one section to the delineated ROI (using the read_roi function, the matplotlib.patches module’s Polygon class, and the PIL package’s Image module). A maximum z-projection approach was performed over optical sections to enhance cell segmentation signals. To this end, the maximum-intensity projection of all seven z-plane optical sections for each slice was generated using either ImageJ (Images-Stack-Z Project) or Python (numpy.max). Meanwhile, we subset the detected_transcripts.csv file from MERFISH to correspond to the selected ROI (read-roi to load ImageJ ROI file, followed by matplotlib.path.Path in Python), using the micron_to_mosaic_pixel_transform.csv file to transform transcript coordinates (global_x and global_y coordinates) to the mosaic pixel coordinates of the Tiff images, along with gene symbols for each detected transcript.
Cell segmentation and AnnData assembly
Segmentation was performed as in previous MERFISH studies of the mouse brain31. We constructed a labelled image by combining the transcript dots and maximum-intensity projection DAPI images using the get_img function (windowsize=2000, margin=10%) of the ClusterMap package, followed by splitting the data into small tiles (split function) to improve downstream computational efficiency. We set a threshold of 3,000 transcript counts to focus on tiles with denser transcript accumulation. The split tiles were then saved as separate PNG files with DAPI signal and transcript dots overlaid. A customized Cellpose model66 (models.CellposeModel pretrained_model) was used to perform cell segmentation on each tile (gpu=True, channels = [0,0], diameter=80). More specifically, the fine-tuned Cellpose model was generated based on the ‘cyto2’ model using the Cellpose graphical user interface, trained with five regions of interest (containing about 200 manually curated cells each), to improve the performance for dimly/darkly stained cells, smaller cells, and separating multiple cells that were segmented as one. The segmentation output for each tile was subsequently generated using the masks_flows_to_seg function from cellpose.io and saved as a.npy file. The separate tiles were then stitched by merging adjacent patches, while avoiding cell ID collisions and duplication in overlapping regions, to form the full segmentation mask (reassigned_masks.npy), which encompassed the entire tissue section. After all tiles were stitched, connected components in the combined mask were relabelled (skimage.measure.label and regionprops) to ensure sequential, non-overlapping cell IDs. We then assembled the AnnData for downstream analysis by constructing a ClusterMap model for each section, using the transcriptomic spot information (xy_radius=30, z_radius=0, fast_preprocess=False). Centroid positions were calculated from labelled masks using skimage.regionprops, and used to initialize cell-centred AnnData objects. Cells with no transcriptomic counts were excluded by default, and spatial coordinates were stored in the obsm[‘spatial’] field of the AnnData object. We further double-checked the accuracy of the assembled AnnData by comparing the transcript distribution and the segmentation of a specific cell to the combined raw data for DAPI, PolyT, and transcript dots from the same cell in the MERSCOPE visualizer. We then integrated the mean mCherry fluorescence intensity, mWmC registration-related metadata, and the estimated depth (in µm; distance from the pial surface, as described below) into a unified AnnData object.
Last, related to the entire TransA-MERFISH data integration, for consistency with the ROI of other data modalities, such as electrophysiology and calcium imaging, we also further restricted the above-selected ROI to rectangular regions, avoiding the midlines and lateral regions, encompassing from the pial surface to SO by examining the spatial expression of Npnt and Etv1 (Fig. 1j). Subsequent clustering and transcriptomic analyses of the resulting cell-by-gene matrix were performed using Scanpy (v1.10.4) and Squidpy (v1.6.2), as detailed in the following sections.
Computational pipeline to register mWmC+ cells in TransA-MERFISH
To register mWmC+ cells in the TransA-MERFISH dataset, we implemented an automated registration workflow based on per-cell mCherry intensity, supplemented by manual curation. First, we derive the per-cell mean mCherry intensity by aggregating the mean mCherry pixel intensity at each z-layer (z = 1:6, excluding z0 to avoid potential optical noise). The aggregated value was then divided by the number of z-planes (six in this case, as the maximum-intensity projection-derived cell segmentation mask was shared across z-planes), yielding a per-cell mean mCherry intensity across z-planes. The frequency distribution of the per-cell mean mCherry intensity showed a predominantly bimodal distribution of red fluorescence. Second, we assigned an mWmC-positive score using the mean intensity value from the inner cytoplasm ring area and an adjacent out-of-cell annulus as a local background estimate. The positive cells were identified by applying a threshold based on the distributions from a control ROI (in the lower, non-retino-recipient area with the lowest red fluorescence signal) on the same slice. Last, mWmC+ cells were proofread by two independent annotators for all slices, who examined the red fluorescence overlaid on the DAPI and PolyT labelling, with or without segmented cell masks, using Vizgen MERSCOPE Visualizer. The Python script for the workflow was deposited on GitHub (https://github.com/duanxlab/TransA-MERFISH).
For the background-corrected per-cell quantification of mCherry fluorescence, we implemented an integrated workflow for image denoising, fluorescence background removal, per-cell mWmC score calculation, and threshold assignment following the steps below.
First, background correction: to remove uneven illumination and background fluorescence (especially signals in axons, which reside in the same lamina as the recipient neurons), we applied a multi-threaded rolling-ball background subtraction algorithm to the RFP channel image. For each section, the maximum-intensity projection of z0–z7 optical planes was used as input. The image was processed in overlapping tiles (4,096 × 4,096 pixels) with a rolling-ball radius of 80 pixels. For each tile, the background surface was computed using the skimage.restoration.rolling_ball function, and the results were then merged across tiles to form a continuous background field. The corrected image was obtained by subtracting this field from the raw mosaic and clipping negative values to zero. The resulting background-subtracted image was used for downstream analyses. After this correction, the background intensity was reduced to baseline, thereby removing the haze surrounding individual cells. By contrast, the pixel intensity within cell masks is largely preserved. Second, further background removal and per-cell signal quantification: following the above background correction by rolling ball, residual local background (for example, neuropils and axons) around each labelled soma was estimated and removed using a ring-based subtraction procedure. In brief, for each segmented soma (cell i), the soma mask was eroded by 1 pixel to define a core region and then dilated by a 4-pixel guard band to prevent the background annulus from abutting the soma edge. This guarded soma was then surrounded by a series of concentric annuli (inner width = 8 pixels; outer radius range = 12–30 pixels) from which background intensity was sampled. Background pixels were sampled from the annulus after excluding any pixels belonging to other cells. The local background level Bi was defined as the 25th percentile of annular intensities. The corrected image \({I}^{{\prime} }(x,y)\) was computed as,
For every soma and the designated ring configuration, we reported pre- and post-subtraction statistics within the inner measurement region (soma-adjacent ring):
along with background noise estimates from the annulus:
along with \({\sigma }_{\text{STD}}\) (sample standard deviation). After the removal of local background, the above-defined inner ring shows an improved local signal-to-noise ratio, and mWmC puncta signals stand out more.
Third, to define an internal control region and identify mWmC-positive cells in each section, we implemented automated identification of the control region and quantification of mWmC+ cells. In this pipeline, we used an automated depth-aware sliding-window analysis. For each cell i, the locally background-corrected fluorescence intensity was summarized by the mean pixel intensity within the soma’s inner measurement ring after local background subtraction, as described above. Cell centroids were computed from the segmentation mask, and a sliding window of height 800 µm was moved along the pial-to-deep axis in 100-µm increments. Within each window w, we computed the cumulative fluorescence energy as \({S}_{w}=\sum _{i\in w}{I}_{i},\) where Ii is the per-cell fluorescence metric (post-subtraction inner ring mean intensity in this case). Windows with fewer than 15 cells were excluded. The resulting curve Sw versus depth was smoothed with a seven-point moving average, and the valley (minimum) among valid windows was selected as the centre of the control region, corresponding to the zone of lowest cumulative signal (background). From this valley, the control region was symmetrically expanded until at least 600 cells were included. The final control region was exported as a rectangular ROI spanning the full mediolateral width. For all cells within the control ROI, Ii were aggregated to estimate the control population mean (μctrl) and standard deviation (σctrl). We then defined mWmC+ cells using the below threshold: after trimming the top 2% of brightest cells to exclude outliers confounded by, for example, neighbouring overexposed pixels, thresholds for positive detection were defined as T5σ = μctrl + 5σctrl as the baseline to register mWmC+ cells.
Finally, with the per-cell mWmC information, we further assigned a cell type as mWmC+ (retino-recipient) by first deriving the mWmC+ cell profiles across different cell types using the methods described above. Encouragingly, automatically assigned mWmC+ cell profiles correlate strongly with manual annotations, indicating consistency across methods. To quantify enrichment of mWmC+ cells across neuronal subtypes, we computed an enrichment score for each tracing and cell type using the following steps. For each tracing × cell type, we constructed a 2 × 2 table of mWmC+ and mWmC− counts inside the cell type versus all other cells and applied a one-tailed Fisher’s exact test (alternative = “greater”). The odds ratio (OR) was computed as:
where a and b are the numbers of mWmC+ and mWmC− cells within the given subtype, and c and d are the corresponding counts outside that subtype. The effect size was visualized as log2(OR) (values < 0 clipped to 0). At the same time, statistical evidence was encoded by a point area proportional to −log10(P). Cell types with positive enrichment (log2(OR) > 0) were highlighted with a red outline (Fig. 2o). We assign a cell type as positive or connected under a specific tracing condition when the log2(OR) value is greater than 0 (enrichment). Based on the mWmC+ cell types assigned here, we summarized the mean mWmC+ cell proportion across animals (error bar: s.e.m.) as bar plots (Figs. 1k and 3c).
Clustering and dimension reduction
The neuronal subset was re-clustered using a similar framework as described above. To determine parameters better reflect internal data structure and cell-type granularity, we chose clustering parameters based on statistical assessment and established parameter selection tools. Principal component dimensionality (n_pcs = 12) was selected based on inspection of the variance explained curve (sc.pl.pca_variance_ratio). Clustering resolution was subsequently determined using the clustering tree approach implemented in the clustree R package to assess cluster stability across multiple resolutions, and a resolution of 1.5 was selected. The parameter selections here allowed us to settle on a granularity of cell types that best represent the internal data structure in an unbiased way. These clusters were then labelled using the approaches described below. Subsequent comparisons to published SC atlas showed high consistency, for example, when compared to the 10x Whole Mouse Brain Atlas at supertype level, supporting the robustness of selected parameters and the resulting granularity of cell types.
To perform clustering and dimension reduction, we first applied SCTransform-based normalization67 to the expression matrix for each MERFISH section. This was enabled by accessing the SCTransform algorithm implemented in the R package via rpy2 from Python. Prior to normalization, raw counts were stored in adata.layers[‘raw_counts’]. A quality control filtering step was then applied to remove low-quality features, retaining genes detected in at least 5 cells (sc.pp.filter_genes) and cells with a total count of at least 5 (sc.pp.filter_cells). After filtering, the sparse matrices were explicitly sorted to ensure compatibility. Each AnnData object was converted to a Seurat object (as.Seurat()), and SCTransform was applied (do.correct.umi = FALSE). SCTransform models sequencing depth (library size/total unique molecular identifiers (UMIs)) as a technical covariate during normalization. The full set of normalized gene expression values was extracted from the SCT assay’s scale.data slot and stored in adata.layers[‘normalized’], ensuring that any genes missing post-normalization were reintroduced as zero-filled vectors to retain consistency with the original feature set. The normalized matrix was then assigned to adata.X for downstream analysis. Raw counts were preserved in adata.raw, and standard quality control metrics (n_genes_by_counts, total_counts) were computed using the raw layer. Based on the quality control metrics, two sections with low quality and significantly lower counts were excluded from further analysis.
The AnnDatas of the remaining MERFISH slices were subsequently merged using scanpy (v1.10.4; abbreviated as sc onwards) with ad.concat (merge = ‘unique’, index_unique=None), yielding a combined dataset of 47,740 cells. Cell identifiers were made unique across slices, and principal component analysis was performed on the merged expression matrix (sc.tl.pca). The variance explained by each component was examined to guide dimensionality reduction (sc.pl.pca_variance_ratio). A neighbourhood graph was constructed using the top 15 principal components (n_pcs = 15) and 30 nearest neighbours (n_neighbors = 30) by sc.pp.neighbors. UMAP was then applied for two-dimensional embedding (sc.tl.umap). Unsupervised clustering was carried out using the Leiden algorithm with a resolution parameter of 0.8 (sc.tl.leiden). We examined the distribution of quality control metrics across the clusters. We found high consistency of n_genes_by_counts and total_counts across clusters except lower detection rate in one cluster (Extended Data Fig. 1h), which was identified as non-neuronal cells via the SC XGBoost classifier as described above (Extended Data Fig. 1i). To improve classification resolution, the non-neuronal cluster was excluded, yielding 46,277 high-quality transcriptomic profiles for neuronal cells. The neuronal subset was re-clustered using a similar framework as described above. Principal component dimensionality (n_pcs = 12) was selected based on inspection of the variance explained curve (sc.pl.pca_variance_ratio). Clustering resolution was subsequently determined using the clustering tree approach implemented in the clustree R package to assess cluster stability across multiple resolutions, and a resolution of 1.5 was selected. These clusters were then labelled using the approaches described below.
Classification and transcriptomic correspondence to the past SC atlas
To robustly identify the molecular identity of the above-identified MERFISH clusters, we took the following steps to classify the identified clusters and compare them to established SC atlases: first, we examined the gene expression pattern for a set of SC canonical marker genes (Fig. 1g) and the dendrogram between these clusters based on hierarchical clustering of averaged expression per cluster (sc.tl.dendrogram). Second, we aligned our MERFISH data to the 10x Whole Mouse Brain (CCN20230722) taxonomy30 using the MapMyCells tool suite from the Allen Institute. Third, we utilized the XGBoost classifier, as described above, to link the MERFISH data to our and other published SC scRNA-seq or snRNA-seq neuron-type atlases6,27,28, using the shared genes between the MERFISH panel and the snRNA-seq genes as features (Extended Data Fig. 2c,g,j). Finally, we compared the expression pattern of key marker genes between our data and previously published SC datasets (Extended Data Fig. 2d). Overall, the identified clusters captured the neuronal diversity of the SC at high resolution, demonstrating strong concordance—and in some cases, enhanced granularity—compared to established reference atlases.
Permutation analysis of SC neuron types in connectivity
We implemented a sublaminar-controlled cell-type specificity analysis to test the specificity of each SC type in specifying the connections with presynaptic RGC inputs (Fig. 2d). The analysis is based on a permutation-based statistical framework with Stouffer z-score aggregation across mice. More specifically, to assess cell-type–specific enrichment or depletion of mWmC+ labelling independent of sublaminar distribution, we performed a sublaminar-controlled permutation test. Within each mouse, SC neurons were binned by soma depth (50 µm unless otherwise specified). Within each (animal × depth bin) stratum, cell-type labels were randomly shuffled, thereby preserving the sublaminar distribution of mWmC labelling while disrupting the association between cell-type identity and mWmC labelling. All permutation tests were performed with 1,000 permutations using a fixed random seed unless otherwise stated. For each permutation, we computed the number of mWmC+ cells per cell type, yielding a null distribution of expected counts under the hypothesis that sublaminar position alone explains connectivity. Observed mWmC+ cell counts were then converted into per-animal z-scores relative to this null distribution. Specifically, for each cell type t and mouse q, the z-score was computed as follows,
where \({N}_{t,q}^{\mathrm{obs}}\) denotes the observed number of mWmC+ cells of type t in mouse q, and μt,q and σt,q denote the mean and standard deviation of the permutation-derived null distribution for that cell type and mouse. z-Scores provide a signed, normalized measure of enrichment or depletion relative to sublaminar expectation. z-Scores were then aggregated across mice using Stouffer’s method as below,
where n is the number of mice. To test for bidirectional deviations (enrichment or depletion) of mWmC labelling beyond sublaminar expectation, two-sided P values were computed from the combined z-scores using the standard normal distribution as,
and controlled for multiple comparisons across cell types using the Benjamini–Hochberg false discovery rate procedure. Positive z-scores indicate enrichment beyond sublaminar expectation, whereas negative z-scores indicate depletion, reflecting cases in which sublaminar position alone overestimates the likelihood of receiving retinal input. As statistical inference is performed using normal-theory P values derived from the aggregated z-scores (after estimating null mean and variance from permutations), the minimum attainable P value is not constrained by the number of permutations. Finally, SC neuron types were ranked by their aggregated Stouffer z-scores, which we refer to as the cell-type specificity score, representing the preference of a cell type’s molecular identity for RGC connectivity (Fig. 2e).
RGC axon distribution in SC
RGC axons in the SC from four different genotypes and all RGCs were included. In brief, coronal brain sections were immunostained and imaged using a confocal microscope, as previously described43. Confocal stacks of 20 µm thickness were acquired and processed to generate maximum-intensity projections. Using ImageJ, each right SC hemisphere was divided into five equal sections. The fluorescence profile of axon arbors was measured by taking 200-μm-thick line scans perpendicular to each section’s pial surface, extending to a depth of 500 μm below it. Signal intensity values were normalized to the maximum intensity across images and plotted. The locally weighted scatterplot smoothing function in MATLAB was used to smooth the curve. ImageJ was used to analyse confocal stacks and produce maximum-intensity projections. To quantify axon depth across the SC, the shortest distance from the pial surface to the upper and lower boundaries of the axonal arbors was measured within each section. Five mice of each genotype, including all SC slices, were used for each experimental condition. For experiments in which multiple neurons were recorded from the same mouse, mouse identity was treated as the experimental unit/random effect to account for the hierarchical structure of the data.
Immunohistochemistry for the retina and SC
The retina histology protocol was described as previously described50. Mice were euthanized, and eyes were collected, then fixed in 4% PFA/PBS for 1 h on ice. Retinas were dissected and rinsed with PBS. For the whole-mount retina data in Fig. 3, we adapted previously described protocols37. Whole-mount retina samples were blocked in blocking buffer (5% normal donkey serum, 0.5% Triton X-100 in PBS) at room temperature for 1 h, then incubated with primary antibodies for 2–4 days at 4 °C, followed by secondary antibodies for 2 h at room temperature. For mounting, retinas were placed flat, ganglion cell side up, and sealed with Fluoromount-G (SouthernBiotech, 0100-01). For retinal vertical sections in Extended Data Fig. 6, we adapted protocols previously described37. Fixed mouse retinas were cryoprotected in 30% sucrose in PBS for 1 h before embedding in OCT (Epredia). Vertical retinal cryosections (20 µm) were prepared and mounted on glass slides. Sections were blocked in the same blocking buffer and incubated with primary antibodies overnight at 4 °C, followed by secondary antibodies for 1 h at room temperature. Sections were sealed with Fluoromount-G (SouthernBiotech) containing DAPI.
Brain section histology was described previously68. Mice were deeply anaesthetized and perfused transcardially with ice-cold PBS, followed by 4% PFA. Brains were post-fixed in 4% PFA overnight at 4 °C, then cryoprotected in 30% sucrose in PBS at 4 °C until the tissue blocks sank. Tissue was frozen directly on the stage of a sliding microtome (Leica) cooled with dry ice and sectioned coronally at 40 µm. Free-floating sections were blocked in the blocking buffer described above and incubated overnight at 4 °C with primary antibodies, then for 1 h at room temperature with secondary antibodies. Sections were mounted on slides with Fluoromount-G (SouthernBiotech) containing DAPI.
Antibodies used were as follows: goat and chicken anti-GFP (1:1,000, Rockland; 1:500, Abcam); rabbit anti-RFP (1:1,000, Rockland for immunohistochemistry); mouse anti-SATB1 (marker for ooDSGC in reference69, 1:1,000, Santa Cruz); goat anti-choline acetyltransferase (ChAT, 1:500, Millipore); rabbit anti-CARTPT (1:2,500, Phoenix Pharmaceuticals); rabbit anti-TUSC5 (1:500, Novus); Rabbit anti-RBPMS (1:1,000, Poteintech/Fisher); goat anti-SPP1 (1:500, R&D); sheep anti-FOXP2 (1:500, R&D); rabbit anti-ETV1 (1:1,000, J.A.K.)70. Secondary antibodies were conjugated to Alexa Fluor 488, Alexa Fluor 568, or Alexa Fluor 647 (Jackson ImmunoResearch) and used at 1:1,000.
RNAscope in situ hybridization
In situ hybridization was performed as previously described68 using RNAscope Fluorescent Multiplex Kit (Advanced Cell Diagnostics) according to the manufacturer’s instructions. In brief, sections were fixed in 4% PFA and dehydrated as described in ‘Immunohistochemistry for the retina and SC’, followed by air drying. A hydrophobic barrier was drawn around the sections with an ImmEdge pen (Vector Labs, H-4000). The sections were post-fixed with 4% PFA, quenched with hydrogen peroxide, and subjected to target retrieval followed by dehydration in 100% ethanol. Sections were treated with Protease III, incubated with target probes, treated with a series of amplification reagents, and developed with TSA fluorophores. Slides were mounted using mounting medium (VECTASHIELD, Vector Laboratories). RNAscope probes included the following: Cdh7 (ACD #521331), Cbln4 (ACD #505411), Itga7 (ACD #542911) and Sntb1 (ACD #440541).
Intraocular injection
Intraocular injection of AAVs was performed as previously described37,41. Approximately 0.5 µl of virus was delivered into the left eye using a sharpened glass micropipette. All AAVs (serotype 2 targeting RGCs) were standardized to the same titre of 2 × 10¹³ genome copies. Mice were euthanized, and retinas and brains were collected about 4 weeks post-injection (wpi).
- 1. For mWmC-based anterograde tracing experiments, AAV encoding constitutive mWmC or Cre-dependent mWmC was intravitreally injected into wild-type, Kcng4-cre, Cartpt-cre, Foxp2-cre and Tusc5-cre mice. AAVs were injected into the left eyes using a sharpened glass pipette as previously described19. Mice were processed for analysis at 4 wpi.
For mWmC-based anterograde tracing experiments, AAV encoding constitutive mWmC or Cre-dependent mWmC was intravitreally injected into wild-type, Kcng4-cre, Cartpt-cre, Foxp2-cre and Tusc5-cre mice. AAVs were injected into the left eyes using a sharpened glass pipette as previously described19. Mice were processed for analysis at 4 wpi.
- 2. For optogenetic experiments, AAV2-CAG-ChR2-mCherry-WPRE, AAV2-EF1α-DIO-ChR2(H134R)-EYFP, AAV2-EF1α-DIO-ChR2(H134R)-mCherry were injected into the left eyes of mice to activate all RGCs or ooDSGCs. Mice were allowed to mature for at least 6 wpi, reaching adulthood (6–10 weeks) before analysis.
For optogenetic experiments, AAV2-CAG-ChR2-mCherry-WPRE, AAV2-EF1α-DIO-ChR2(H134R)-EYFP, AAV2-EF1α-DIO-ChR2(H134R)-mCherry were injected into the left eyes of mice to activate all RGCs or ooDSGCs. Mice were allowed to mature for at least 6 wpi, reaching adulthood (6–10 weeks) before analysis.
- 3. For starburst amacrine cell (Chat+) ablation experiments, AAV2-Flex-taCasp3-TEVp was injected into the left eye or both eyes of mice in the ablation groups. 2 sites located at the dorsal and ventral parts of the eyeball were used for injection; 0.75 µl of virus was injected into each site. For the control groups, same volume of saline was injected into the left eye of mice. Two-photon calcium imaging was performed 1 month after injection.
For starburst amacrine cell (Chat+) ablation experiments, AAV2-Flex-taCasp3-TEVp was injected into the left eye or both eyes of mice in the ablation groups. 2 sites located at the dorsal and ventral parts of the eyeball were used for injection; 0.75 µl of virus was injected into each site. For the control groups, same volume of saline was injected into the left eye of mice. Two-photon calcium imaging was performed 1 month after injection.
Stereotaxic injections
For adult SC labelling, mice were anaesthetized with isoflurane during the surgery (3% for induction and 1.5–2% for maintenance) and placed in a stereotaxic apparatus (Model 940, David Kopf Instruments). Meloxicam (5 mg kg−1) was administered intraperitoneally for analgesia before the surgery and 1 day after the surgery. Body temperature was maintained at 37 °C using a homeothermic blanket. Viral solutions were loaded into a pulled glass pipette connected to a syringe (7634-0, Hamilton) via a dual-ferrule adaptor (55750-0, Hamilton). The injection speed and volume were controlled by a Microinjection Syringe Pump (UMP3T-1, WPI). AAV2-EF1a-FDIO-mCherry or AAV2-EF1a-FDIO-EGFP (1 µl) was injected into the right SC of adult mice at a constant speed (60 nl min−1).
Two injection sites were used for the Cdh7-FlpO and Cbln4-FlpO lines: one at 0.35 mm posterior and 0.5 mm lateral to lambda at a depth of 1.3 mm, and the other at 0.1 mm posterior and 0.6 mm lateral to lambda at a depth of 1.2 mm. The mice were transcardially perfused at 4 wpi. The brains were collected for immunohistochemical analysis. In addition, specifically for pseudorabies-mediated retrograde tracing, AAV8-hSyn-FRT-TVA-P2A-EGFP-2A-oG viruses (1 µl) were injected into the right SC of the Cdh7-FlpO or Cbln4-FlpO adult mice by stereotaxic injections as described above. Three weeks later, EnvA G-Deleted Rabies-mCherry (1.2 µl) was injected into the right SC. Six days post-rabies injection, mice were transcardially perfused, and brains and contralateral (left) retinas were collected for immunohistochemical analysis.
CRACM
We used the Cre/FlpO strategy to label SC neurons and manipulate RGCs separately by crossing RGC-specific Cre drivers to SC-specific FlpO mice. After injecting AAV2-EF1α-FDIO-GFP-WPRE into the right SC of Cbln4-FlpO or Cdh7-FlpO mice, we can target recording from GFP-labelled SC neurons. By injecting AAV2-CAG-ChR2-mCherry-WPRE to manipulate all RGCs or AAV2-EF1α-DIO-ChR2(H134R)-mCherry to manipulate specific types of RGCs into the left eye, a blue light (473 nm, 15 mW mm−2) can activate the RGC axon terminals in the SC.
Injected mice were anaesthetized by ketamine and xylazine (100 mg kg−1, 12.5 mg kg−1) and transcardially perfused with ice-cold Cutting solution (78.3 mM NaCl, 2.3 mM KCl, 33.8 mM choline-Cl, 0.45 mM CaCl2, 6.4 mM MgCl2, 1.1 mM NaH2PO4, 23 mM NaHCO3, 20 mM D-glucose, 0.5 mM L-glutamine, pH 7.4). The brains were dissected, and coronal brain sections were prepared using a vibratome (VT1200S, Leica) in ice-cold, carbogenated Cutting solution. Slices (250 μm in thickness) with SC were collected and transferred to a 32.5 °C incubation chamber filled with carbogenated Cutting solution. After 30 min incubation, the slices were transferred to room temperature artificial cerebrospinal fluid (ACSF; 125 mM NaCl, 2.5 mM KCl, 1.25 mM NaH2PO4, 26 mM NaHCO3, 1 mM MgCl2·6H2O, 2 mM CaCl2, 20 mM D-glucose, pH 7.4) before recording. Cutting solutions and ACSF were constantly bubbled with 5% CO2 and 95% O2 (Carbogen, Airgas).
A CCD camera (IR-2000, DAGE-MTI) mounted on a fluorescence microscope (BX51WI, Olympus) was used to detect a green cell surrounded by red axon terminals. Targeted whole-cell recordings were made under IR-DIC visualization. The glass pipettes (BF150-86-10, Sutter Instrument) were pulled by a puller (P1000, Sutter Instrument) into recording electrodes (3–5 MΩ). The recording electrode was filled with potassium-based internal solutions (135 mM potassium gluconate, 8 mM KCl, 10 mM HEPES, 0.25 mM EGTA, 2 mM MgATP, 0.3 mM Na2GTP, 7 mM phosphocreatine, pH 7.3). All data were acquired using a MultiClamp 700B Amplifier and a 1440A DigiData (Molecular Devices). The signals were digitized at 10 kHz and low-pass filtered at 1 kHz. Axon activation was performed using a 473 nm LED (Cool LED, pE300). Five light pulses (2 ms) were delivered per trial. After breaking into the cells, we held them at −65 mV and applied whole-cell compensation. Voltage-clamp mode was used to record evoked EPSCs, and current-clamp mode was used to record action potentials. Tetrodotoxin (TTX, 1 µM) and 4-aminopyridine (4-AP, 100 µM) were added to ACSF perfusions to confirm the monosynaptic connection. CNQX (10 µM) and APV (50 µM) were added to confirm the glutamatergic synapses. For experiments in which multiple neurons were recorded from the same mouse, mouse identity was treated as the experimental unit or random effect to account for the hierarchical structure of the data.
Dye filling after electrophysiology recording
An internal solution containing Biocytin (0.5%, B4261-100mg, Sigma) was used for electrophysiological recording and dye filling, as previously described71. After recording, brain slices were fixed with 4% PFA overnight at 4 °C, then blocked with blocking solution (PBS with 0.3% TritonX-100 and 5% normal donkey serum) for one day at 4 °C. Then the slices were incubated with Streptavidin-488 or 555 (1:1,000, Invitrogen) for 2 h at room temperature. After mounting the slices, the images were acquired by a Zeiss confocal microscope (LSM900).
In vivo two-photon calcium imaging
In vivo calcium imaging of mouse SC was performed using a two-photon microscope as previously described72.
Surgeries were performed on eight-week-old transgenic mice. The craniotomy, virus injection, and transparent silicone plug insertion were done over the right SC. Mice were anaesthetized with ketamine and xylazine and placed in a stereotaxic device with their eyes covered with ophthalmic ointment. Mice were anaesthetized with 2% isoflurane for maintenance and injected with meloxicam (5 mg kg−1). Craniotomy was performed over the lambda of the skull, and a large flap was opened in the dura with a forceps (Dumoxel-Biology 11252-30, FST). We injected the right SC with 400 nl of AAV8-EF1α-FDIO-GCaMP6s. A silicone plug bonded to a 5 mm circular coverslip was mounted on a suction cup and positioned over the craniotomy. The plug advanced downward to press the brain and then anteriorly to displace the dura and transverse sinuses. A drop of cyanoacrylate (Vetbond, 3 M) was used to fix the silicon plug to the skull, then the suction was released, and the suction cup was withdrawn. A custom head plate (titanium, 1 mm thick, eMachineShop) was bonded to the skull by cyanoacrylate (Vetbond, 3 M) and dental cement (Ortho-Jet, LangDental). At least 2 weeks after implanting cranial windows, mice were habituated to handling and head-fixing at least 4 times under a two-photon microscope.
We imaged calcium responses in mice using a two-photon microscope (Neurolabware) with a Spectra-Physics MaiTai laser at 920 nm (15–50 mW) to excite GCaMP6s. Imaging in the SC was performed at depths of 50–200 µm below the pia surface. A 575 × 370 µm field of view was scanned at 15.5 Hz, producing a series of 416 × 268-pixel images. A tangent LCD screen (Dell, U2312HM) placed in front of the left eye of head-fixed mice will present a visual stimulus generated with Psychtoolbox3 (MATLAB) and synchronized with image acquisition via TTL signals from the stimulus screen. The screen is centred 14 cm away from the mouse, angled at 20 degrees in pitch and yaw to minimize fisheye distortion. We imaged each mouse for about 1 h, with multiple sessions on successive days if needed to present a battery of visual stimuli and acquire stable imaging.
Visual stimuli were presented on a tangent (1,920 × 1,080 pixels) region of the screen. The screen was strobed for 2 µs at the end of each scan line (1,200 Hz; luminance of the grey screen, 1.25 cd m−2; maximum brightness, 1/80 of the unmodified monitor) to minimize interference between the visual stimulus and two-photon fluorescence detection. All stimuli presented used only the green and blue channels of the screen. Red bars flickered periodically at the bottom of the screen, which was covered with black tape, to convey the timing of the visual stimulus to synchronize with fluorescence acquisition. All visual stimuli in two-photon experiments were presented in a pseudorandom sequence, interspersed with blank periods within each stimulus block, using a different random seed for each block. Moving gratings were used to test the direction selectivity of SC neurons. The drifting grating was 100 pixels wide (6.4°), with black or white bars, and drifted in 8 directions (45° intervals) at a speed of 356 pixels per second (22.7° per second). To map receptive fields, flashing spots were presented in a 9 × 5 position arrayed across the stimulus monitor. Each spot was a 216 × 216 pixel (13.8° × 13.8°) square that appeared for 1 second. All visual stimuli were repeated six times per trial.
To test the contribution of the ipsilateral eye to the direction selectivity of Cbln4+ SC neurons, we covered the ipsilateral eye with a black box during calcium imaging. The box was removed after the experiments.
Calcium signal data processing
We performed offline motion correction of calcium imaging data by NoRMCorre73, identified GCaMP6s+ cells, extracted calcium traces for each cell, and subtracted neuropil signals. Next, we aligned traces to visual stimuli using synchronization pulses relayed from stimulus monitors to the microscope via a TTL signal, which were time-stamped in the imaging data. For traces with high-peak noisy spikes (large mouse motion that cannot be corrected), we used a denoising algorithm to replace noisy dots with smooth traces. The noisy spike traces were determined by whether any points were bigger than the mean ± 4 s.d. traces. Then, calcium traces were aligned to the onset of each visual stimulus, averaged across trials, and the peak and valley of each mean trace were identified.
Direction-selectivity index calculation
DSI calculation followed a previously published protocol74. ΔF/F values for each presentation of a stimulus were averaged from six repeats, and the peak ΔF/F for each direction was used to compute direction preference. The direction selectivity index (DSI) was calculated as the normalized amplitude of the vector sum of all directions by their scalar sum. Cells with DSI > 0.2 were classified as direction selective. The preferred direction was defined as the weighted vector sum over eight stimulus angles.
Data quantification and analysis
For confocal image acquisition, all procedures were conducted in a double-blind manner. One researcher collected images without knowledge of genotype, while a second researcher, who performed the analysis, was also blinded. Littermates were used as controls in all experiments unless otherwise indicated. Both male and female mice were included. Images were acquired on a Zeiss LSM900 confocal microscope (Carl Zeiss Microscopy) equipped with 10× air, 20× air and 40× oil immersion objectives.
To quantify immunostained cells in the SC and retina, confocal images of vertical retinal sections, coronal SC sections, and whole-mount retina were collected under identical imaging conditions across all samples. Confocal stacks of 20 µm (retina and SC sections) or 60 µm (whole-mount retina) were acquired and processed to generate maximum-intensity projections. Cells positive for each marker was identified using thresholded fluorescence intensity criteria. Single-positive and double-positive cells were manually counted with the Cell Counter plugin in ImageJ (NIH). For RNAscope in situ hybridization, SC sections processed with RNAscope and immunostaining were imaged on a Zeiss LSM900 with a 20× objective. The number of GFP-positive neurons or marker-positive cells was counted across all stained samples as mentioned above. Data were pooled across animals, and results are presented as percentages (mean ± s.e.m.). Confocal image files for histology were analysed using Fiji Image J (v1.53c), Microsoft Excel 365, Graph Pad Prism9, Adobe Illustrator 2020. Electrophysiological data collection and analysis were not performed blindly with respect to the experimental conditions. All whole-cell recording data were acquired by Camplex 10.7 (Molecular Devices) and analysed in MATLAB (MathWorks) or Clampfit 10.7 (Molecular Devices). Optogenetically evoked currents were averaged across 5 trials. Clampfit 10.7 measured the peak amplitudes of evoked currents. MATLAB analysed the intrinsic properties of recorded neurons. All statistics were calculated by GraphPad Prism 9. Peak currents between the two groups were compared using a two-tailed Student’s t-test.
Optomotor response tests
Optomotor response was described previously75. The OptoDrum (Striatech) comprises a box with four screens to simulate drifting gratings. An IR camera mounted on the top of the box was used to record mouse movements. Mice were first acclimated to the room in their cages for 30 min. Then, freely moving mice were placed on a platform and allowed to acclimate to the box for at least 5 min. Drifting gratings (12° s−1) in the clockwise direction can trigger left-eye-mediated body and head movements, while drifting gratings in the counterclockwise direction were used to test right-eye-mediated movements. Drifting gratings were presented from low spatial frequencies (0.056 cycles per degree) to high frequencies (0.3–0.5 cycles per degree) to determine the threshold at which a mouse could track. OptoDrum’s software can detect the body shape of mice and label the positions of head, body, and tail of mice. The stimulus and video tracking were paused if a mouse engaged in grooming behaviour or dropped off the platform and resumed later. The software can score the optomotor response and determine the spatial-frequency threshold. False positives were manually identified as invalid, and the same frequency of drifting gratings was repeated. We compared the spatial-frequency threshold of drifting gratings to trigger optomotor responses in the left eye (ablation) with the right eye (control) to assess visual acuity differences.
Statistical methods
We obtained measurements from distinct biological samples. No covariates were tested. No formal test of normality was performed; statistical tests were selected based on the distributional assumptions of the data. Statistical methods and the number of animals tested for each configuration are documented in the figure legends for each experiment. When comparing two groups, statistics were derived using an unpaired two-sided Student’s t-test, Kolmogorov–Smirnov test or Fisher’s exact test, as indicated in the figure legends. For comparing cell-type proportions across multiple reactions, we used the Kruskal–Wallis H test (scipy.stats.kruskal, Python). One-way analysis of variance (ANOVA) was performed in GraphPad Prism 9 to assess the statistical significance of differences among multiple measurements.
Fisher’s exact test was performed using the Easy Fisher Exact Test Calculator (https://www.socscistatistics.com/tests/fisher/default2.aspx).
Statistical significance was defined as P < 0.05, P < 0.01, P < 0.001 and ****P < 0.0001. All values indicate mean ± s.e.m., unless otherwise noted.
Reporting summary
Further information on research design is available in the Nature Portfolio Reporting Summary linked to this article.