 Newshot
Main
The human intestine coordinates nutrient absorption with immune surveillance of luminal commensal and pathogenic microorganisms2. Controlled host–microbe interactions shape diverse aspects of human biology, including epithelial maturation and systemic immunity while maintaining a protective barrier against infection3. Conversely, dysregulated interactions contribute to pathologies such as inflammatory bowel disease and colorectal cancer4.
This context-dependent crosstalk is executed through a multi-barrier system comprising a patterned epithelium, a protective mucus layer and specialized tissue-resident immune cells5. Integration of these three components is required to meaningfully capture intestine–microbe interactions in a human-relevant setting1.
Intestinal stem cell (ISC)-derived organoids provide key inroads into human epithelial biology6. However, intestinal organoids face limitations recapitulating intestinal physiology, owing to an inaccessible lumen, culture heterogeneity, lack of biomimetic morphology and absence of non-epithelial lineages7,8. Although bioengineered 3D extracellular matrix (ECM) scaffolds have helped to overcome some of these challenges by establishing crypt–villus architecture and apical–basal access9, physiological integration of epithelial, tissue-resident immune and microbial compartments remains a major challenge1,10.
Here we established engineered immunocompetent human intestinal models composed of autologous tissue-resident memory T (TRM) cells and small intestinal or colonic ISC-derived epithelia amenable to luminal manipulation. Multiplex immunofluorescence (mIF) and single-cell RNA sequencing (scRNA-seq) characterization of these barriers reveal region-specific spatial niches, mucus layer formation and immune–epithelium interactions. Applying this system to Salmonella Typhimurium (S.Tm), we provide a single-cell multiomic view of the epithelial responses to luminal and intracellular infection. Finally, we modelled the pathogen–epithelial–immune axis, demonstrating that TRM cells respond to S.Tm invasion by cytokine release and concomitant epithelial damage, which may facilitate pathogen clearance and infection resolution.
Biomimetic human intestinal epithelium
To model the human intestinal epithelium, we developed a fluidic device and microstamping technology to impart crypt-mimicking topography on an embedded ECM-like hydrogel (Extended Data Fig. 1a). Human intestinal organoids were seeded into the top reservoir of the device, where they formed a tight, polarized barrier comprising crypt units sustained by basal nutrition (Fig. 1a–d and Extended Data Fig. 1b–e).
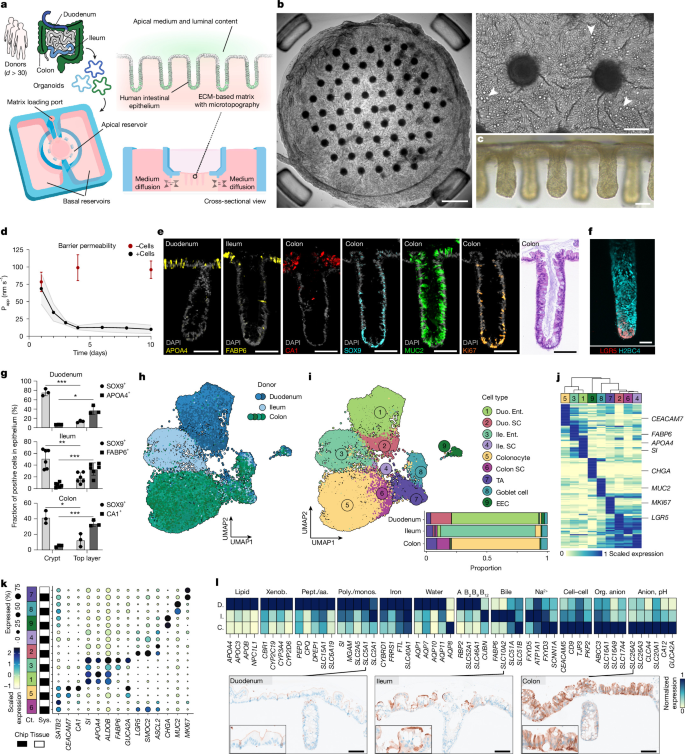
a, Overview of the engineered intestine generation from human intestinal organoids isolated from multiple donors (d) used in this study, showing fluidic device layout and resulting intestinal barrier. Schematic of the human male outline adapted from NIAID Visual & Medical Arts. NIAID NIH BIOART Source (https://bioart.niaid.nih.gov/bioart/232). b, Extended depth-of-focus brightfield image of day 9 epithelium (scale bar, 500 µm; e > 15). The magnified inset highlights crypts and goblet cells (arrowheads; scale bar, 100 µm). c, Brightfield image biomimetic crypt rows; e = 6. Scale bar, 100 µm. d, Apparent permeability (Papp) of regional epithelia over 10 days (black) compared with empty controls (red). d = 1 per region, n = 3–5 per condition. The line indicates d mean Papp ± s.d. (shaded area). e, H&E (colon) and mIF stainings of crypt cross-sections showing crypt-associated (SOX9+ and Ki67+), secretory (MUC2+) and absorptive (APOA4+ and FABP6+ for enterocytes and CA1+ for colonocytes) epithelial cells; e = 4. Scale bars, 100 µm. f, Whole-mount fluorescence image of iCas9 H2B4C–mTurquoise2 (cyan, nuclei) and LGR5–IRES-NLS-mScarlet3 (red) duodenal reporter-line, visualizing LGR5+ stem cells (red) and nuclei (cyan); e = 1. Scale bar, 50 µm. g, Quantification of SOX9+ and regional absorptive marker expression in crypts and top layer at day 10, normalized to total 4′,6-diamidino-2-phenylindol (DAPI)+ cells. The bars show mean ± s.d. (d = 1 per region; nDuodenum = 3, nIleum = 6 and nColon = 3; n denotes number of dots), unpaired two-tailed t-test, with Welch’s correction where indicated (***PDuodenum, SOX9 = 0.0002, PDuodenum, APOA4, Welch = 0.0279; PIleum, SOX9 = 0.0013, PIleum, FABP6, Welch = 0.0009; PColon, SOX9 = 0.0126, **PColon, CA1 = 0.0003). h,i, Uniform manifold approximation and projection (UMAP) embeddings of day 10 multiplexed scRNA-seq epithelium data coloured by intestinal region (h) and cell type (i, top), with average cell-type proportions (i, bottom; stacked barplot; dDuoneum = 2, dIleum = 1 and dColon = 4; n = 3 pooled per donor). Duo., duodenum; EEC, enteroendocrine cell; Ent., enterocyte; Ile., ileum; SC, stem cell; TA, transit-amplifying cell. j, Scaled average expression of the top 20 cell-type-enriched marker genes across regions (day 10). k, Comparison of regional marker gene expression between day 10 engineered and primary reference epithelia. Ct., cell type; Sys., system. l, Normalized expression of metabolism and transporter genes in the absorptive lineage (duodenal (D), ileal (I) and colonic (C)). Immunohistochemistry staining of solute transporters in regional epithelia (day 9, combined with Extended Data Fig. 4f), e = 1. Scale bars, 100 µm. aa., amino acid; monos., monosaccharide; org., organic; pept., peptide; poly., polysaccharide; xenob., xenobiotic. Regions shown: the duodenum, ileum and colon (a,d,e,g–l), ileum (b) and duodenum (c,f).
To characterize the morphology, cellular composition and patterning of the epithelium, we developed a 3D-printed ‘histomold’ for simultaneous embedding and perpendicular sectioning of up to 50 engineered epithelia (Extended Data Fig. 1f). Haematoxylin and eosin (H&E) and mIF staining showed histological and cell-type patterning similarity to donor-matched primary tissue (Fig. 1e and Extended Data Figs. 1g and 2a–c). In addition, a duodenal dual reporter line stably labelling chromatin (H2BC4–mTurquoise2) and LGR5+ stem cells (LGR5–IRES-NLS-mScarlet3) confirmed LGR5 ISC localization to the crypt bottom (Fig. 1f). By day 10, the thick epithelium contained proliferative SOX9+ and Ki67+ cells primarily confined to the crypt, whereas mature enterocytes (APOA4+ in the duodenum, and FABP6+ in the ileum) and colonocytes (CA1+) were enriched within inter-crypt regions (Fig. 1g and Extended Data Fig. 3a–f), with αDEF5+ Paneth cells detected in some small intestinal crypts (Extended Data Fig. 3g). EdU pulse-chase labelling revealed that cycling cells, initially localized in the crypt base, progressively migrated towards the apical surface over 4 days, similar to homeostatic turnover in vivo11 (Extended Data Fig. 3h and Supplementary Video 1). These data confirm that imposing in vivo-inspired geometries on human intestinal organoids drives reproducible cell-type regionalization and migration akin to the intestinal crypt–villus axis9.
Multiplexed scRNA-seq demonstrated region-specific stem, absorptive and secretory lineages across seven donors at day 10 (Fig. 1h–j, Extended Data Fig. 4a,b and Supplementary Tables 1 and 2). Cell-type composition was similar to primary tissue counterparts and proportions were consistent across donors, highlighting the fidelity and robustness of the system (Fig. 1k and Extended Data Fig. 4c). Gene Ontology analysis of enterocyte and colonocyte marker genes revealed enrichment of distinct physiological programs concordant with the primary intestinal regions12,13 (Extended Data Fig. 4d and Supplementary Tables 3 and 4). Proximal small intestinal enterocytes showed higher expression of genes involving lipid, xenobiotic and iron metabolism (Fig. 1l and Extended Data Fig. 4d). Pseudotemporal ordering of the duodenal stem-to-enterocyte trajectory confirmed enterocyte maturation levels, approaching the AQP10+ expression observed at the villus tip in vivo14 (Extended Data Fig. 4e). Distal small intestinal enterocytes expressed bile acid and vitamin B12 transport genes, whereas colonocytes were enriched in cell–cell interactions and ion transport13,15 (Fig. 1l and Extended Data Fig. 4d). We confirmed differential protein expression of the transporters SLC5A1, SLC10A2 and SLC26A2 between the regions (Fig. 1l and Extended Data Fig. 4f). Among secretory lineages, enteroendocrine cells and goblet cells were differentially abundant, with substantial heterogeneity in enteroendocrine cells (CHGA+) including EC (TPH1+), MX (GHRL+ and MLN+), D (SST+), K (GIP+), I (CCK+) and L (GCG+ and PYY+) subpopulations that match tissue distribution16 (Extended Data Figs. 2 and 4g–j).
Collectively, these data show that the engineered epithelium retains region-specific cell composition, spatial organization and gene expression, providing inroads to explore nutrient, xenobiotic and host–microbe processes in a human context.
In vivo-like region-specific mucus
The mucus, a layered network of mucins, cellular material, antimicrobials and structural factors, provides an interactive barrier between the microbiome and intestinal epithelium. Characterizing the properties and functional role of the mucus at the host–microbe interface remains largely under-explored in vitro. To facilitate rapid accumulation of mucus, we reduced the apical volume over the course of approximately 4 days, which resulted in a fibrous mucus network covering the epithelium (Fig. 2a,b and Extended Data Fig. 5a,b). Shed cells were present throughout the mucus layer, where they contribute to viscosity17 and can exert an antimicrobial role18 (Extended Data Fig. 5b,c). Longitudinal sections revealed an irregular mucus profile, with higher colonic thickness and crypt plumes similar to observations in primary tissue19 (Fig. 2c–e and Extended Data Fig. 5d–g). AlcianBlue–Periodic Acid–Schiff (PAS) co-staining showed regional differences in secretion and glycosylation, with higher ratios of acidic, negatively charged groups towards colon (Fig. 2f and Extended Data Fig. 5h,i). These patterns were comparable with the primary tissue and may be influenced by relative levels of fucose, sialic acid and sulfate groups20. Proteomic analysis of the colonic luminal content identified the core mucus layer proteins21 (MUC2, FCGBP, TFF3, AGR2, CLCA1, ZG16 and MUC5B) as major constituents, alongside additional mucins, antimicrobials and lectin-binding proteins (Fig. 2g, Extended Data Fig. 5j and Supplementary Table 5). Using the scRNA-seq data, we identified seven non-proliferative (MKI67−) goblet cell clusters (C0–C6) representing regional diversity and differentiation state (Fig. 2h, Extended Data Fig. 5k and Supplementary Table 3). Colonic goblet cells (C1) were enriched in intracellular vesicle transport, protein glycosylation and aerobic respiration, suggesting a higher secretion machinery consistent with thickness measurements (Extended Data Fig. 5l and Supplementary Table 4).
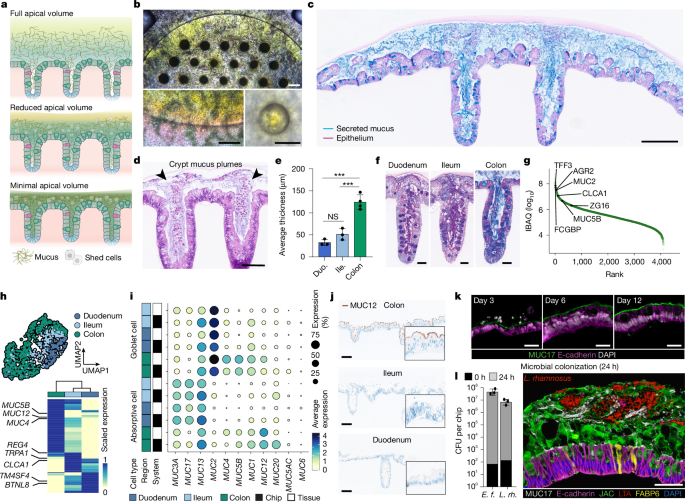
a, Schematic of the mucus accumulation strategy. b, Brightfield images of epithelium with accumulated mucus (4 days, 5 μl; yellow; top), e = 6. Scale bars, 200 μm (top and bottom left) and 100 μm (bottom right). c,d, AlcianBlue–PAS and H&E of epithelium with mucus plumes (c: 5 days, 30 μl; d: 4 days, 5 μl); e = 3. Scale bars, 200 μm (c) and 100 μm (d). e, Average thickness of mucus (5 days, 30 μl) per region. The bars represent mean ± s.d. of d = 3–4 per region (dots) with n = 3–5 averaged per donor. One-way ANOVA with Tukey’s multiple comparison test was used (PColon–ileum = 0.0005, PColon–duodenum = 0.0001, not significant (NS) = P > 0.05). f, AlcianBlue–PAS and glycosylation of multi-region crypt; e = 3. Scale bars, 50 μm. g, IBAQ values of apical content proteins (dots) with highlighted core components of mucus (5 days, 5 μl). IBAQs averaged from d = 3 and n = 3 per donor. h, UMAP of day 10 non-proliferative goblet cells (MKI67−) from different regions (top). Scaled average expression of DEGs between regional goblet cells (bottom). i, Average expression of gastrointestinal mucins in enterocytes and goblet cells of epithelium and primary tissue, across regions. Panels h,i derived from scRNA-seq (Fig. 1). j, Immunohistochemistry staining of regional MUC12; e = 3. Scale bars, 100 μm. k, Glycocalyx maturation (MUC17, green) on duodenal epithelium (E-cadherin, purple); e = 2. Scale bars, 25 μm. l, Independent CFU of E. faecium (E. f.) and L. rhamnosus (L. rh.) in epithelium with accumulated mucus (4 days, 30 μl) at 24 h. The bars represent mean ± s.d. of d = 1; n = 3 (dots; left). mIF staining of an epithelium with accumulated mucus (4 days, 30 μl) after 24 h of co-culture with L. rhamnosus (LTA) is also shown (right). Scale bar, 50 μm. Regions shown: colon (b–d,g), duodenum, ileum and colon (e,f,h–j), duodenum (k) and ileum (l).
Next, we benchmarked the expression of membrane-bound mucins, key glycocalyx components that fortify the epithelium but remain difficult to recapitulate in vitro22. We observed a strong cell-type and region-specific gene expression comparable with the reference tissue (Fig. 2i). MUC6 and MUC5AC, which encode stomach mucins that are often expressed under pathological and metaplastic conditions23,24, were nearly absent. MUC12 and MUC17 staining in the engineered epithelium and tissue counterparts confirmed the specificity and maturation of the glycocalyx, revealing in vivo-like levels by day 12 of culture (Fig. 2j,k and Extended Data Fig. 5m). Finally, we functionally assessed the mucus upon colonization with the commensals Enterococcus faecium or Lacticaseibacillus rhamnosus, which proliferated without compromising epithelial integrity (Fig. 2l and Extended Data Fig. 5n). Together, these results indicate that the platform can accumulate a complex mucus layer with in vivo-like and region-specific properties, opening new avenues for the study of human mucus and host–microbe interactions.
Gene regulatory impact of S.Tm infection
Unlike commensal microbiota, the foodborne pathogen S.Tm exploits motility and adhesion mechanisms to penetrate the mucus25, triggering an invasion-dependent inflammatory response that facilitates pathogen colonization26. Although extensive research has characterized the fundamental mechanisms underlying S.Tm infection, the exact epithelial responses and the resulting epithelial–immune signalling remain unresolved at the human level and at single-cell resolution.
Motivated by the higher mucus level and its potential role against pathogenic bacteria, we infected colonic epithelium with S.Tm 14028 in conditions with varying densities of mucus. At 18 h post-start of the infection (hpi), S.Tm triggered strong damage in conditions with less mucus (Mucuslo), whereas the epithelium remained largely unaffected in the presence of dense mucus (Mucushi; Fig. 3a–d and Extended Data Fig. 6a–d). Furthermore, the denser mucus led to a decrease in microbial burden, cell invasion and cytokine release, while preserving barrier integrity (Extended Data Fig. 6e–g). These protective effects were coupled with cell shedding, which predominantly localized at crypt openings, presumably impeding bacterial colonization (Extended Data Fig. 6h).
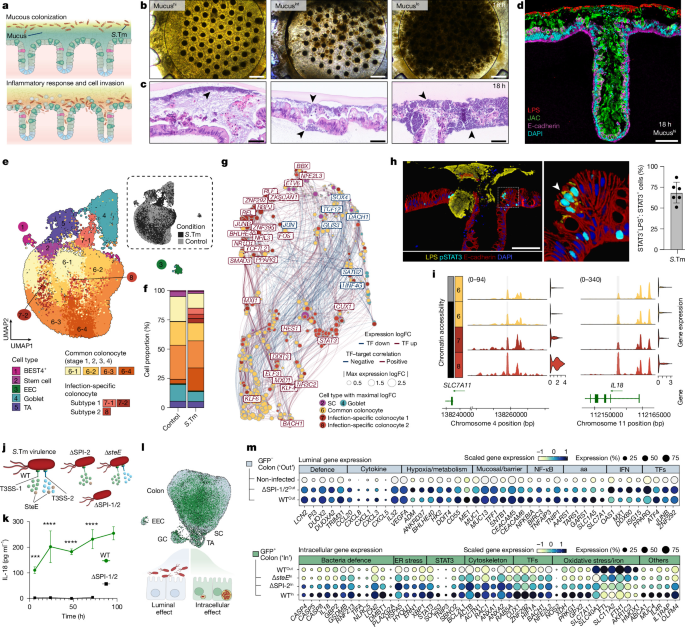
a, S.Tm infection and epithelial invasion. b,c, Brightfield and H&E of day 10 epithelia with differential mucus levels (Mucushi: 4 days, 5 μl; Mucusint: 2 days, 5 μl; Mucuslo: 4 days, 120 μl, +wash) at 18 hpi (black arrowheads); e = 3. Scale bars, 500 μm (b) and 50 μm (c). d, mIF of Mucushi epithelium (purple and cyan) with mucus (green) protecting against S.Tm attachment (red) at 18 hpi; e = 2. Scale bar, 100 μm. e, UMAP RNA embedding of day 10 Mucushi epithelium (d = 1, n = 5 pooled) ± S.Tm at 24 hpi. Cells are coloured by cell type (left) or condition (top right). f, Cell-type composition in ±S.Tm conditions. g, Co-expression network of the top 500 DEGs and their top correlated Pando-inferred transcription factors (TFs) across cell types. Edges indicate Pando-predicted TF–target pairs, and the colour of edges represent expression correlation. h, mIF of epithelium (red and blue) at 24 hpi, showing pSTAT3 (cyan) in cells containing S.Tm (yellow); e = 5. Scale bar, 100 μm (left). Fraction of STAT3+LPS+ cells among total STAT3+ cells (right). The bar represents the mean ± s.d. of n = 6 (dots). i, Normalized chromatin accessibility levels at a potential distal regulatory region of SLC7A11 and an intronic regulatory region of IL18, with matched expression in adjacent violin plots. j, Schematic of S.Tm WT and mutant strains indicating defects in T3SS-1/2 or the specific virulence factor SteE. k, IL-18 secretion levels over 96 hpi. The lines connect mean ± s.d. of d = 1, n = 3–4 per timepoint. Ordinary two-way ANOVA with Sidak’s multiple comparison test was used (****P < 0.0001). l, UMAP of day 10 sorted cells from non-infected and WTGFP, ΔSPI-2GFP, ΔSPI-1/2GFP and ΔsteEGFP-infected cells at 24 hpi and coloured by status in green (invaded, GFP+, ‘In’) or light blue (non-invaded, GFP−, ‘Out’); d = 1, n = 8–12 per strain. GC, goblet cell. m, Z-scored scaled gene expression of selected genes in colonocytes. Luminal infection effects (non-invaded, GFP−, ‘Out’) are compared with non-infected cells and intracellular effects (invaded, GFP+, ‘In’) to non-invaded cells infected with S.Tm WT. ER, endoplasmic reticulum. Intestinal region shown: colon (a–m).
Next, we used single-cell transcriptome and accessible chromatin sequencing (scMultiome) to characterize the Mucushi colonic epithelium response at 24 hpi and epithelial breach (Extended Data Fig. 6i). We detected canonical cell types in control and S.Tm conditions with increased proportion of mature colonocytes upon infection, a shift reported in mouse tissue27 (Fig. 3e,f and Extended Data Fig. 6j–l). Of note, ‘colonocyte subtype 1’ (RNA clusters C7-1 and C7-2) and ‘subtype 2’ (RNA cluster C8) were nearly exclusive to the infection condition (Fig. 3f and Extended Data Fig. 6k). Overall, all cell types exhibited a pronounced response to infection with 3,056 differentially expressed genes (DEGs) and 34,337 differentially accessible open chromatin regions (DARs) between conditions (Extended Data Fig. 6m–p and Supplementary Table 3). Pathway enrichment analysis highlighted hypoxia, NF-κB and barrier or cytoskeletal signatures, including upregulation of antimicrobials (LCN2 and PIGR), reactive oxygen species (DUOX2 and DUOXA2) and inflammatory cytokines (CCL20, IL18 and IL32; Extended Data Fig. 6q–s). Stem cells strongly upregulated LCN2, chemokines (CXCL1–3) and immunomodulators (TNF and LTB). Together, these results identify a complex innate epithelium response involving sensing, barrier maintenance and mucosal signalling.
We used the chromatin accessibility data to infer a gene regulatory network underlying the epithelial response (Fig. 3g). This network revealed transcription factor nodes and target genes that orchestrate a broad-spectrum response, along with clusters that specifically coordinate infection-specific states. We identified BHLHE40, ZNF292 and RBPJ as the top differentially expressed transcription factors in the colonocyte subtype 1, which exhibited a hypoxic signature that appears conserved under infections and inflammatory-related diseases28. STAT3 emerged as a central node of the colonocyte subtype 2. Phosphorylation of STAT3 (pSTAT3) has been linked to intracellular S.Tm infection29 via the virulence factor SteE30,31, leading to an anti-inflammatory transcriptional program that supports the bacterial niche. Co-staining of pSTAT3 and lipopolysaccharide (LPS) revealed a strong colocalization both in colonic and small intestinal samples, with no pSTAT3 detection in non-infected conditions (Fig. 3h and Extended Data Fig. 7a–c). These results, in addition to the expression of the STAT3 negative-feedback regulator SOCS3, suggest that this population is S.Tm specific and contains cells with intracellular bacteria.
Finally, we classified DEGs into co-expression gene modules based on expression differences across cell types between conditions (Supplementary Table 3). We found that the colonocyte subtype 2-specific gene module exhibited increased reactive oxygen species, endoplasmic reticulum stress, unfolded protein response and ferroptosis (Extended Data Fig. 7d and Supplementary Table 4). Furthermore, we observed a possible antagonistic interaction between host cell and pathogen, with non-cannonical inflammasome signalling (CASP4, CASP5 and IL18)32 and genes with anti-inflammatory roles (SBNO2 and TNIP3; Extended Data Fig. 7e,f). BACH1, a key oxidative stress and ferroptosis regulator competing with NRF2 (NFE2L2)33,34, was also among the top upregulated transcription factors (Extended Data Fig. 7g). Binding motifs of STAT3 and BACH1 were over-represented in S.Tm DARs, indicating that both might be regulators of this population (Supplementary Table 6). Finally, we identified putative gene regulatory regions with increased accessibility upon infection, including intronic and distal regions of IL18 and SLC7A11 in the presumably invaded cells (Fig. 3i and Extended Data Fig. 7h). Collectively, these findings identify a complex multipartite human epithelial gene regulatory response to S.Tm infection, confirm STAT3 activation in S.Tm-invaded cells, and demonstrate how engineered intestines can be used to illuminate human infection responses.
Virulence and burden shape host response
Central to S.Tm pathogenesis resides a specialized virulence machinery including two needle-like type III secretion systems (T3SS-1/2) that mediate invasion and intracellular survival26,35 (Fig. 3j). To study how virulence factors influence the host response to luminal and intracellular S.Tm, we performed short, high-load infections (approximately 3 h, multiplicity of infection of approximately 1:60, −mucus) using wild-type (WT) and mutant strains. Subsequent gentamicin treatment removed the luminal stimulus while maintaining intracellular S.Tm populations for several days (Extended Data Fig. 8a).
We observed that flagellum-driven motility (ΔfliC–ΔfljB (ΔFg)) contributed more to invasion than SiiE-dependent adhesion (ΔsiiF; Extended Data Fig. 8b). Consistent with our previous results (Extended Data Fig. 7a–c), internalized S.Tm predominantly localized basolaterally beneath the nucleus, presumably within Salmonella-containing vacuoles (SCV)35 (Extended Data Fig. 8c). Intracellular replication led to either cell extrusion events with luminal release or rupture of SCV-like structures that released S.Tm basally (Extended Data Fig. 8d and Supplementary Videos 2 and 3). The levels of IL-18 increased over 96 hpi and was a hallmark with WT but not avirulent ΔinvG–ΔssaV (ΔSPI-1/2) S.Tm, distinguishing this invasion signature from the broader luminal cytokine response (Fig. 3k and Extended Data Fig. 8e,f). In addition, the system demonstrated virulence sensitivity, as S.Tm SL1344 (ref. 36) elicited an exacerbated invasion-driven response marked by increased internalization, cell shedding and IL-18 secretion compared with S.Tm 14028 (Extended Data Fig. 8g).
To resolve host transcriptional responses induced by luminal or intracellular S.Tm, we performed scRNA-seq on GFP+ (invaded (In)) and GFP− (non-invaded (Out)) cells infected with WTGFP, ΔSPI-1/2GFP, ΔssaVGFP (ΔSPI-2) or ΔsteEGFP strains at 24 hpi (Fig. 3j,l and Extended Data Fig. 8h,i). Invasion occurred across all cell types but was lowest in stem cells, probably given their crypt-base localization (Extended Data Fig. 8j). The luminal response of non-invaded (GFP−) colonocytes was comparable between WT and ΔSPI-1/2, involving hypoxia, barrier and cytokine genes (Fig. 3m). A low-abundant colonocyte state appeared independent of invasion and was marked by IFN signalling (MX1 and ISG15), probably reflecting extracellular bacterial recognition37 (Fig. 3m, ‘depleted non-infected’, Extended Data Fig. 8i and Supplementary Table 4). The intracellular response of invaded (GFP+) colonocytes, which matched the colonocyte subtype 2 state from the multiomic analysis, triggered a profound shift (approximately 4,000 DEGs) characterized by pro-inflammatory and anti-inflammatory, bacterial recognition, cytoskeleton and oxidative stress genes with variable patterns along differentiation (Fig. 3m, Extended Data Fig. 8k,l and Supplementary Table 2). Although effector contributions may differ functionally, the attenuated gene signature observed in ΔSPI-2, and especially in ΔsteE-invaded cells, positions SteE as a key driver of the intracellular transcriptional landscape (‘enriched in GFP+’; Fig. 3m and Extended Data Fig. 8i,l,m).
Among transcription factors, STAT3 (STAT3, SOCS3 and pSTAT3) was attenuated in ΔSPI-2 and absent in ΔsteE-invaded cells, confirming its SteE-mediated activation31 (Fig. 3m and Extended Data Fig. 8l,n). Invasion by WT and mutants elicited coordinated upregulation of the antagonistic BACH1–NRF2 transcription factor pair33 that coincided with reduced expression of iron homeostasis regulators (GPX4, FTH1, HMOX1 and FTL), suggesting predominant BACH1 activity34 (Fig. 3m and Extended Data Fig. 8l,o). SLC7A11 was a notable exception to this repression, possibly through non-canonical BACH1 activation34, STAT3 regulation38 or an alternative mechanism. Although the exact BACH1–NRF2 interplay and roles remain to be fully elucidated, these transcription factors appeared functionally coupled to intracellular S.Tm, as observed upon small-molecule inhibitor treatments (Extended Data Fig. 8p).
Finally, we classified S.TmWT-invaded cells by bacterial burden using imaging flow cytometry, identifying single-colony to high-load groups at 24 hpi (Extended Data Fig. 8q). To link intracellular replication levels to host response, we performed single-cell total RNA sequencing (VASA-seq) on index-sorted cells from GFPlo, GFPint and GFPhi levels (Extended Data Fig. 8r). GFPhi cells, with up to 35 colony-forming units (CFU) per cell, most strongly correlated with our previously defined intracellular gene module, linking the host response to S.Tm activity and replication rather than invasion alone (Extended Data Fig. 8s,t). Uniquely, VASA-seq recovered not only non-protein coding host transcripts but also bacterial genes involved in metabolism (mgtB, gltA and feoB) and SPI-2 machinery, highlighting the intracellular adaptation of the pathogen (Extended Data Fig. 8u,v and Supplementary Table 3). Collectively, these data provide a high-resolution, multi-modal atlas that uncovers how virulence factors and intracellular burden shape the invaded epithelial response.
TRM cells confer epithelial immunity
Our transcriptomic analysis identified epithelial signals triggered by S.Tm infection and confirmed the epithelium as a sensor of pathogen presence. Elucidating the functional impact of these signals requires the presence of their target populations. Given that S.Tm infection was associated with induction of lymphocyte-targeting cytokines (IL-18 and TNF) and chemokines (CXCL10 and CCL20), we focused on T cells as putative responders and introduced them into the intestinal engineered tissues. In the human intestine, TRM cells reside within the mucosa to safeguard barrier integrity39. We have previously showed that TRM cells integrate into ISC-derived organoids and respond to synthetic T cell receptor (TCR) engagement40. Building on this approach, we established immunosurveilled barriers by incorporating autologous tissue-resident immune cells into the ECM scaffold of our engineered tissues (Fig. 4a–c and Extended Data Fig. 9a–c). These cells were isolated primarily from the small intestine due to higher proximal mucosal immune cell density5. We first assessed immune cell interactions with the epithelium, in the absence of a pathogenic threat. As expected from their tissue-resident phenotype facilitating epithelial interaction (Extended Data Fig. 9d–h), intraepithelial lymphocytes infiltrated the epithelium at physiological rates and patrolling speeds comparable with the organ of origin41 without compromising barrier integrity (Fig. 4d–i, Extended Data Fig. 9i,j and Supplementary Videos 4–6). By contrast, blood-derived T cells barely integrated into the epithelium (Fig. 4f).
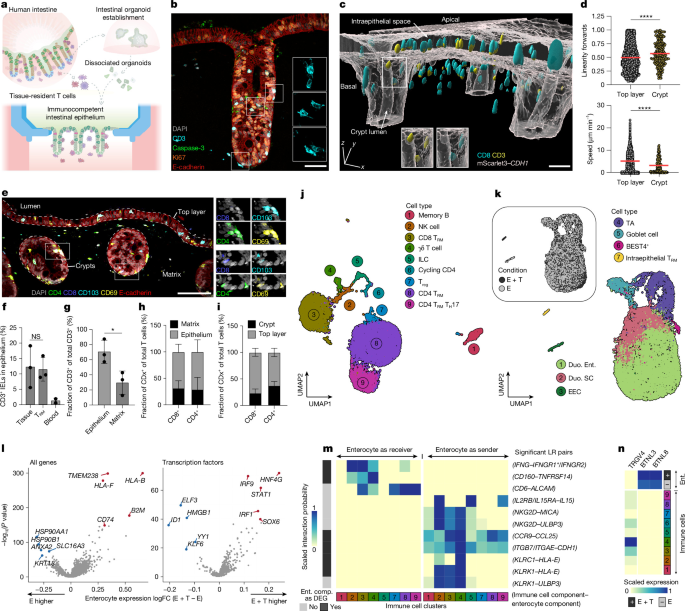
a, Schematic of immune cell incorporation into the system. b, mIF of a crypt cross-section showing CD3+ TRM cells (cyan) integrating into the epithelium (E-cadherin+, red); e = 6. Scale bar, 50 µm. c, 3D-reconstruction engineered tissue with CD8+ (cyan) and CD3+ (yellow) TRM cells in the matrix and CDH1–mScarlet3 reporter epithelium (grey); e = 1. Scale bar, 50 µm. d, Speed and linearity of TRM cell movement in the top layer and crypt from timelapse imaging (42 min) of the immunocompetent co-cultures (n = 3, d = 1). The dots denote individual T cells, and the red line indicates the mean. An unpaired two-tailed Mann–Whitney test was used (****P < 0.0001). e, mIF of CD4+ (green) and CD8+ (blue) TRM cells expressing CD69+ (yellow) and CD103+ (cyan) in the matrix and epithelium (E-cadherin+, red); e = 3. Scale bar, 100 µm. f, Intraepithelial integration of autologous tissue-derived, allogeneic blood-derived T cells in in vitro and in non-matched primary tissue. An unpaired two-tailed Welch’s t-test was used (P = 0.0359). IEL, intraepithelial lymphocyte. g, CD3+ TRM cell distribution between the epithelium and matrix (d = 3 (dots), n = 3–4). An unpaired two-tailed t-test was used (P = 0.0319). h,i, Localization of tissue-resident CD4+ and CD8+ T cells in the across compartments of engineered tissue. The bars in panels f–i represent mean ± s.d. (d = 3 (dots), n = 3). j,k, UMAPs of day 7 scRNA-seq of TRM cells co-cultured with epithelium (E + T) and epithelium-only controls (E), coloured by cell cluster (d = 1, n = 6 pooled). ILC, innate lymphoid cell; NK, natural killer; Treg, regualatory T. l, DEGs in the enterocytes upon TRM cell co-culture, defined by two-sided Wilcoxon rank-sum test with Benjamini–Hochberg adjustment. The red and blue dots highlight the top upregulated and downregulated genes, respectively. m, CellChat-derived interaction probability of enterocyte–TRM cells ligand–receptor (LR) pairs. Ent. comp., enterocyte component. n, Expression of BTNLs in enterocytes and TRGV4 receptor across immune cell types. Intestinal regions shown: duodenum (b–e,j–n), and duodenum and jejunum (f–i).
To resolve the cellular diversity and epithelium–immune crosstalk, we performed scRNA-seq after 1 week of co-culture. The immune compartment exhibited striking heterogeneity, comprising CD8 T (CD8 TRM) cells, CD4 T helper (CD4 TRM) cells, regulatory T cells, T helper 17 (TH17 TRM) cells, γδ T cells, natural killer cells, innate lymphoid cells (ILCs) and memory B cells (Fig. 4j), demonstrating maintenance of immune lineage fidelity (Extended Data Fig. 9k). TRM populations constituted the majority of the immune cell pool, remaining non-proliferative, consistent with their long-lived quiescent state in vivo42 (Fig. 4j and Extended Data Fig. 9d–g,k). Given their dominant representation, we refer to the entire immune compartment as ‘TRM cells’ henceforth. Although overall epithelial cell-type composition was unaffected (Fig. 4k and Extended Data Fig. 9l,m), immune cell presence induced epithelial antigen processing and presentation programs, marked by upregulation of MHC class I (MHC-I) components (HLA-B and B2M) and the MHC-II chaperone CD74 (Fig. 4l, Extended Data Fig. 9n–p and Supplementary Table 4). Transcription factor expression analysis in the enterocyte cluster linked gene expression changes to STAT1, IRF1 and IRF9, canonical hallmarks of IFNγ signalling (Fig. 4l), suggesting that immune-derived IFNγ facilitates this baseline immune priming43 (Fig. 4m). We confirmed IFNγ within culture supernatants at the protein level (Extended Data Fig. 9q).
Next, we found that engineered tissues recapitulate key epithelial–immune interactions, including IFNGR1/2–IFNG, IL15RA–IL15 (ref. 44) and TNFRSF14–CD160 (ref. 45) (Fig. 4m and Supplementary Table 7). Furthermore, introduction of resident immune cells drove upregulation of the butyrophilin-like (BTNL) molecules BTNL3 and BTNL8 within the epithelium, probably in a HNF4G-dependent manner46 (Fig. 4l). These epithelial BTNL molecules signal back to the immune compartment, facilitating maturation of Vγ4+ γδ T cells and establishing a protective mucosal circuit, whose disruption is linked to intestinal pathology47.
Together, these data suggest that engineered intestinal tissues preserve physiological immune cell behaviours and foster in vivo-like epithelial–immune interactions.
Epithelial IL-18 instructs TRM response
Having incorporated TRM cells into the engineered tissues, we next asked how they interpret epithelial-derived signals to orchestrate mucosal defence upon S.Tm infection. We challenged immunocompetent barriers with high-load S.Tm for 3 h following gentamicin treatment (Fig. 5a). Histological analysis confirmed bacteria within close proximity of intraepithelial lymphocytes (Fig. 5b). The presence of resident immune cells accelerated mucosal damage compared with epithelium-only controls, leading to increased epithelial shedding and loss of barrier integrity (Fig. 5c and Extended Data Fig. 10a–c). Attributing elevated epithelial damage to TRM cell activation, we analysed the basal compartment for inflammatory mediators observed in patients with gastroenteric Salmonella infection48,49. We identified two temporally distinct regimes of immune and epithelial responses. A rapid (10 hpi) first wave of IL-2 and IFNγ secretion, indicating a canonical CD4+ TH1 response, occurred concurrently with epithelial secretion of IL-18 (Fig. 5d). This initial response was followed by release of cytotoxic and antimicrobial effectors, including GzmB, IL-6 and TH17-associated cytokines (IL17A and IL-22). TNF, IL-13 and IL-1β were modestly induced (Fig. 5d and Extended Data Fig. 10d,e). Although facilitating pathogen clearance (Extended Data Fig. 10f), this TH1–TH17-driven TRM cell response was associated with mucosal injury.
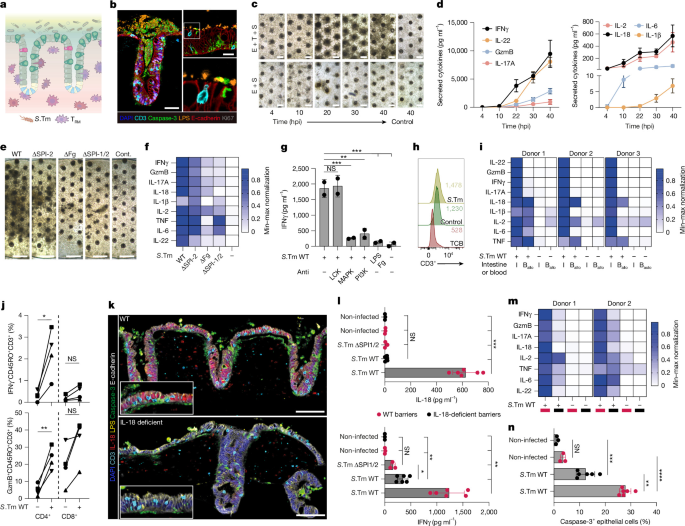
a, Schematic of tri-compartmental culture with a pathogen, engineered epithelium and TRM cells. b, mIF of S.Tm-mediated (LPS+, range) apoptosis (caspase-3+, green) in the epithelium (E-cadherin+ in red; Ki67+ in grey) with CD3+ TRM cells (cyan) at 48 hpi; e = 3. Scale bars, 50 µm and 20 µm (inset). c, Brightfield images of S.Tm WT-infected immunocompetent (E + T + S) and epithelium-only (E + S) barrier over time; e = 6. Scale bars, 200 μm. d, Secreted cytokines in E + T + S barriers over time. The lines represent mean ± s.e.m. (n = 3, d = 1). e, Brightfield images; e = 3. Scale bars, 500 μm. Cont., control. f, Secreted cytokines of S.Tm WT-infected and mutant-infected barriers at 48 hpi (n = 3, d = 1). g, IFNγ secretion at 48 hpi following IFNγ-induction pathway inhibition and luminal exposure to bacterial components. The bars represent mean ± s.d. (d = 2 (dots), n = 3). Nested one-way ANOVA with Dunnett’s multiple comparison test was used (PMAPK = 0.0008, PPI3K = 0.0014, PLPS + Fg = 0.0005 and PNon-infected = 0.0004). h, Assessment of CD3 TCR internalization in S.Tm WT-treated or EpCAM TCB-treated (5 ng ml−1) E + T barriers (48 h). Median MFI for CD3: S.Tm = 1,478 ± 22.9, control = 1,230 ± 17.1 and TCB = 528 ± 11.8. i, Secreted cytokines in immunocompetent barriers with autologous (auto) TRM cells and either auto or allogeneic (allo) blood-derived T cells at 48 hpi (d = 3, n = 3). j, Intracellular IFNγ and GzmB adundance in CD4+ and CD8+ memory T cells (CD45RO+) at 48 hpi. The lines represent mean (d = 4 (different symbols), n = 3). An unpaired two-tailed Welch’s test was used (*PGzmB = 0.0054 and NS = P > 0.05; PIFNγ = 0.0338 and NS = 0.2100). k, mIF of S.Tm-mediated (LPS+, yellow) apoptosis (caspase-3+, green), CD3+ TRM cells (cyan) with IL-18+ (red) WT epithelium barriers (E-cadherin+, grey), with IL-18-deficient barriers lacking IL-18 at 48 hpi. Scale bars, 100 µm. l, Secreted IL-18 and IFNγ in WT and IL-18-deficient immunocompetent barriers 48 hpi with S.Tm WT and ΔSPI-1/2 strains. The barplots represent the mean ± s.d. (d = 1, n = 3–6 (dots)). A one-way ANOVA with Dunnett’s multiple comparisons test was used (*P ≤ 0.0001 and NS = P > 0.05). m, Secreted cytokines in WT and IL-18-deficient immunocompetent barriers 48 hpi with S.Tm WT and ΔSPI-1/2 strains (d = 2, n = 3–5). n, Caspase-3+ cells of immunocompetent barriers 40 hpi with S.Tm WT. The bars represent mean ± s.d. (d = 1, n = 3–6). An ordinary one-way Anova with Tukey’s multiple comparisons was used (P < 0.0001, P = 0.0014, ***P = 0.0001 and NS = P > 0.05). Heatmaps represent minimum (min)–maximum (max) normalized average of respective samples (n = 3) per cytokine and donor (f,i,m). Intestinal regions shown: duodenum (b–f,h,i,k,l–n), ileum (g), and duodenum and jejunum (j).
To determine whether TRM cell activation requires epithelial invasion or only luminal exposure to the pathogen, we leveraged the S.Tm mutants introduced previously (ΔFg, ΔSPI-2 and ΔSPI-1/2; Fig. 3). We found that the extent of mucosal injury and the magnitude of TRM cell response correlated with S.Tm invasive capacity and epithelial IL-18 secretion (Fig. 5e,f and Extended Data Fig. 10g). Furthermore, in line with the stronger epithelial response described earlier (Extended Data Fig. 8g), S.Tm SL1344 induced a more rapid and severe immunopathology than S.Tm 14028 (Extended Data Fig. 10h). Together, these data link TRM cell responses to pathogen virulence, invasive capacity and subsequent epithelial cytokine secretion. Although TRM cell responses are classically defined by antigen-specific TCRs, their capacity for innate-like bystander responses is a critical yet poorly understood feature of human mucosal immunity. We sought to understand whether S.Tm-mediated TRM cell activation is driven by secreted epithelial signals rather than direct TCR binding to epithelial MHC. Inhibition of PI3K and p38 MAPK, essential for innate-like IFNγ induction50, significantly quelled the response, whereas TCR-dependent LCK inhibition51 showed no effect (Fig. 5g). Likewise, surface TCR expression remained stable during S.Tm infection, contrasting the expected downregulation triggered by synthetic TCR engagement via an EpCAM–CD3 bispecific52 (Fig. 5h). Conditioned media from infected epithelium-only barriers were sufficient to activate TRM cells, whereas direct stimulation with bacterial pathogen-associated molecular patterns (LPS and flagellin) failed to trigger degranulation (Fig. 5g and Extended Data Fig. 10i). We note that this non-cognate response appeared to be a hallmark of tissue residency, as allogeneic and autologous blood-derived T cells remained unresponsive to infection, despite exhibiting substantial CD45RO+ populations (Extended Data Fig. 9d), high viability and IL-2 induction capacity (Fig. 5i and Extended Data Fig. 10j,k). Together, these results establish S.Tm-induced TRM cell activation in this system as a TCR-independent bystander response that requires inflammatory signals relayed by the epithelium. The induction of IL-18 upon S.Tm invasion closely coincided with the kinetics of the T cell response (Fig. 5d), implicating this cytokine as a key epithelial orchestrator of T cell activation. This was supported by high expression of IL-18Rα on CD4+ TRM cells, which conferred pronounced responsiveness to exogenous IL-18 and S.Tm infection (Fig. 5j and Extended Data Fig. 10l,m). To assess its role as an epithelial messenger, we generated IL18 knockouts in intestinal organoids using CRISPR–Cas9, resulting in ablation of IL-18 expression at baseline and upon challenge (Fig. 5k and Extended Data Fig. 10n). Indeed, IL-18 levels in WT S.Tm-infected mutant barriers were comparable with those of the avirulent ΔSPI-1/2 infection and non-infected control (Fig. 5l). When assessing the TRM cell response, IL-18 deficiency significantly dampened the inflammatory response (Fig. 5l,m), attenuating intracellular IFNγ levels in the cytotoxic IL-18Rα+CD4+ responder population (Extended Data Fig. 10o). Critically, the loss of IL-18 protected the barrier from pathological shedding and thinning (Fig. 5n and Extended Data Fig. 10p) despite functional T cell responder potential, linking IL-18-driven T cell activation to immunopathology.
Collectively, these findings demonstrate that the epithelium orchestrates antibacterial mucosal defence by secreting IL-18 to trigger non-cognate, innate-like responses of the TRM compartment.
Discussion
We have reported bioengineered, luminally accessible human intestinal tissues comprising epithelia with periodically repeating crypts that maintain LGR5+ stem cells, in vivo-like cell composition and patterning, and retain transcriptomic signatures across multiple donors. Identical medium and biophysical culture conditions yield region-specific signatures due to stem cell origin. Cell-type maturation and a reduction in total apical volume enable the formation of a region-specific mucus layer with mature glycocalyx. In addition, autologous TRM cells patrol the barrier and engage in bidirectional crosstalk with the epithelium, conferring an immune-responsive state within epithelial cells via IFNγ signalling.
The modularity of the system enabled new inquiry into S.Tm infection in a human context, contributing to collective efforts to refine physiologically relevant enteric infection models53. Basolateral S.Tm localization within polarized cells presumably facilitates dissemination into the lamina propria, a phenomenon that has been reported in vivo54,55. In addition, the phenotypic divergence observed between SL1344 and 14028 strains could expand to clinical isolates and human-restricted pathogens (for example, Salmonella enterica subsp. enterica serovar Typhi, Shigella flexneri and Vibrio cholerae), including the study of host factors influencing bacterial gene expression and antibiotic susceptibility. We mapped the gene regulatory networks underlying luminal and intracellular S.Tm at single-cell resolution. The epithelium orchestrated inflammatory, metabolic and structural responses that accompany S.Tm colonization26 and demonstrate an innate-sensing capacity that coordinates multi-lineage immune recruitment in vivo. S.Tm invasion reshaped the host transcriptome through a SteE-dependent STAT3 gene regulatory hub that extends results in macrophages and immortalized lines29,31. The reduced SPI-2 contribution may stem from non-transcriptional effector roles or delayed activation resulting from the SPI-1-inducing pre-culture protocol56. In addition, changes in oxidative stress and iron homeostasis suggest a host–pathogen interplay associated with other intracellular infections57, warranting further study. Overall, these responses were highly influenced by the intracellular burden of the pathogen.
Advancing our previous work40 to an apically accessible immunocompetent system, we demonstrated that epithelial IL-18 upon S.Tm invasion is sufficient to drive TRM cell activation and cytokine release, reflecting clinical gastroenteric salmonellosis48,49. The system allowed us to elucidate the functional effects of this bystander T cell activation, aligning with previous reports of innate-like polyfunctional capabilities of TRM cells58,59,60. TRM cells intensified infection-mediated epithelial shedding, which probably contributes to pathogen clearance61 and is consistent with the rapid onset of diarrhoea during S.Tm infection. Although mouse studies have established the necessity of IL-18 for CD4+ T cell defence upon S.Tm infection62, it has been shown that enteric neurons, rather than the epithelium, serve as the critical source of IL-18 for intestinal protection63. We demonstrated that the human intestinal epithelium can potently activate TRM cells via IL-18 to drive defence responses, at least in an in vitro setting. Of note, S.Tm infection64 and IL-18 (ref. 65) have been linked to the onset of inflammatory bowel disease. Our data raise the possibility that this association may be underpinned by the appearance of a cytotoxic IL-18Rα+CD4+ T cell population58,62.
Although our platform provides a unique window into human intestinal in vitro modelling, several limitations remain. The engineered tissues lack villous structures, specialized Paneth or M cells, and myeloid immune lineages, crucial mediators of immunity against infection. The lack of fluid exchange might affect biophysical characteristics of a mucus layer accumulated by apical media reduction. Furthermore, S.Tm invasion rates probably exceed physiological levels due to mucus protection. Future studies may circumvent these limitations through bioengineering approaches9, mucus secretagogues, cytokine supplementation or the inclusion of additional commensal and immune lineages.
Beyond host–pathogen interaction, the engineered tissues and analytical framework expand what can be addressed ex vivo. The mature, patterned epithelium opens research directions in region-specific drugs and nutrient absorption, mucus biology and epithelial–TRM cell interactions implicated in inflammatory bowel disease pathogenesis. Overall, the platform brings the field closer to capturing complex, organ-level processes in a human setting that is controllable and tractable.
Methods
Human samples and ethics statement
Human intestinal tissue resections, along with concurrent data collection and experimental procedures, were conducted within the framework of the non-profit foundation Human Tissue and Cell Research-Services GmbH and the University Center for Gastrointestinal and Liver Disease, including informed patient consent. The framework of the Human Tissue and Cell Research-Services GmbH foundation received approval from the ethics commission of the Faculty of Medicine in the Ludwig Maximilian University (no. 025-12) and the Bavarian State Medical Association (no. 11142). The framework of the University Center for Gastrointestinal and Liver Disease was approved in accordance with the Helsinki Declaration and reviewed and approved by the ethics committee (Ethics Committee of Basel, EKBB, no. 2019-02118). Consenting patients underwent visceral surgery with partial resection of intestine (precise intestinal regions are listed in Supplementary Table 1) for various oncological indications. We used microscopically and/or macroscopically tumour-free regions of resectates for further preparation and downstream handling. A developing tissue resection was obtained following pregnancy termination and with written consent provided by the mother, in line with local laws and certified procurement services. All tissues were fully anonymized, and all procedures were conducted in accordance with relevant ethical guidelines and regulations.
Microdevice design and fabrication
During the work on this project, a large number of microdevice prototype versions were fabricated using a range of microfabrication techniques, including cleanroom soft lithography, 3D printing, two-photon polymerization (2PP) lithography, computer numerical control (CNC) milling and plastic injection molding. The final chip is designed in a slide format (75 × 25 mm) containing three independent chips per slide. Each chip contained a central hydrogel chamber flanked by two side medium reservoirs and one top medium reservoir. The hydrogel precursor was injected through a loading port leading to the central gel chamber. A cylindrical stamp with a microtopography (for example, an array of biomimetic micropillars) on its base was placed onto a stamp-holding edge of the top reservoir before gel injection. After gel polymerization (see details in a separate section), the stamp was removed, leaving an inverse microtopography (for example, an array of microwells) on the hydrogel surface. The top and side reservoirs were then filled with PBS or cell culture medium. The top reservoir was used for cell seeding and subsequently served as the apical medium reservoir after epithelial coverage of the hydrogel and barrier formation. Medium from the side reservoirs passively diffused through the gel, supplying the epithelial tissue with nutrients from the basal side. Early prototypes were fabricated using conventional soft lithography and polydimethylsiloxane (PDMS) molding workflows established at the Center of Micronanotechnology (EPFL). The 3D chip design was split into two photomasks that were sequentially aligned to enable the creation of pseudo-3D features and different heights for phase-guiding micro-pillars. Chip layouts were patterned onto chrome-coated fused silica substrates via laser lithography (VPG200, Heidelberg Instruments). Three layers of SU8 GM1075 (Gerlteltec) were sequentially spin coated onto dehydrated silicon wafers to achieve a total mold thickness of 750 μm. The first two 250-μm layers were soft baked, exposed to UV through the first photomask (MA6/BA6, Süss MicroTec) and post-baked. Then, the third SU8 layer was spin coated, soft baked and the second photomask was aligned to the existing pattern using dedicated alignment marks. After a final post-exposure bake and development with propylene glycol monomethyl ether acetate (PGMEA; Sigma), the molds were hard baked at 135 °C for 4 h and silanized overnight using vapour-phase trichloro(1H,1H,2H,2H-perfluorooctyl) silane (Sigma-Aldrich). PDMS (Sylgard 184, Dow Corning) was mixed at a 10:1 base-to-curing agent ratio, poured onto the molds, degassed under vacuum and cured at 80 °C for 24 h. PDMS replicas were cut, punched and plasma bonded to glass-bottom dishes. The strength of the soft lithography pipeline is in fabrication of high-resolution microfeatures and with relatively optimal throughput, as 10–20 chips can be produced from a single wafer. However, fabrication of the models taller than 500 μm is challenging and only step-like, pseudo-3D features from a single side of the PDMS layer can be fabricated. To overcome these limitations, we explored several other complementary fabrication strategies. Commercial 3D-printing techniques such as fused deposition modelling and stereolithography were used for the production of larger models (Formlabs Form 4). However, these methods lacked the resolution and surface finish required for high-quality PDMS molding and were suitable only for some early-stage proof-of-concept prototypes. Instead, here we used 2PP lithography using the UpNano NanoOne printer to fabricate detailed 3D features of the chip. In brief, 3D models of the microchip were created in Autodesk Fusion (latest version), exported as STL files and processed using UpNano Think3D software. The models were printed on glass coverslips using UpPhoto resin (UpNano). NanoOne stands out as the most developed printer for mesoscale manufacturing, enabling printing of large structures (10–20 mm in xy and up to 40 mm in height) due to several advanced technologies: a submerged printing mode in a large resin reservoir, high-power 1,000 W, 780-nm laser for fast printing with 5 × 0.25 numerical aperture (NA) objective and adaptive resolution technology that significantly reduces print times (up to 450 mm3 h−1). After printing, the coverslips were washed in isopropanol and silanized overnight using vapour-phase trichloro(1H,1H,2H,2H-perfluorooctyl) silane (Sigma-Aldrich). PDMS was cast, degassed, cured at 80 °C and then replicas were cut and plasma bonded to glass-bottom dishes. This method allowed us to fabricate high-quality prototypes for validation of the 3D microstructural design elements. However, the main limitation is the upscaling technology for fabrication of the large number of chips. More importantly, process flow is still resulting in the 3D topography features only from one side of the PDMS replica. To overcome the latter problem, commonly some laboratories fabricate multi-layered PDMS chips. In this approach, individual PDMS layers are fabricated separately, aligned and plasma bonded together. This direction was explored early on for fabrication of a few prototypes; however, the alignment process is tedious and unsuitable for large-scale chip manufacturing with the acceptable quality. To address this, inspired by industrial injection molding technology, we developed a cassette mold for PDMS curing. Molds were manufactured by CNC milling of acrylic, aluminum or steel, depending on the desired feature size and quality. Each cassette consisted of two mold parts bearing microtopographies of the bottom and top surfaces of the chip. When assembled, the parts fit precisely, enabling accurate alignment of both sides of the device. PDMS was injected into centre space of the mold, degassed in a vacuum chamber and cured in an 80 °C oven. After curing, the mold was opened and the PDMS sheets were cut and bonded to glass-bottom dishes. This process overcomes many of the limitations of previously described techniques and enables scalable production of hundreds of high-quality chips in a single batch. The main drawback is the need to adapt design features for CNC milling: some of the smallest features must be enlarged and sharp corners rounded. However, we did not consider this as a drawback as concurrently we began exploring industrial plastic molding technologies to eliminate the last remaining problem: the PDMS material itself. Although PDMS is ideal for prototyping, its high absorption of small molecules makes it unsuitable for translational applications and drug testing. Many of the learnings and design optimizations from the PDMS cassette-molding process were directly translated into the design of the final injection-molded plastic chip. Currently, the chip body is fabricated from cyclic olefin copolymer (COC) due to its low shrinkage, chemical resistance and optical transmission. The main body was fabricated as a single piece, followed by bonding of a 170-μm COC film to the bottom surface. A matching lid converting the slide was later designed and produced separately also via a COC injection molding process. After assembly, chips were packaged and sterilized using ethylene oxide gas. Large-scale chip production was outsourced to an external manufacturing facility.
Stamp fabrication
Stamps featuring crypt-mimicking microtopography were fabricated from PDMS via replica molding of 2PP-printed models. First, arrays of colon crypt-mimicking micropillars were designed in Autodesk Fusion (latest version). Several topographies were tested and optimized, the final microtopography design consisted of the slightly conical pillars, ranging from 70 to 120 μm in diameter (top to bottom) and 700 μm in height. The 3D model was printed using a NanoOne (UpNano) 2PP printer on glass coverslips with UpPhoto resin and a 10 × 0.4 NA objective. To generate a master mold with inverted topography, the printed structures were plasma activated and silanized overnight using vapour-phase trichloro(1H,1H,2H,2H-perfluorooctyl) silane (Sigma-Aldrich). PDMS (Sylgard 184, Dow Corning; 10:1 base-to-curing agent ratio) was poured over the master, degassed under vacuum and cured at 80 °C for 12 h. The resulting PDMS replica was cut, plasma activated and silanized overnight as above. This PDMS negative was then used repeatedly as a mold for casting final PDMS stamps using the same procedure (Sylgard 184, 10:1 ratio, cured at 80 °C for 12 h).
Microstamping hydrogel topography
To generate the ECM for the chip bovine TeloCol-6 type I collagen solution (5225-50 ml, Advanced Biomatrix) was neutralized following the manufacturer’s instructions and then mixed with Matrigel (356231, Corning) in 87.5:12.5 (v/v) ratio. A PDMS stamp with crypt-mimmicking array of pillar topography was placed in the central top reservoir. After the gel injection through the gel-loading port, the hydrogel was polymerized on a 37 °C hotplate for 10 min. After ECM polymerization, all chip reservoirs were topped up with PBS or cell culture medium. Prepared chips with hydrogels can be stored for multiple weeks at 37 °C at 5% CO2 (hereafter referred to as ‘incubator’) or in the +4 °C fridge before use. Hydrogel stiffness was measured using an MCR 702e MultiDrive oscillatory shear rheometer (Anton Paar) in a parallel plate configuration with a PP25/P3 measuring plate. The Young’s modulus (E) was estimated from the storage modulus (G′), assuming the hydrogel is elastic and nearly incompressible, using the relation E = 2 G(1 + ν) ≈ 3 G′, where Poisson’s ratio (ν) is approximately 0.5. Across multiple batches and replicates, the hydrogels yielded a Young’s modulus of 3,000 ± 500 Pa.
Isolation of tissue-resident immune cells and intestinal organoids
In brief, intestinal tissue was processed by removal of the underlying muscularis, serosa and fat from the basal side of the intestinal tissue using forceps and scissors. The remaining mucosal tissue was thoroughly washed with DPBS (10010-015, Gibco), supplemented with penicillin–streptomycin (1,500 U ml−1; 15140122, Gibco), gentamicin (500 µg ml−1; 15750060, Thermo Fisher Scientific) and primocin (50 µg ml−1; ant-pm1, Invivogen) before using a glass coverslip to remove excess mucus from the luminal side and blood vessels from the basal side.
Tissue-resident immune cell isolation
To circumvent the poor viability and phenotypic alterations associated with traditional enzymatic disassociations66,67, we adapted and optimized a scaffold-based egression method68 that we have previously shown maximizes tissue-resident immune cell recovery and maintains phenotypic integrity40. As previously reported40, our characterization via scRNA-seq and flow cytometry analysis showed that the vast majority of the isolated cells are TRM cells. Therefore, we used the term TRM cells to describe the total immune cell fraction isolated from intestinal tissue. By flow cytometry, we characterized them as TRM cells based on the assessment of one or multiple of the following markers CD45RO+, CD69+, CD103+, CD45RA− and CCR7−.
Cleaned tissue was cut into square pieces (approximately 5 × 5 mm3) with a scalpel. Next, each fragment was loaded onto a 9 × 9 × 1.5 mm3 tantalum-coated, carbon-based scaffold (MSPP23281-1-REV-A, Ultramet) and cultured in 24-well plates (CC7682-7524, CytoOne) containing 2 ml of cytokine-free immune medium (Supplementary Table 1). Twenty-four hours later, scaffolds with tissue on were removed, and egressed cells were harvested from the bottom of the wells by thorough pipetting. Cells were then counted and biobanked in CryoStor (C2874, Sigma-Aldrich) before further use.
Intestinal organoid generation
For isolation of donor-matched crypts for organoid establishment, an adjacent clean tissue piece (approximately 3 cm2) was used. Intestinal villi were removed from the tissue by using a glass coverslip. The tissue was then incubated on ice in DPBS + 10 mM EDTA (15575020, Thermo Fisher Scientific) on a shaker for 30 min. Next, a coverslip was used to scrape off the crypts of the tissue. Crypts were collected in organoid medium (Supplementary Table 1). Crypts were centrifuged and resuspended in GFR Matrigel (356231, Corning). After polymerization for 15 min at 37 °C, organoid medium was added with 10 µm Y-27632 (72305, Stemcell Technologies). Following organoid formation, organoids were passaged every 7 days (up to a maximum of 25 passages). After three passages, organoid mycoplasma tests (LT07-710, Lonza) were performed. All lines used in this study were verified as negative for mycoplasma. Organoid banking was performed using CELLBANKER 1 (11888, Nippon Zenyaku Kogyo). Passaging was performed as previously described52. In brief, organoid medium was removed and wells were washed with DPBS. Next, 500 µl of Gentle Cell Dissociation reagent (07174, Stemcell Technologies) was added and incubated for 2 min at room temperature before collecting the domes in a Falcon tube. After a further 15 min of incubation at room temperature, the suspension was centrifuged at 350g at 4 °C for 5 min. After removal of liquid, the pellet was harshly resuspended with organoid wash medium (Supplementary Table 1) to break the organoids. Broken organoids were centrifuged at 500g and the supernatant discarded before pellet resuspension in GFR Matrigel.
Genetic engineering of organoid lines
To generate LGR5, CDH1 and H2BC4 reporter lines, targeting vectors were designed as previously described69. Human intestinal organoids were incubated with 1.25% DMSO (v/v) and 10 µM Y-27632 (72305, Stemcell Technologies) 24 h before electroporation. Organoids (amounting to approximately 1 million cells per condition) were harvested, dissociated to clumps of 3–5 cells with TrypLE (12604-013, Gibco), washed twice with Optimem (31985070, Gibco) and then resuspended in High Performance Electroporation Solution (45-0805, BTXpress) containing up to 10 µg of targeting vector and 10 µg of Cas9 and guide RNA-expressing vector. Cells were electroporated using the NEPA21 Super Electroporator (Nepagene) with settings as previously described70. Y-27632 was kept for 48 h post-single-cell seeding in growth factor-reduced Matrigel (356231, Corning). Reporter-positive organoids were either picked manually or enriched via FACS.
To generate IL-18 gene knockouts, cells were transfected with 20 µg Cas9–GFP and guide RNA expression constructs at a 1:8 ratio and incubated overnight in culture medium containing 5% Matrigel. Transfected cells were FACS enriched and allowed to grow for 10–14 days. Up to eight clones were manually picked and genotyped by Sanger sequencing of the targeted locus.
Genetic engineering of bacteria
S.Tm NCTC 12023 (identical to ATCC14028) and SL1344 WT and isogenic mutant strains were used as listed in Supplementary Table 1. If required for detection of Salmonella by GFP expression, plasmid pFPV25.1 was introduced by electroporation and maintained by selection with 50 µg ml−1 carbenicillin (Roth).
Mutant strains with deletion in invG or steE were generated by λ-Red recombination as previously described71 using pKD13 as template for amplification with Del13 primer sets (synthesized by IDT) listed in Supplementary Table 1, and pWRG730 for expression for λ-Red recombinase functions72. Proper insertion of the aph resistance cassette in target genes was confirmed by colony PCR using DelCheck for primers and K1 Red-Del. If required, the aph resistance cassette was removed by FLP recombination mediated by helper plasmid pE-FLP73. Resulting clones were checked for loss of kanamycin resistance and pE-FLP, and FLP-mediated deletion was confirmed by colony PCR using DelCheck For/Rev primer sets.
Strain MvP3487 was generated by P22 transduction of the ΔssaV::aph allele into MvP1764 according to standard procedures. Resulting mutant strains were checked for the absence of lysogens.
Seeding and culture of engineered intestine
For seeding of the chips—hereafter referred to as ‘engineered intestines’ once intestinal epithelial cells are included—approximately 4-day-old human intestinal organoids from different regions of the gastrointestinal tract (duodenum, jejunum, ileum and colon) between passages 5 and 25 were collected in base medium (Supplementary Table 1) and transferred to a 15-ml Falcon tube. Following centrifugation at 300g at 4 °C for 4 min, the base medium was aspirated and the pellet was thoroughly resuspended in base medium. After repeating the centrifugation step, organoids were singularized with TrypLE express solution (12604-013, Gibco) containing 250 U ml−1 DNase I (4536282001, Roche) and 10 µm Y-27632 (72305, Stemcell Technologies) for 8 min at 37 °C before harsh resuspension. This step was performed twice before swiftly blocking the dissociation by adding base medium with 10% FBS. Next, cells were passed through a 40-µm strainer (43-50040-51, PluriSelect) before centrifugation at 500g at 4 °C for 4 min. Afterwards, the cells were resuspended in chip medium (Supplementary Table 1) containing 10 µm Y-27632. Approximately 1.5 × 10⁵ cells were seeded in a volume of 3 µl onto each micropatterned hydrogel. Approximately 150 µl chip medium with 10 µm Y-27632 was immediately added to each side reservoir of the engineered intestines, whereas the mid-chamber remained empty to allow the cells to attach to the ECM. After 30 min in the incubator, 100 µl chip medium (+10 µm Y-27632 + 5% FBS) was carefully added to the mid-chamber to avoid cell detachment. Culture medium was exchanged every second day. Approximately 5% of FBS supplementation was removed after the second day (details in Supplementary Table 1).
Immune cell hydrogel seeding and culture of immunocompetent engineered intestines
On the day of hydrogel seeding, TRM cells or peripheral blood mononuclear cells were thawed following our previously described protocol52. T cells were isolated from peripheral blood mononuclear cells using the EasySep Human T Cell Isolation kit (17951, Stemcell Technologies) and EasySep Magnet (18000, Stemcell Technologies) following the manufacturer’s instructions. Viability and number of immune cells were assessed with Trypan Blue (216040, Invitrogen) on a Countess II (Invitrogen). If the viability of the thawed TRM cells crawl-out was less than 75% (due to remaining tissue debris), Dead Cell Removal Kit (130-090-101, Miltenyi Biotec) was applied with MS columns (130-042-201, Miltenyi Biotec) on the OctoMACS separator (130-042-109, Miltenyi Biotec) following the manufacturer’s instructions (typically improved to more than 85% viability). Afterwards, immune cells were placed in the incubator until further processing. Chips were prepared as described above until hydrogel loading. Then, approximately 1 × 10⁵ immune cells were mixed with 6 µl of ECM per chip. Next, 26 µl of ECM was dispensed through the loading port per chip into the mid-reservoir. Immediately after, 6 µl of the ECM-immune suspension was carefully dispensed onto a flipped PDMS stamp, with the micropattern facing upwards, and transferred using forceps onto the previously dispensed ECM in the mid-reservoir of the engineered intestine. Next, immune-hydrogel suspensions were polymerized at 37 °C for 15 min. After polymerization of the ECM, the immune chip slide was topped up with immune chip medium (Supplementary Table 1) to ease microstamp removal. After organoid dissociation and epithelial cell seeding as described above, 150 µl immune chip medium containing 500 pg ml−1 IL-15 (570306, BioLegend) and 10 µm Y-27632 was immediately added to each side reservoir of the engineered intestine, whereas the mid-chamber remained empty to allow for cells to attach to the ECM of the engineered intestine. After 30 min in the incubator, 100 µl immune chip medium (+500 pg ml−1 IL-15 + 10 µm Y-27632) was carefully added to the mid-chamber. Immune chip medium (+500 pg ml−1 IL-15) was exchanged every second day.
Recombinant cytokine and condition medium treatments of TRM cells in suspension
To assess the effects of bacterial components on TRM cells in suspension, LPS (100 ng ml−1; L3024-5MG, Sigma-Aldrich) and flagellin (50 ng ml−1; tlrl-epstfla-5, InvivoGen) were supplemented in immune medium and cultured for 48 h. Similarly, IL-15 (500 pg ml−1) and IL-18 (10 ng ml−1; 592106, BioLegend) were added in immune medium for TRM cell suspension cultures, either individually or in combination, for 48 h. For the assessment of T cell activation in response to the epithelial secretome, conditioned medium was harvested from the basal reservoirs of epithelium-only chips 48 hpi with S.Tm. This medium was collected, transferred to plates and maintained at −80 °C until the day of the experiment. Upon thawing, condition medium was mixed 1:1 (v/v) with fresh immune medium supplemented with 1,000 pg ml−1 of IL-15, resulting in a final concentration of 500 pg ml−1 of IL-15. TRM cells were subsequently cultured in this mixture for 48 h in suspension. Following these culture periods, cells were subjected to analysis by flow cytometry.
Flow cytometry of isolated and digested immune and epithelial cells
Tissue dissociation and single-cell preparation
For baseline phenotyping, immune cells were recovered from intestinal resections, filtered through a 40-µm strainer and processed directly. For assessment of luminal content, cells were recovered from the accessible luminal reservoir of the chips. For chip-harvested samples and suspension-cultured TRM cells intended for intracellular cytokine assessment, samples were treated with a protein transport inhibitor cocktail (00-4975-93, Thermo Fisher Scientific) for 4 h before harvest. To achieve single-cell suspension of tissues for staining, samples were retrieved via a 3-mm biopsy punch and transferred to warm RPMI supplemented with L-glutamine (1X), 5% FBS, HEPES (1X), DNAse I (40 U ml−1), collagenase D (2 mg ml−1; 11088858001, Millipore) and trypsin inhibitor (1 mg ml−1; T9128, Sigma). Samples were incubated in a shaker (1,000 rpm at 37 °C) for 10 min with mechanical dissociation via vigorous pipetting every 3 min. Following visible disintegration, cells were centrifuged (500g for 3 min), resuspended in Accutase with DNAse I (40 U ml−1) and incubated for 10 min at room temperature until a single-cell suspension was achieved. All samples were filtered (40 µm) and washed twice in FACS buffer (DPBS supplemented with 2 mM EDTA and 2% FBS) before staining.
Regular surface and intracellular staining
Cells were incubated with True-FcX (1:200; 422302, BioLegend) in Brilliant Stain Buffer (566385, BD Biosciences) for 10 min at room temperature in PBS, followed by a fixable viability dye in PBS (00-4975-93, Thermo Fisher) for 10 min following centrifugation. Surface antibodies were applied in FACS buffer for 15 min at room temperature. Following centrifugation and surface labelling, samples were processed according to their experimental requirement. Baseline samples were fixed with 4% paraformaldehyde (PFA) for 30 min at room temperature. Intracellular cytokine samples were fixed using IC fixation buffer (30 min in the dark at room temperature; 15284728, Invitrogen), washed in 1X permeabilization buffer (15284728, Invitrogen) and incubated with intracellular antibodies for 30 min at room temperature. Finally, samples were washed once more in 1X permeabilization buffer before centrifugation.
29-Colour surface and intracellular staining
Cells were incubated with True-FcX (1:200; 422302, BioLegend) and brilliant stain buffer (566385, BD Biosciences) in FACS buffer for 15 min at 4 °C. Without washing, a 2X concentrated antibody master mix of chemokine receptors (CX3CR1, CXCR5, CCR7 and CD103) was added directly and incubated for 20 min at 37 °C in the incubator. Following centrifugation, the remaining surface antibodies and streptavidin were applied in FACS buffer for 20 min at 4 °C, followed by a single wash with PBS and centrifugation. Viability dye was then added in PBS for 20 min at 4 °C, followed by centrifugation. To fix and permeabilize the cells for intracellular cytokine and transcription factor staining, the FoxP3 kit (00-5523-00, Thermo Fisher Scientific) was used according to the manufacturer’s instructions (30 min at 4 °C). Following centrifugation, intracellular antibodies were prepared in 1X permeabilization buffer and incubated for 30 min at 37 °C. Finally, samples were washed twice in 1X permeabilization buffer before the final centrifugation and acquisition.
Final cell suspensions were resuspended in 150 µl FACS buffer and acquired on a BD Fortessa or a Cytek Aurora (five-laser configuration). Data were analysed using FlowJo (v10; BD Biosciences) and OMIQ (v1.22; Dotmatics). All surface and intracellular staining antibodies can be found in Supplementary Table 1.
High-dimensional data preprocessing and statistical analysis
From the raw data acquired by flow cytometry, using FlowJo software (v10.10; BD Biosciences), live CD45+ cells were identified using manual gating. For flow-cytometry data, the compensation matrix was corrected in FlowJo (BD Biosciences) by pre-gating on live immune cells, and the total fraction of live singlet immune cells was exported. Data were then transformed with an inverse hyperbolic sine (arcsinh) function (cofactors ranging between 400 and 10,000), then imported into the OMIQ environment (v1.22; Dotmatics) for subsequent analysis.
The high-dimensional analysis was carried out based on the workflow previously described74. In brief, UMAPs75 were generated, and FlowSOM clustering76 was overlaid on the dimensionality reduction maps. Frequency plots were generated downstream of manual gating outputs using Prism (v10.6.1).
Permeability assessment of engineered intestinal epithelium
To assess the barrier integrity of the engineered epithelia in homeostatic conditions, the apical and basal media were aspirated thoroughly. Next, 120 µl of a 100 µg ml−1 solution of Cascade Blue hydrazide, trilithium salt (C3239, Invitrogen) in chip medium (Supplementary Table 1) was added to the apical reservoir. Of chip medium without Cascade Blue, 170 µl was added to the side reservoirs. The assay was carried out for 180 min in the incubator. Subsequently, the fluorescence of the basal medium was quantified using Cell Culture Microplates (655090, Greiner Bio-one) in the Flex Station 3 plate reader (Molecular Devices), with measurements taken from the top at an excitation wavelength of 380 nm and an emission wavelength of 420 nm using the software SoftMax Pro (v7.2). The concentration of Cascade Blue that diffused to the basal compartment was calculated against a standard curve and the resulting apparent permeability (Papp) was quantified using the following formula:
where Vbasal is the volume of the basal compartment, dCbasal is the measured concentration in the basal compartment, A is the area of the epithelial monolayer grown on the ECM (0.19477 cm2), dt is the time of the assay and Capical, t = 0 is the initial concentration added to the apical reservoir at the start of the assay. For infection experiments, one gentle DPBS wash was performed in the apical reservoir of control and infected samples to remove the majority of the grown biofilm before permeability assessment. The Cascade Blue, in addition to 200 µg ml−1 of gentamicin (G1397-10ML, Sigma-Aldrich), were supplemented in the chip medium. The assay was conducted over a period of 90 min, and fluorescence was measured from the bottom using a cell culture microplate that was covered with a transparent adhesive foil on top.
Mucus accumulation strategy and staining
The accumulation of mucus was facilitated by reducing the total apical volume from approximately 120 to 100 µl of chip medium (Supplementary Table 1) to either approximately 30 µl or about 5 µl, based on the experimental needs. Generally, approximately 30 µl allowed for an accumulation of a less dense mucus that stayed hydrated. Accumulation with approximately 5 µl allowed for a denser layer of mucus that temporarily dried during the day and often acquired a yellow hue. The mucus accumulation strategy was initiated on day 4–5 of culture after full coverage of the ECM surface and appearance of goblet cells. The accumulation strategy was continued for 4–5 days and the accumulation of mucus on the epithelium surface was monitored by brightfield microscopy. To simulate liquid exchange, approximately 5 µl of fresh chip medium was added once or twice per day to compensate for liquid absorption by the intestinal epithelium and resulting air–liquid interface at the centre of the apical reservoir. In the accumulation with approximately 30 µl, the volume was monitored every day and adjusted to about 30 µl. The whole volume was exchanged every second day.
Staining of the secreted mucus for live imaging was performed by an overnight incubation with 30 µl or 5 µl of 488 wheat germ agglutinin (25 µg ml−1; W11261, Invitrogen), respective of the accumulation strategy. In cases in which higher fluorescence signal of the secreted mucus was desired, additional wheat germ agglutinin incubations were performed in consecutive days. Shed cells were stained with an overnight incubation with SiR700 (3 µM; SC015, Sphirochrome) in chip medium. Confocal images were acquired as described in ‘Confocal microscopy imaging’. 3D reconstruction of the mucus was generated using the Leica Application Suite X (LAS X) software (4.6.1.27508) and adjusted for visualization purposes.
Proteomic assessment of the luminal content
For proteomic assessment of the luminal content, the mucus of the engineered intestines was accumulated for 5 days, reducing the luminal volume from approximately 100 µl to about 5 µl. In these samples, DMEM/ F12 (31331-028, Gibco) + HEPES (10 mM) + primocin (50 µg ml−1) was used as apical medium. For collection, the luminal content was collected by pipetting 5 µl of fresh apical medium up and down thoroughly and transferred to a Protein LoBind 1.5-ml tube (022431081, Eppendorf). This step was repeated a total of four times. The samples were immediately stored at −80 °C until further use.
Samples were processed into peptides using the iST kit (PreOmics), according to the manufacturer’s instructions. Mass spectrometry analysis was conducted on an Orbitrap Fusion Lumos Tribrid Mass Spectrometer (Thermo Fisher Scientific) device equipped with a Nanospray Flex Series Ion Source and a PRSO-V2 sonation oven (Sonation), which was coupled to an EASY-nLC 1200 system (Thermo Fisher Scientific). Samples were resuspended in 2% acetonitrile and 0.5% formic acid in water and loaded onto a C18 trap column (Acclaim PepMap 100 C18 HPLC Columns 20 mm × 75 µm; 3 µm) at a flow rate of 20 μl min−1; peptides were separated using a 75-μm inner diameter C18 column (Aurora Column 25 cm × 75 µm C18 1.7 µm; Gen3; (IonOpticks). Chromatographic separation was achieved using the following conditions: buffer A was 0.1% formic acid in water; buffer B was 80% 0.1% formic acid in acetonitrile. The column oven and autosampler tray were held at 40 °C and 7 °C, respectively. The chromatographic gradient was run at a flow rate of 250 nl min−1 as follows: 0–47 min: linear gradient from 9 to 20% B; 47–90 min: linear gradient from 20 to 40% B; 90–92 min: linear gradient from 40 to 97%; 92 to 104 min: hold at 97%. The mass spectrometer was operated in positive mode with the spray voltage set to 1.7 kV and the ion transfer tube held at 275 °C (Xcalibur, v4.7 SP1). All measurements were performed in data-dependent mode. Precursor mass spectra were recorded in a range of 375–1,500 m/z with the resolution set at 240,000 the AGC (automatic gain control) target set in the standard mode and the maximum injection time in auto mode. For tandem mass spectrometry acquisition, data recorded in centroid mode with injection time was set to maximum 50 ms with a gain control setup at 100%. Normalized collision energy was set to 30. All experiments were recorded in ITMS mode and scan rate was turbo. Data were extracted and searched against the SwissProt database (June 2024) by using Proteome Discoverer 2.5 (Thermo Scientific) and Mascot (v2.8.2; Matrix Science). All cysteines were considered alkylated (carbamidomethyl), and oxidation of methionine and protein N-terminal acetylation were allowed as variable modifications. Data were first searched using fully tryptic constraints. Matched peptides were filtered using a percolator-based 1% false discovery rate. Intensity-based absolute quantification (iBAQ) values were calculated with an in-house R script using R (v4.3.0), Biostrings (v2.68.1) and tidyverse (v2.0.0). In brief, the number of theoretically possible tryptic peptides with 6–30 amino acids was calculated based on an in silico tryptic digest of the human SwissProt database already used for the Proteome Discoverer (PD) search. The theoretical peptide count was then mapped to the PD output by protein accession. Finally, the iBAQ value was calculated by dividing the respective protein abundance by the theoretical number of tryptic peptides. Proteins with only one unique peptide and any missing values for any of the engineered intestine replicates within each donor were excluded from the analysis. iBAQ values for each protein were averaged first across engineered intestines within each donor and then across donors to generate the final iBAQ rank plots.
Commensal bacteria co-culture experiments
E. faecium (19434, American Type Culture Collection (ATCC)) inoculums were grown overnight at 230 rpm at 37 °C in 4 ml of brain heart infusion (1002417, MP Biomedicals) medium. L. rhamnosus (7469, ATCC) inoculums were grown overnight at 230 rpm at 37 °C at 5% CO2 and 95% humidity in 10 ml of De Man, Rogosa and Sharpe (MRS) medium (1106610500, Millipore). For both strains, 50-ml Mini Bioreactor tubes (431720, Corning) were used for the overnight cultures. Following overnight growth, the optical density at 600 nm (OD600) values of the cultures were measured to adjust the bacterial concentration to 108 CFU ml−1. The bacteria were then pelleted by centrifugation at 10,000 rpm (E. faecium) or 5,000 rpm (L. rhamnosus) for 1 min and washed once with PBS. Subsequently, the pellets were resuspended in 1 ml of DMEM, low glucose, pyruvate (31885-023, Gibco) + HEPES (1:100, 15630080, Gibco) medium and serially diluted. In the case of L. rhamnosus, a 10% (v/v) supplementation of MRS was added. Finally, the desired number of bacteria was added in 30 µl of the corresponding medium to the apical compartment of the engineered intestines, which were cultured in the absence of primocin since day 0. The co-cultures were maintained in the incubator until the end of the experiment. To measure the number of bacteria on the samples, the luminal content including mucus was pipetted up and down thoroughly and transferred to a 1.5-ml tube, capturing the predominant fraction of the apical reservoir. This step was repeated with extra 100 µl PBS washes. A serial dilution of the total collected content was performed and the bacteria were plated and counted in TSA plates (43019, Biomerieux).
S.Tm infection experiments and gentamicin protection assays
Epithelium–mucus–S.Tm experiments
Engineered intestines were cultured in chip medium (Supplementary Table 1) without primocin until the day of infection. Different mucus accumulation strategies were followed depending on the condition (Mucushi: 4 days, 5 µl; Mucusint: 2 days, 5 µl; Mucuslo: 4 days, 120 µl + 1× wash before infection; see Fig. 3). The GFP reporter strain of S.Tm (14028GFP, ATCC) was used to infect the epithelial monolayer. S.Tm inoculums were grown overnight at 37 °C and 230 rpm in 10 ml of brain heart infusion (1002417, MP Biomedicals) medium with 100 µg ml−1 ampicillin (A53542, Sigma-Aldrich) using 50-ml Mini Bioreactor tubes (431720, Corning). Following overnight growth, the OD600 values of the cultures were measured and adjusted to desired concentration in chip medium (Supplementary Table 1). The desired number of bacteria (105 or 104 CFU according to the experiment) was added to the apical compartment on top of the epithelium and in a total volume of 5 µl to preserve the mucus structure. The co-culture was maintained in the incubator for 18 hpi or 24 hpi. To measure the number of bacteria on the samples, the luminal content was resuspended in 100 µl of PBS in situ, pipetted up and down thoroughly, and transferred to a 1.5-ml tube. This step was repeated one more time. Serial dilutions of the collected content were plated and counted in TSA plates (43019, Biomerieux). Gentamicin protection assays (see the next section) were performed to measure the number of intracellular bacteria.
Epithelium–S.Tm experiments ± TRM cells
Related to Figs. 3 and 5, engineered intestines in the absence of TRM cells were cultured in chip medium (Supplementary Table 1) without primocin until the day of infection without mucus accumulation steps. Infections were carried out using provided WT and mutant strains (ΔfliC–ΔfljB, ΔsiiF, ΔinvG–ΔssaV, ΔssaV and ΔsteE) of S.Tm (strain 12023, NCTC; reference equivalent of ATCC 14028), either harbouring GFP-reporter plasmids or unlabelled, as specified in figure legends (Supplementary Table 1). For specific experiments, an additional S.Tm SL1344 WT and ΔinvG–ΔssrB strains were used (Supplementary Table 1). S.Tm inoculums were grown overnight at 37 °C and 200 rpm in 10 ml of LB medium (10855021, Gibco) with respective antibiotics using 50-ml Mini Bioreactor tubes. After that time, the inoculums were diluted 1:20 in invasion-inducing conditions56 (LB ± respective antibiotics + 0.3 M of NaCl (S/3161/60, Thermo Fisher Scientific), and incubated for 2.5 h (3 h for S.Tm SL1344 due to slower growth) at 37 °C and 250 rpm in 3 ml using 13-ml tubes in tilted position. Following growth, the OD600 values of the cultures were measured and adjusted to desired bacterial concentrations. Approximately 1.5 × 10⁷ CFU (multiplicity of infection ~ 1:60) were added on the apical compartment resuspended in 50 µl of chip medium and incubated for 3 h in the incubator. Then, the apical bacteria were collected by two washes with 100 µl of PBS and either plated on TSA plates or discarded. Gentamicin protection assays were performed by adding fresh chip medium with 200 µg ml−1 of gentamicin (G1397, Sigma-Aldrich) apically and basally for 2 h, after which the concentration of gentamicin was reduced to 10 µg ml−1 and kept until the end of the experiment (total duration indicated as ‘hpi’) preserving the intracellular S.Tm population. Intracellular bacterial numbers were counted after one PBS wash, by collection of the epithelium with tweezers and subsequent lysis in a tube containing 100 µl of 0.5% Triton X-100 (T8787, Sigma-Aldrich). The content was incubated for 15 min and pipetted up and down at 0 min, 7 min and 15 min. A serial dilution of the lysate was plated in TSA plates.
Experiments in the presence of TRM cells were carried out using immune chip medium without primocin (Supplementary Table 1) apically and basally. The same non-labelled S.Tm WT and mutant strains were used for infections. Infections were performed in the presence of 10 µg ml−1 of gentamicin basally to limit bacterial breach into the basal reservoir and direct S.Tm–TRM cell contact.
Small-molecule treatments of engineered intestines
To investigate the effect of oxidative stress on S.Tm intracellular replication, the small-molecule inhibitors ML385 (target NRF2, 20 µM; HY-100523, MedChemExpress), ASP-8731 (target BACH1, 20 µM; 4265, Tocris), IKE (target SLC7A11, 10 µM; S8877, Selleckchem), RSL3 (target GPX4, 2 µM; SML2234-5MG, Sigma-Aldrich) and the reactive oxygen species scavengers Fer-1 (15 µM donor 1 and 20 µM donor 2; S7243, Selleckchem) and liproxstatin-1 hydrochloride (3 µM donor 1 and 4 µM donor 2; 6113, R&D Systems) were added apically and basally at the start of the gentamicin treatment and kept for 24 h. DMSO was added to control samples apically and basally.
For investigation of TCR-dependent and TCR-independent IFNγ induction pathways, EpCAM–TCB (Roche) and small-molecule inhibitors were added to the basal reservoirs 4 h before S.Tm infection of the immunocompetent barriers: BIRB 796 (target p38 MAPK, 100 nM; 5989, Tocris); idelalisib 100 nM (target PI3K; 7631, Tocris); and LCK-5-IN (target LCK, 100 nM; HY-180888, MedChemExpress). To assess the effects of bacterial components, LPS (100 ng ml−1; L3024-5MG, Sigma-Aldrich) and flagellin (50 ng ml−1; tlrl-epstfla-5, InvivoGen) were introduced into the lumen of the immunocompetent barriers. These treatments were performed in parallel with S.Tm-infected epithelia, which served as infected controls, and were sustained until the end point of the experiment.
Secreted cytokine analysis of engineered intestines
To analyse the cytokines in the supernatant of the engineered intestines, 100 µl supernatant was collected from both basal reservoirs per engineered intestine and pooled afterwards. Supernatants were quickly centrifuged to remove cell debris and frozen at −20 °C, followed by a transfer to −80 °C until further processing.
Legendplex cytokine analysis
Assessment of the cytokines was performed using a custom-designed LEGENDplex panel (CXCL10, IL-8, sFas, BioLegend). Controls, standards and beads were prepared following the manufacturer’s instructions. Samples were not diluted. In brief, 25 µl of the samples were mixed with 25 µl assay buffer and 25 µl mixed beads. The 25 µl diluted standard was mixed with 25 µl assay buffer and 25 µl mixed beads. Both samples and standard mixtures were dispensed in a V-bottom plate. Afterwards, samples were incubated for 2 h at room temperature on a shaker at 800 rpm. Samples were centrifuged at 500g for 2 min followed by removal of the supernatant. Samples were washed with 200 µl 1X wash buffer per well, followed by addition of 25 µl detection antibodies and incubation for 1 h at room temperature on a shaker at 800 rpm. Next, without washing, SA-PE was added and incubated for 30 min at room temperature on a shaker at 800 rpm. Samples were centrifuged at 500g for 2 min followed by removal of the supernatant to remove excess antibodies. Finally, 150 µl of 1X wash buffer was added before acquisition on Cytek Aurora with the 5 L configuration (Cytek) following the recommended experimental setup. To obtain absolute cytokine concentrations, the raw data were processed and analysed using the software provided by the manufacturer (LEGENDplex data analysis software, v2024-06-15, BioLegend).
Meso Scale Diagnostics cytokine analysis
Analyte concentrations were determined using a custom U-PLEX Immuno-Oncology Human Biomarker Group 1 Assay (Meso Scale Diagnostics (MSD)). The assay was performed according to the manufacturer’s protocol. In brief, U-PLEX plates were prepared by incubating linkers with their corresponding biotinylated capture antibodies for 30 min at room temperature, followed by overnight coating at 4 °C. Controls were reconstituted in assay diluent and standards were prepared via a sevenfold dilution; samples were diluted 1:5. Plates were washed, and either 25 µl of standard or 10 µl of sample (brought to a total volume of 50 µl with diluent) was added to each well. Plates were incubated for 2 h at room temperature with orbital shaking (500 rpm). Following a wash step, 50 µl of SULFO-TAG detection antibody solution was added per well and incubated for 2 h at room temperature (500 rpm). After a final wash, 150 µl of MSD GOLD read buffer was added, and the plates were immediately read using a MESO QuickPlex SQ 120 (or MESO Sector S 600) imager. Absolute cytokine concentrations were calculated using the MSD Discovery Workbench software (v4.0.13), accounting for the sample dilution. Samples under the limit of detection were set to 0.
Eve Technologies Corporation
Assessment of secreted cytokines from S.Tm WT and ΔinvG–ΔssaV strains was performed with the human cytokine 71-plex Discovery assay by the supplier. Samples below the limit of detection were not considered for analysis.
Confocal microscopy imaging
The following microscopes were used for confocal imaging of the stained and live engineered intestines: (1) Nikon Ti2 microscope with CSU-W1 spinning disk (Yokogawa) equipped with a sCOMS camera (ORCA-Fusion BT, Hamamatsu Photonics). Depending on the application, the following objectives were used: ×4 plan apo Lambda OFN25, ×10 plan apo Lambda OFN25 DIC N1, ×20 C S Plan Fluor LWD, ×25 apo LWD 1.1 W DIC N2, ×25 C Sil plan apo Lambda S (Nikon Instruments). The extended depth-of-focus feature of the NIS-Elements software (v5.42.05, Nikon) was used to create focused brightfield and fluorescent images of the engineered intestines. In certain cases, images were further processed and colour adjusted using ImageJ software (2.3.0/1.54f). (2) Leica STELLARIS 8 confocal microscope equipped with 3 power HyD detectors, white light laser (440–790 nm) using ×25 HC FLUOTAR L VISIR X25 objective (Leica Microsystems). Images were either visualized as maximum projection or 3D reconstructed using the Leica Application Suite X (LAS X) software (v4.6.1.27508).
Imaris 3D reconstructions
3D reconstructions of the epithelial layer with integrated TRM cells from the engineered intestinal whole-mount stainings were generated with the Imaris surface function (v9.9.1). Surfaces were rendered based on fluorescence intensities of the iCas9 CDH1–mScarlet3 reporter and CD3, and CD8 antibody stainings.
Timelapse imaging of engineered intestines
EdU pulse-chase imaging
Proliferative cells were labelled using the Click-iT Plus EdU Alexa Fluor 488 Imaging Kit (C10637, Thermo Fisher Scientific) according to the manufacturer’s instructions. Engineered intestinal tissues were cultured as described above for 10 days. On day 10, EdU was added to the standard culture medium at a final concentration of 10 µM, and chips were returned to the incubator. After 2 h, one chip was fixed immediately in 4% PFA. The remaining two chips were washed three times with chip medium (Supplementary Table 1), with 2 h of incubation between washes, and returned to the incubator. One chip was fixed 2 days later, and the final chip was fixed after 4 days post-EdU pulse. After fixation, samples were washed in PBS and processed for EdU staining according to the manufacturer’s protocol. Imaging was performed using a Leica STELLARIS 8 confocal microscope. Before immune cell seeding, TRM cells or T cells derived from peripheral blood mononuclear cells (isolation described above) were labelled with CellTrace Far Red (C34572, Invitrogen) following the manufacturer’s instructions. Afterwards, immuno-chips were prepared as described above. Timelapse imaging was performed 7–10 days (where indicated) post-co-culture setup with either a STELLARIS 8 confocal microscope with a ×25 HC FLUOTAR L VISIR X25 objective (Leica Microsystems) or with Nikon Ti2 microscope equipped with CSU-W1 spinning disk (Yokogawa) using with ×25 apo LWD 1.1 W DIC N2 objective (Nikon Instruments). Images on Leica STELLARIS 8 were obtained in bidirectional mode with 1,024 × 1,024 pixels at 600 Hz. Images were acquired with varying Z-stack depth (z-steps, 4 µm). Samples were imaged between 42 and 60 min (where indicated). During imaging, samples were maintained in a microscopy incubation chamber at 37 °C at 5% CO2 (The Box, Life Imaging Services). For live imaging along the crypt–villus axis, engineered intestines were collected from the glass slide and cut in two followed by placing the engineered intestines perpendicularly on top of a glass dish. The engineered intestines were then fixated with a thin glass coverslip to avoid buoyancy due to medium in the dish. After acquisition, maximum-intensity projections were generated for downstream analysis.
Timelapse movies were analysed using CellProfiler. In brief, cells were segmented at each frame with multiotsu, morphological parameters were extracted and segmented cells were tracked over time using LAP algorithm with the following parameters: number of standard deviations for search radius = 80, search radius limits = 3–80 pixels, gap closing cost = 2, split alternative cost = 1, merge alternative cost = 1, mitosis alternative = 1, maximum gap displacement = 100 pixel, maximum split score = 10, maximum merge score = 5, maximal temporal gap = 6 and maximum mitosis distance = 40. The output per cell was analysed using KNIME (v5.2). The means and standard deviation of morphological features per track over time were calculated. The standard deviation of morphological features over time is a measure of the dynamism of cells as they use amoeboid motility. In addition, track lifetime and track total distance were calculated. Tracks with less than five frames were discarded.
Timelapse imaging of S.Tm intracellular replication was performed at 37 °C at 5% CO2 conditions with a Nikon Ti2 microscope equipped with CSU-W1 spinning disk (Yokogawa) using ×25 apo LWD 1.1 W DIC N2 objective (Nikon Instruments). Images were processed using ImageJ software (2.3.0/1.54f) and NIS-Elements software (Nikon).
Whole-mount staining
For fixed whole-mount staining and imaging, engineered intestines were washed once with 1X DPBS before fixation with 4% PFA in the chip slide. After 1 h of fixation at room temperature, the engineered intestines were washed three times with 1X DPBS. Engineered intestines were either stained in situ or collected using a biopsy puncher (3 mm in diameter) and transferred into a 24-well plate. Next, samples were permeabilized with 0.2% Triton X-100 (T8787, Sigma-Aldrich) in 1X DPBS for 2 h at room temperature on an orbital rocker at 50 rpm. Permeabilization was followed by a blocking step with blocking buffer (10% donkey serum (S30-M, Sigma-Aldrich) and 0.01% Triton X-100 in DPBS 1X) for 4 h at room temperature on an orbital rocker or 16 h at 4 °C. Primary antibodies (Supplementary Table 1) were applied and incubated overnight at 4 °C on an orbital rocker. Afterwards, samples were washed three times for 1 h each at room temperature with 1X DBPS on an orbital rocker. Anti-species secondary antibodies (Supplementary Table 1), DAPI (1 µg ml−1; 62249, Thermo Scientific) and phalloidin (Alexa Fluor 568 phalloidin A12380; Alexa Fluor 488 phalloidin A12379; Alexa Fluor 647 phalloidin A30107, Thermo Fisher Scientific) were incubated for 4 h at room temperature or 16 h at 4 °C on an orbital rocker, covering the sample with aluminum foil. Samples were washed three times for 1 h each with DPBS on an orbital rocker before imaging.
FFPE embedding of engineered intestines and primary intestinal tissue
Regular embedding workflow
For engineered tissue, samples were washed once with 1X DPBS before fixation with 4% PFA in the chip slide. After 2 h of fixation at room temperature, the engineered intestines were washed three times before using a biopsy puncher (3 mm in diameter) to detach the ECM and tissue. In parallel, the engineered intestines histomold, specifically designed to facilitate co-planar embedding of up to 50 engineered intestines, was prepared as previously described8. In brief, liquid histogel was dispensed into the chip histomold and allowed to polymerize for 20 min at 4 °C. Following polymerization, the histoarray was demoulded. Engineered intestines were then transferred with a thin tweezer into the slits of the histoarray. After careful glueing of the engineered intestines in the wells of the histoarray (see Harter et al.8), the histoarray was completely filled and distributed into biopsy cassettes. Samples were dehydrated overnight using a vacuum filter processor (HistoCore PEARL, Leica). The following day, samples were embedded in liquid paraffin.
For primary intestinal tissue, samples were washed three times in 1X DPBS and fixed in 4% PFA at room temperature. Fixation was performed for 24 h, although reduced to 3 h for smaller specimens to prevent over-fixation.
Embedding workflow to retain luminal content
The basal compartments of the engineered intestines were washed once with 1X DPBS before fixation with 4% PFA. The apical reservoir was neither washed nor fixed to preserve the integrity of the luminal content. After 2 h of fixation at room temperature, the engineered intestines were washed three more times only in the basal compartment. Next, the bottom glass of the chip slide was detached by applying mechanical pressure and the matrix was punched from the bottom of the hydrogel in upwards direction, keeping the epithelium and luminal content. The punched sample was then carefully covered with 8 µl of TeloCol-6 type I collagen solution (5225-50 ml, Advanced Biomatrix) neutralized according to the manufacturer’s instructions. Finally, the sample was incubated for 15 min at 37 °C before the transfer to the slits of the histoarray, as described before.
Samples were dehydrated using a graded ethanol series as previously described8. In brief, tissues were held in 10% neutral buffered formalin for 5 min, followed by sequential dehydration steps: two washes in 70% ethanol (30 min each), one wash in 80% ethanol (1 h), and two washes in 96% ethanol (30 min each). Next, two steps of two 1-h incubations in 100% ethanol were performed, followed by two 45-min xylene baths. Finally, samples were held in paraffin until regular formalin-fixed, paraffin-embedded (FFPE) setting.
Microtome sectioning
FFPE blocks were, unless otherwise specified, sectioned at a thickness of 3.5 µm and transferred on Superfrost Ultra Plus Gold Adhesion Slides. Slides were incubated in a slide oven overnight at 37 °C.
H&E and AlcianBlue– PAS staining and imaging
H&E staining was executed in a fully automated manner following the standard protocol on a Ventana HE600 stainer (Roche Tissue Diagnostics). AlcianBlue–PAS staining was performed fully automated using the AlcianBlue for PAS (860-003, Ventana) and PAS staining (860-014, Ventana) kits on the Ventana Benchmark (Roche Tissue Diagnostics). In brief, after three cycles of deparaffinization, slides were washed and 200 µl of PAS AlcianBlue incubated for 16 min at 37 °C. Wash was repeated, and 200 µl of PAS periodic acid was applied for 4 min, before another wash and 12 min of PAS Schiffs staining. Next, slides were washed again and 200 µl PAS neutralizer was added and incubated for 4 min. Finally, slides were washed with 100 µl before counterstaining the slide with 200 µl of PAS haematoxylin for 8 min. Afterwards, slides were coverslipped as indicated in the manufacturer’s instructions. H&E-stained, IHC and AlcianBlue–PAS-stained slides were imaged with a brightfield whole-slide scanner at ×40 (Hamamatsu, NanoZoomer, S360; pixel size of 0.23 µm per pixel) and viewed in NDP-view2 (v2.9.29).
IHC staining
As previously described52, IHC staining of FFPE slides was performed using a Ventana Discovery Ultra automated tissue stainer (Roche Tissue Diagnostics). The slides were baked for 8 min at 60 °C, followed by a deparaffinization cycle for 8 min at 69 °C (deparaffinization cycle repeated three times). Heat-induced antigen retrieval was performed with Tris-EDTA buffer (pH 7.8, CC1, 950-227, Ventana) at 95 °C for a total of 40 min. Depending on the host species of secondary antibody, the slide was incubated with either Discovery goat Ig block (760-6008, Ventana) or 10% donkey serum for 32 min at 37 °C followed by application of Discovery inhibitor (760-4840, Ventana) for 8 min. Afterwards, primary antibodies were applied (diluted in Discovery antibody diluent, 760-108, Ventana; for specific concentrations and incubation times, see Supplementary Table 1). Primary antibodies were detected using anti-species secondary antibodies conjugated with horseradish peroxidase (HRP; OmniMap anti-rabbit HRP (prediluted), 760-4311, Ventana; OmniMap anti-mouse HRP (prediluted), 760-4310, Ventana; OmniMap anti-rat HRP (prediluted), 760-4310, Ventana; and OmniMap anti-goat HRP, 760-4647, Ventana) for 16 min and visualized by conversion of 3,3′-diaminobenizidine (DAB; Discovery ChromoMap DAB kit, 760-159, Ventana). Samples were counterstained with haematoxylin (Haematoxylin II, 790-2208, Ventana) and blueing reagent (760-2037, Ventana). After dehydration with a standard series of alcohol (75%, 95%, 100% and 100% v/v; CAS64-17-5, Roche) followed by 100% xylol baths (444240050, ACROS Organoids), slides were coverslipped in the RCM7000 coverslipper (MEDITE) using a standard histology glue (00811-EX, Pertex). Slides were dried for at least 2 h before imaging.
FFPE-based mIF
As previously described52, opal mIF staining of FFPE slides was performed using a Ventana Discovery Ultra automated tissue stainer (Roche Tissue Diagnostics). The slides were baked for 8 min at 60 °C, followed by a deparaffinization cycle for 8 min at 69 °C (deparaffinization cycle repeated three times). Heat-induced antigen retrieval was performed with Tris-EDTA buffer (pH 7.8, CC1, 950-227, Ventana) at 95 °C for a total of 40 min. Depending on the host species of secondary antibody, the slide was incubated with either Discovery goat Ig block (760-6008, Ventana) or 10% donkey serum for 32 min at 37 °C followed by application of Discovery inhibitor (760-4840, Ventana) for 8 min. Afterwards, primary antibodies were dispensed onto the slide (diluted in Discovery antibody diluent, 760-108, Ventana; for specific concentrations and incubation times, see Supplementary Table 1). Primary antibodies were detected using anti-species secondary antibodies conjugated with HRP (see above for catalogue numbers) for 16 min. Next, the corresponding opal dye (opal 480 FP150001KT, opal 520 FP1487001KT, opal 570 FP1488001KT, opal 620 FP1495001KT, opal 690 FP1497001KT and opal 780 FP1501001KT, Akoya Biosciences) were applied, previously prepared following the manufacturer’s instructions. After each application of the primary antibody, followed by the corresponding secondary antibody and opal dye (with increasing fluorophore excitation wavelength), an antibody neutralization and denaturation step was applied to remove residual antibodies and HRP, before starting the staining cycle again with the Discovery inhibitor blocking step. Finally, samples were counterstained with DAPI (Roche). When used, fluorescein-labelled Jacalin (FL-1151-5, Vector Laboratories) was integrated into the mIF staining protocol by swapping it with the 520 opal dye and always applied last in the staining protocol.
FFPE-based mIF imaging
As previously described52, opal mIF stainings were imaged and digitized using multispectral imaging of the Vectra Polaris (Perkin Elmer) using the MOTiF technology at ×20 magnification for all seven opal dyes (opal 480–780) and DAPI. Slides were imaged in a batch manner to ensure identical imaging settings and cross-comparability within each experiment for subsequent image analysis. Unmixing of channels and processing of images were performed with PhenoChart (v1.0.12) and inForm (v2.4). Images were processed as .qptiff tiles and fused in HALO (v3.6.4134.396, Indica Labs). A pixel resolution of 0.5 µm per pixel was used.
High-resolution opal mIF images were obtained using a STELLARIS 8 microscope (Leica) with a water-immersion objective (HC FLUOTAR L VISIR ×25/0.95 NA WATER). A white-light laser (440–790 nm) was used to image all opal dyes. Channel signals were acquired sequentially to reduce cross-bleeding. Images were obtained in bidirectional mode with 1,024 × 1,024 pixels (pixel size of 384.56 × 384.56 nm2) or 2,048 × 2,048 pixels (pixel size of 273.8 × 273.38 nm2). Images were either visualized as maximum projection or 3D reconstructed using the Leica Application Suite X (LAS X) software (v4.6.1.27508).
Image analysis of FFPE-based mIF
Image analysis of opal mIF images was performed with HALO (v3.6.4134.396, Indica Labs) and HALO AI (v3.6.4134, Indica Labs). Sample annotation was either manually performed or by deploying the TMA module in HALO. For detection and annotation of the engineered intestines, a RandomForest (v2) classifier was used to distinguish organoids from background (for example, matrix; minimum object size more than 1,000 µm). Following validation, engineered intestines were handled as individual regions of interest (ROIs) and quantification was executed per ROI. The RandomForest (v2) classifier was integrated in the Area Quantification FL (v2.3.4) modules and used to quantify positive marker staining against either overall size of each individual object or normalized to the DAPI+ area of the object (as indicated in the figure legends) as well as for quantification of intensities. The HighPlex FL (v4.2.14) module was used to perform nuclear segmentation based on DAPI+ cells, assisted by HALO AI’s integrated ‘AI default nuclear segmentation type’) for phenotype analysis. The FISH-IF (v2.2.5) module was used to perform DAPI-based nuclear segmentation and identification of cells positive for single intracellular bacteria. Specific cell phenotypes were determined by colocalization of the respective markers of interest with the DAPI+ nuclei (including the cytoplasm radius (1.25 µm) and nuclear signals, depending on the marker of interest). By integrating the RandomForest (v2) or DenseNet (v2) classifier in the HighPlex analysis module, for example, localization of the T cells in the matrix or epithelium, was determined.
Assessment of the spatial patterning was performed by manually annotating the crypts and the top epithelial layer along the E-cadherin+ signal as separate ROIs. The basal side of the top epithelial layer served as the ROI border to the crypt underneath. Cell quantification was then performed within the separate annotations per engineered intestine using the Highplex FL module. Similarly, quantification of the thickness of mucus was performed by manually outlining two lines within the same annotation layer: one along the apical side of the E-cadherin+ epithelium of the top epithelial layer (excluding the crypt depth), and a second line along the lumen-facing top layer of the Jacalin+ mucus.
Positive controls on primary matched or non-matched primary intestinal tissue were included in every staining. In case of some experiments, negative controls were co-embedded within the same histoarray by experimental design, easing unbiased threshold adjustment and detection of potential unspecific antibody binding (for example, the epithelium-only control served as the negative control for immune markers; different intestinal regions within one FFPE block).
Brightfield image analysis
Quantification of the number of viable crypts per engineered intestine was performed with a RandomForest classifier (v2) in HALO (v3.6.4134.396, Indica Labs). Dozens of viable intestinal crypts from different donors were manually annotated using brightfield images of the engineered intestines acquired with the ×2 objective of the Leica Dmi1 inverted microscope (11526227, Leica Microsystems). After brief verification, the algorithm was deployed to detect the number of viable crypts per engineered intestine. All brightfield images were acquired with the Leica Dmi1 inverted microscope with ×2, ×4 and ×10 objectives.
Statistical analysis
Statistical analysis was carried out with GraphPad Prism (v10.6.1; GraphPad software). The number of donors is indicated as ‘d = x’, whereas the number of independent engineered intestines within each donor is referred to as ‘n = x’ in the respective figure legend. The number of repeated independent experiments is indicated as ‘e = x’. Data normality was evaluated with Shapiro–Wilk normality test and Q–Q plots. When comparing two sets of data, paired or unpaired two-tailed t-tests were carried out, including Welch’s correction when the standard deviation determined not identical between the groups by a F-test. In case the data were not normally distributed, Mann–Whitney sum-rank tests were performed. For comparisons involving more than two datasets and multiple variables, we performed one-way and two-way ANOVA, including Tukey’s, Dunnett’s or Šídák’s multiple comparisons test comparisons when comparing to a control condition. Nested one-way ANOVA was performed when d < 3, comparing the data across the number of independent engineered intestines (n). A Kruskal–Wallis test with Dunn’s multiple comparison test was performed instead of one-way ANOVA when the data did not follow normal distribution. Data were visualized with their mean and standard deviation, with the exact P values highlighting the statistical significance in the respective figure legend.
Single-cell dissociation of the engineered epithelium for flow cytometry, FACS, scRNA-seq and scMultiome
Before dissociation, surfaces were cleaned with RNase AWAY Decontamination Reagent (10328011, Invitrogen) and all tubes were coated with a coating solution containing HBSS −Ca2+/−Mg2+ (14175095, Gibco) + 1% BSA (130-091-376, Miltenyi Biotec) at 4 °C for at least 15 min. Multiple engineered intestines were pooled for each scRNA-seq and scMultiome, as indicated in the figure legends. Intestinal monolayers were detached from the matrix, collected and transferred to DNA LoBind 1.5-ml tubes (22431021, Eppendorf) with 1 ml of coating solution using forceps. In the case of the scMultiome experiment, where the epithelium integrity was compromised, the epithelium and hydrogel matrix were apically punched using a 3-mm puncher and transferred to a 1.5-ml tube. The punched hydrogel was dissolved by incubating the mix with 1 ml of collagenase type I (100 U ml−1; 17100017, Gibco) in Advanced DMEM/F12 for 15 min at 37 °C, following three washing steps in coating solution to clean the presence of collagenase in the sample and remove the digested hydrogel. Pooled and cleaned monolayers were pipetted up and down 50 times to mechanically disrupt the monolayers into smaller fragments. The single-cell dissociation was performed using the Neural Tissue Dissociation Kit (P) (130-092-628, Miltenyi Biotec). In brief, the samples were centrifuged at 400g for 5 min at 4 °C. The supernatant was removed and the samples were incubated with 1 ml of the enzymeP Mix 1 at 37 °C for a total of 15 min, homogenizing the sample every 5 min by pipetting up and down a total of 50 times with a P1000 tip. After the first incubation, 30 µl of enzyme A Mix2 was added to the sample and incubated for 10 min, with homogenization steps every 5 min and inspection of the suspension under a brightfield microscope. The single-cell suspension was filtered through a PluriStrainer Mini 40 µm (43-10040-40, Pluriselect), previously coated with coating solution, into new 1.5-ml DNA LoBind tubes and centrifuged at 450g for 5 min at 4 °C.
For scRNA-seq or scMultiome experiments, the pellets were washed a total of three times with coating solution at 450g for 5 min at 4 °C. Next, the samples were counted using the Countless 3 FL (AMQAF2000, Invitrogen) and adjusted to the desired concentrations for multiplexing, nuclei isolation or loading on the Chromium X (10X Genomics).
For flow cytometry, FACS and Imagestream experiments, the pellets were washed 1× in DPBS before incubation with eBioscience Fixable Viability Dye eFluor 780 (1:2,000; 65-0865-14, Thermo Scientific) + TruStain FcX (1:200; 422301, BioLegend) in DPBS for 5 min at 4 °C in dark conditions. Next, the samples were spinned down, resuspended in FACS buffer (DPBS supplemented with 2 mM EDTA and 2% FBS), and incubated with PE-EpCAM (1:100; 324206, BioLegend) for 5 min at 4 °C in dark conditions. Single stained and unstained controls were prepared in parallel for compensation. After FACS, the sorted cells were centrifuged, resuspended in FACS buffer and counted before loading on the Chromium X.
Flow cytometry and FACS of S.TmGFP-infected cells
Cell suspensions were centrifuged at 400g for 5 min at 4 °C before filtering through 70-µm strainers. For flow cytometric quantification of S.TmGFP-infected cells, fully stained, single stained and unstained samples were resuspended in 250 µl of FACS buffer and analysed using a five-laser Cytek Aurora spectral flow cytometer. Spectral unmixing with autofluorescence extraction was performed using Cytek Spectroflo CS software, and quantification of GFP+ cell fractions was performed in FlowJo (v10; BD Biosciences).
For FACS, fully stained, single stained and unstained samples were resuspended in 150 µl of FACS buffer. Bulk GFP+ and GFP− populations were isolated using a five-laser Cytek Aurora CS spectral cell sorter equipped with a 100-µm nozzle. Spectral unmixing with autofluorescence extraction was performed using Cytek Spectroflo CS software. Target cell populations were collected into low protein-binding 1.5-ml microcentrifuge tubes (Eppendorf). Next, the cells were centrifuged, resuspended in FACS buffer and counted for scRNA-seq on the Chromium X.
For single-cell total RNA-seq (VASA-seq), single cells were index sorted using a five-laser BD FACSAria Fusion with a 100-µm nozzle into individual wells of a 384-well plate filled with lysis buffer (Single Cell Discoveries). Cells were grouped and sorted by GFP level (GFP−, GFPlo, GFPint and GFPhi) to ensure equal representation in the final dataset of each group. Following sorting, plates were immediately stored at −80 °C until library preparation. Additional cells were also sorted into a lysis buffer containing 0.5% Triton X-100 (T8787, Sigma-Aldrich) for CFU counting within the same experiment.
Validation of S.Tm internalization by imaging flow cytometry
Sorted GFP+ and GFP− cells were concentrated by centrifugation and resuspended in 25 µl of FACS buffer for analysis using a four-laser Cytek Amnis ImagestremX MKII dual CCD camera imaging flow cytometer. The 488-nm and 642-nm excitation lasers were set to a power of 10 mW and 150 mW, respectively, and data were acquired using the ×60 objective. Brightfield images were collected in channels 1 and 9, whereas fluorescence signals for GFP, EpCAM-PE and eFluor-780 were detected in channels 2, 3 and 12, respectively.
ImageStream data were analysed using IDEAS (v6.4.9.0). For each dataset, a compensation matrix was generated using the single-colour controls and the software compensation wizard, and applied to the relevant dataset. Events were gated to only keep contrasted, unclipped, EpCAM+GFP+ images of single host cells. The IDEAS internalization tool (GFP) was used to filter for host cells displaying intracellular GFP signal from the analysis and to quantify the prevalence of bacterial internalization. To perform spot counting in host cells, another filtering step to discard unfocused GFP signal was performed. With this filtering in place, we could start performing GFP spot counting using a series of machine learning classifiers. This was performed using IDEAS machine learning functionality. First, we manually selected two mutually exclusive populations of cells: 25 cells displaying a single GFP colony, 25 cells showing 2 or more than 2 colonies. A first machine learning classifier was trained on these two populations, and subsequently used to classify cells in two categories: ‘one colony’ and ‘more than one colony’. From the more-than-one-colony pool of events, the same strategy was used to train a second machine learning model on two mutually exclusive populations: 25 cells displaying 2 colonies, and 25 cells displaying more than 2 colonies. The model was run on the more than one colony data to classify cells in two new categories: two colonies versus more than two colonies. The obtained mutually exclusive populations were manually curated to fix misclassification of a few events. Cells belonging to the more-than-two-colonies population were manually classified into further populations: ‘three colonies’ and ‘more than three colonies’. Of note, the features weighting the most in our two machine learning classifiers were related to the area and ellipse-fitting parameters of the GFP signal displayed by the colonies.
Collection of TRM cells for scRNA-seq
After collection of the epithelium using forceps, the remaining matrix and TRM cells were punched using a 3-mm puncher and transferred to a 1.5-ml tube containing warm RPMI supplemented with L-glutamine (1X), 5% FBS, HEPES (1X), DNAse I (40 U ml−1), collagenase D (2 mg ml−1) and trypsin inhibitor (1 mg ml−1). Samples were incubated at 37 °C for 10 min with mechanical dissociation via vigorous pipetting every 3 min. After incubation, the sample was centrifuged at 500g for 2 min at 4 °C and washed with 1 ml of HBSS (−Ca2+ or −Mg2+; 14175095, Gibco) + 1% BSA (130-091-376, Miltenyi Biotec). This step was repeated twice. Before final cell counting, the Dead Cell Removal Kit (130-090-101, Miltenyi Biotec) was used following the manufacturer’s instructions to remove apoptotic cells and then passed through a 40-µm Flowmi filter (BAH136800040, Millipore Sigma). Afterwards, the TRM cells were transferred to a 0.5-ml tube to facilitate visualization and accurate cell counting using the Countless 3 FL before loading into the Chromium X (10X Genomics).
Nuclei isolation for scMultiome
Nuclei isolation was performed based on 10X Genomics demonstrated protocol CG000365 rev C. In brief, single cells were centrifuged for 4 min at 400g and 4 °C. The cell pellet was resuspended in cold lysis buffer (10 mM Tris-HCl pH 7.4, 10 mM NaCl, 3 mM MgCl2, 1% BSA, 1 mM dithiothreitol, 0.1% Tween-20, 0.1% Nonidet P40 substitute, 0.01% digitonin and 1 U µl−1 RNase inhibitor). After 6 min on ice, cold wash buffer was added (10 mM Tris-HCl pH 7.4, 10 mM NaCl, 3 mM MgCl2, 1% BSA, 1 mM dithiothreitol, 0.1% Tween-20 and 1 U µl−1 RNase inhibitor) and nuclei were spun for 5 min at 500g and 4 °C. The pellet was resuspended in cold wash buffer and nuclei were counted with propidium iodide (ViaStain AO/PI, CS2-0106-5ML, Nexcelom Bioscience) using the Countess 3 FL (AMQAF2000, Thermo Fisher Scientific). After spinning, nuclei were resuspended in diluted nuclei buffer (10X Genomics) at recommended concentrations for 10X Genomics scMultiome. The quality of isolated nuclei was evaluated by microscopy with DAPI and brightfield.
scRNA-seq and scMultiome library preparation
Single-cell RNA-seq libraries were generated using 10X Genomics Chromium Next GEM Single Cell 3′ (v3.1) reagents according to user manual CG000315 rev E. For multiplexed scRNA-seq, single-cell suspensions of nine biological samples were individually tagged with 10X Genomics 3′ CellPlex Set A reagents according to the demonstrated protocol CG000391 rev B protocol 1. Equal amounts of tagged cells were pooled together for each sample. Three lanes of Chromium Next GEM Chip G were loaded targeting 30,000 cells per lane. Cell encapsulation and library preparation were performed according to user guide Chromium Next GEM Single Cell 3′ Reagent Kits (v3.1) with Feature Barcode technology for cell multiplexing CG000388 rev C. Single-nucleus multiome was performed using 10X Genomics Chromium Next GEM Single Cell Multiome ATAC + Gene Expression reagents and corresponding user guide CG000338 rev F. Two lanes were loaded per sample targeting 10,000 cells per lane. All single-cell libraries (scRNA, single-nucleus RNA, Multiplex and single-nucleus ATAC) were quantified with Qubit 1X dsDNA HS (Q33231, Thermo Fisher Scientific) and Bioanalyzer High Sensitivity DNA Kit (5067-4626, Agilent Technologies) and were sequenced on the Illumina NovaSeq 6000 and NovaSeq X Plus platforms.
For total single-cell total RNA-seq (VASA-seq), libraries were generated by Single Cell Discoveries, with the inclusion of a depletion step targeting the S.Tm 5S, 16S and 23S rRNAs. Libraries were sequenced aiming for a target coverage of 300,000 raw reads per cell.
Read alignment of single-cell genomic data
We ran Cell Ranger (v8.0.0) multi-pipeline with 10X Genomics References 2024-A (hg38, GENCODE v44) as reference for read alignment, demultiplexing and gene quantification of multiplexed scRNA-seq data; Cell Ranger (v7.1.0) for scRNA-seq data of TRM cells; Cell Ranger (v9.0.1) for scRNA-seq data from FACS-sorted epithelium after infections with S.Tm WT and mutants (hereafter referred as ‘sorted infection dataset’); and Cell Ranger Arc (v2.0.1) with 10X Genomics References 2020-A (hg38, GENCODE v32) for scMultiome data. We then loaded the Cell Ranger and Cell Ranger Arc pipelines filtered count matrix to Seurat (v4.3.0.1)77 and Signac (v1.10.0)78 for further preprocessing.
Preprocessing and cell-type annotation of scRNA-seq data
For the multiplexed scRNA-seq data of engineered epithelium, cells with fewer than 500 or more than 6,000 genes expressed, or total unique molecular identifier (UMI) counts exceeding 30,000, or mitochondrial gene percentage above 25% were removed. For the TRM cell data, we only retained cells with more than 500 genes, UMI counts between 1,000 and e10 and mitochondrial percentage less than 15%. For the epithelial data with and without TRM cell co-culture, we only retained cells with more than 1,000 genes, UMI counts between 3,000 and 50,000 and mitochondrial percentage less than 25%. For the sorted infection dataset, we only retained cells with more than 1,000 genes, less than 30,000 UMI and mitochondrial percentage less than 50%.
For all datasets, raw counts were normalized using the ‘NormalizeData’ function with a scale factor of 10,000. Three thousand highly variable genes (HVGs) were identified using the variance-stabilizing transformation (‘vst’) method. Data were scaled and principal component analysis was performed using these variable features. The first 20 principal components were used as input for ‘FindNeighbors’ and dimensional reduction with UMAP. The resulting graph was used for ‘FindClusters’ with the Louvain algorithm at resolution 1.0.
For the multiplexed data, after inspection of regional marker gene expression, we excluded the potential foregut sample (‘don55’) marked by SOX2 and a sample with mixed ileal and colonic identity (‘IF17ile’, FABP6+ and SATB2+). We then removed ribosomal genes, mitochondrial genes, genes located on sex chromosomes and genes without proper gene symbols to avoid influence of these confounding factors to the integration of this dataset derived from multiple donors and reran the pipelines from normalization to clustering.
Epithelial cell-type annotation was initialized on cluster level based on expression of canonical intestinal cell type and regional markers, including: stem cells (LGR5, OLFM4, SMOC2 and ASCL2), absorptive cells (APOA4, FABP6 and CEACAM7), goblet cells (MUC2 and FCGBP), enteroendocrine cells (CHGA), transit-amplifying cells (MKI67), BEST4+ cells (BEST4), epithelial regional identity markers (SATB2, GATA4, CDX2 and PDX1) and leukocytes (PTPRC). Clusters with similar expression patterns were merged and resulted in a coarse-grained annotation. Differential features between proximal, distal and colonic enterocytes and colonocytes were derived from the top 500 marker genes using the ‘wilcoxauc’ function of the ‘presto’ R package on normalized RNA expression values (Wilcoxon test, logFC > log(1.1), adjusted P < 0.05). Enrichment for ‘BP’ (biological process) and ‘MF’ (molecular function) Gene Ontology was performed with the function enrichGO from the clusterProfiler package. Detected genes were used as background and all terms in the org.Hs.eg.db database were used. The enrichment score for each term was calculated by subtracting the significant −log10-transformed hypergeometric test Benjamini–Hochberg-corrected P value of the region of interest and the average of those from the other two regions. Missing values or not undefined numeric results for one region were set to the minimum of the other two regions for visualization.
Enteroendocrine cells (EECs) subtype annotation was performed following subclustering. Subtype-specific signatures (‘EC’: TPH1; ‘MX’: GHRL and MLN; ‘K’: GIP; ‘L’: PYY and GCG; ‘D’: SST; ‘I’: CCK; and ‘Prog’: NEUROG3) were calculated using the AddModuleScore function in Seurat on normalized RNA expression values. Cells were assigned to the identity with the highest score, provided the score exceeded a minimum threshold (0.1). Cells that did not meet this criteria were categorized as ‘EEC unassigned’.
For the multiplexed data and the sorted infection dataset, which did not resolve a cluster representing distal small intestine stem cells, we extracted stem cells from the continuum to absorptive cells based on summarized expression levels of stem cell marker genes. For the multiplexed data, we selected the top ten genes with the highest correlation with summarized scaled expression of LGR5, SMOC2 and ASCL2 across stem cells and absorptive cells and calculated the stem cell score of each cell by summing the scaled expression of selected genes. We defined cells with stem cell scores higher than the 60th percentile of positive scores as stem cells and others as absorptive cells. To reduce the noise of classification solely based on scores of individual cells, we performed high-resolution clustering (resolution = 5), and defined cells belonging to the high-resolution clusters with more stem cells than absorptive cells were defined as stem cells, regardless of their individual scores. For the sorted infection dataset, we subsetted two initial clusters (resolution = 1 from the whole dataset) with LGR5+ cells. We selected the top five genes with the highest correlation with summarized scaled expression of LGR5 and SMOC2 across stem cells and colonocytes and calculated the stem cell score of each cell by summing the scaled expression of selected genes. We defined cells with stem cell scores higher than the 90th percentile of positive scores as stem cells and others as colonocytes. The distribution of the manually extracted stem cells fits the visual inspection on the LGR5 feature plot. For the colonocyte-subtype annotation in the sorted infection dataset, colonocyte clusters with more than 80% cells from the GFP+ samples were collectively defined as ‘enriched in GFP+’, the colonocyte cluster with less than 0.1% cells from the non-infected sample were defined as ‘depleted in non-infected’, and other colonocyte clusters were defined as ‘shared’.
To resolve the goblet cell heterogeneity in the multiplexed data, we subsetted goblet cells from the entire dataset based on their coarse-grained cell-type annotation. The subset was re-normalized, and variable features were recalculated and reclustered (resolution = 1). We excluded clusters with enriched expression of MKI67 to get non-proliferative goblet cells and performed subclustering. We identified cluster markers using the wilcoxauc function implemented by the presto package and defined significant cluster markers with Wilcoxon rank-sum test Benjamini–Hochberg-adjusted P < 0.05, expressed cell percentage difference (pct_in) > 10%, expression logFC > 0.1.
TRM cell-type annotation was performed on the cluster level. We first annotated epithelial cells (EPCAM+), B cells (CD79B+) and proliferative CD4+ T cells (MKI67+), then annotated non-proliferative T cell subtypes based on mapping to a public adult human intestine tissue immune cell reference with two complementary approaches. We identified cell-type markers of the in vitro and tissue data separately using the wilcoxauc function with cut-off Wilcoxon rank-sum test Benjamini–Hochberg-adjusted P < 0.05, expressed cell percentage difference > 10%, expression logFC > 0.1. We quantified the marker gene overlap significance between in vitro and tissue cell types using −log10-transformed Fisher’s two-sided exact test nominal P value. For each in vitro cell type, we got the top three tissue cell types with the strongest overlap, or the subset of top three if the significance difference between pairs of top three was larger than 10. In parallel, we calculated Spearman correlation between our in vitro and tissue cell types based on the markers defined in both systems. For each in vitro cell type, we got the top three tissue cell types showing the highest transcription program similarity, or the subset of top three if the significance difference between pairs of top three was larger than 0.1. We then annotated the in vitro T cells as the overlap of overlap-based and similarity-based matched tissue cell types. On the basis of further inspection of individual canonical marker gene expression, we manually renamed activated CD4 T, activated CD8 T and MAIT-like CD4 as CD4 TRM, CD8 TRM and CD4 TRMTH17, respectively.
Construction of adult human intestine tissue transcriptome reference
To construct an adult human intestine tissue transcriptome reference, we collected the count matrix and cell-type annotation of epithelial cells from three public adult intestine multi-region scRNA-seq datasets79,80,81. All datasets were processed using Seurat (v4). After merging the datasets, we performed LogNormalize normalization with a scale factor of 10,000. We identified HVGs independently for each dataset using the vst method, selecting 3,000 HVGs per dataset. We then selected integration features across datasets using the SelectIntegrationFeatures function. We ran principal component analysis using the selected integration features and retrieved the top 50 principal components. We integrated the data with Cluster Similarity Spectrum (CSS)82 stratified by sample, and default setting for other parameters. We performed dimension reduction with UMAP, and Louvain clustering based on CSS embeddings using the FindNeighbors and FindClusters functions at a resolution of 1.0. We compared the data without batch effect correction, integration with Harmony or with CSS integration, and chose CSS-integrated results based on visual inspection of canonical cell-type marker gene expression.
To establish a consistent cell-type annotation scheme across datasets, we created a mapping between original annotations and standardized categories. We classified cells into major epithelial lineages: absorptive cells (enterocytes and colonocytes), goblet cells, BEST4+ cells, EECs, follicle-associated epithelium, stem cells, M cells, Paneth cells, secretory progenitors and tuft cells. We further refined these annotations by incorporating regional information. We defined the G2M-phased cells defined by the CellCycleScoring function in Seurat within the clusters with enriched expression of MKI67 as the transit-amplifying cells. Cell-type identities were validated using established marker genes. For rare cell populations (for example, Paneth cells and tuft cells), we calculated expression-based scores using canonical markers (DEFA5 and DEFA6 for Paneth cells; RGS13, AVIL and ALOX5 for tuft cells) and assigned cells based on these scores. To be more specific, we identified the top five positively correlated genes with summarized DEFA5 and DEFA6 scaled expression profiles across epithelium among the 3,000 HVGs as feature genes of Paneth cells. We summed up the scaled expression levels of the selected top five Paneth-associated genes for each cell as the Paneth cell feature score, and defined cells with scores exceeding 97.5th percentile of all positive scores as Paneth cells. We applied a similar procedure to identify tuft cells, with 10 tuft cell feature genes and using 95 percentile as the selection cut-off.
To establish a tissue reference for colonocyte subtype annotation in the Salmonella dataset, we subsetted to non-small intestine transit-amplifying cells, stem cells and colonocytes, integrated the data with CSS and performed subclustering based on the CSS embeddings at resolution = 0.4. We identified cluster markers using the wilcoxauc function in the presto package, with cut-offs adjusted P < 0.05, pct_in > 10 and logFC > 0.1. We selected the top 100 markers ranked by logFC from each cluster and unified them as features for comparison between in vitro and tissue colonic stem cells and colonocytes.
To further reconstruct the differentiation trajectory from stem cells to colonocytes in primary tissues (excluding transit-amplifying cells), we computed a diffusion map using the DiffusionMap function in the destiny package on the CSS space and we defined the rank of the first diffusion component (DC1) as the inferred differentiation pseudotime. We ordered the cells along the pseudotime, partitioned them into 25 bins and calculated the average gene expression of each bin. We calculated the Pearson correlation coefficients between the bin average expression levels and the bin order for each gene. The 50 genes with the strongest positive correlations were selected as pseudotime-positive correlating genes, which show higher expression levels in mature colonocytes, and the 50 genes with the strongest negative correlations as pseudotime-negative correlating genes, which show higher expression levels in stem cells and early colonocytes. We then applied these tissue-derived differentiation-related genes on the sorted infection dataset. We used the AddModuleScore function in Seurat based on normalized RNA expression values of the pseudotime positively and negatively correlating genes separately. A composite differentiation score of the cells in the chip was defined as the difference between the positive and negative module scores. We ordered the colonocytes according to the differentiation score from premature to mature, partitioned them into 25 bins and calculated the average gene expression of each bin. The obtained bin average gene expression profiles are defined as expression profiles along the reconstructed pre-mature-to-mature colonocyte differentiation trajectory.
Preprocessing and cell-type annotation of scMultiome data
To create a unified peak list across samples, we called open chromatin-accessible regions in each sample using MACS2 (v2.2.9.1) with the CallPeaks function and then quantified them with FeatureMatrix in Signac. We only kept regions located on standard chromosomes. We annotated peaks to most nearby genes using the annotatePeak function in ChIPseeker based on the Ensemble (v98) annotation. We only retained cells with ATAC UMI count between 200 and 50,000, RNA UMI count less than 20,000, RNA gene number between 500 and 5,000, mitochondrial percentage less than 50%, nucleosome signal (calculated by NucleosomeSignal) less than 1, transcription start site enrichment score (calculated by TSSEnrichment) less than 1 and hg38 genome blacklist ratio less than 0.5%. We ran the same pipeline of scRNA-seq data from read count normalization to dimension reduction and clustering as described in the previous section (‘Preprocessing and cell-type annotation of scRNA-seq data’). For the scATAC-seq data, we performed term frequency-inverse document frequency normalization on read counts using the RunTFIDF function. We defined the regions with over 1% detection rate as top features and RunSVD based on the top features. We projected cells into two-dimension UMAP embeddings and FindNeighbors based on top 2–50 latent semantic indexing.
We performed major epithelial cell-type annotation on RNA cluster level based on canonical cell-type marker expression. We subsetted to colonic stem cell and colonocyte clusters, calculated the Spearman correlation coefficients between in vitro and tissue stem cell to colonocyte clusters using the in vitro-expressed colonic stem cell and colonocyte feature genes defined in the tissue reference. We performed hierarchical clustering on the in vitro clusters based on the similarity profiles and classified them into stem cells and four colonocyte subtypes indicating differential maturity accordingly. Colonocyte clusters with mostly exclusive presence in the Salmonella-infected sample were defined as infection-specific colonocyte clusters. We transferred RNA-level cell-type annotations to ATAC data, and merged subtypes that could not be clearly resolved by ATAC data as annotations on the ATAC level.
Identification of differential features between conditions in the scMultiome and TRM co-culture scRNA-seq dataset
We performed differential analysis for co-clustered S.Tm infection and control cells in each cluster of stem cells, colonocytes and goblet cells, which have sufficient cell numbers for robust estimation. For infection-specific clusters, which have less than 20 control cells in the clusters, we first identified matched control sample cells for each infected sample cell using get.knnx of the FNN package with k = 1 in the top 20 principal component space. We identified DEGs between matched control and infected cells using the wilcoxauc function by the presto package, with cut-offs adjusted P < 0.05, pct_in > 10 and logFC > 0.1. We applied the same procedure to identify DEGs in the epithelium induced by TRM cell co-culture except that we did not need to use the k-nearest neighbour search approach to get matched control cells as there was no condition-specific cluster.
To identify DARs between Salmonella-infected and control conditions, we implemented a statistical framework based on linear regression modelling of binarized chromatin accessibility data, with sequencing depth (UMI counts) as covariate. Specifically, for each open chromatin region i, we fitted:
- Null model: glm(e ~ UMIcounts, family = binomial)
- Full model: glm(e ~ UMIcounts + condition, family = binomial)
where e represents the binarized accessibility state vector for region i across all cells. We applied a Chi-squared test comparing the two models using ANOVA. Regions were considered differentially accessible if they had Benjamini–Hochberg-adjusted P < 0.05 and showed at least a 0.5% difference in the proportion of cells with the region accessible between Salmonella-infected and control conditions.
Gene regulatory network construction and TFBS motif enrichment
We reconstructed the gene regulatory networks from the scMultiome data along the stem-cell-to-coloncyte trajectory and each of the stem cell, colonocyte and goblet cell types shared by both control and infection conditions using Pando83 separately. We used the infection-induced DEGs and 5,000 HVGs of each data as input HVGs for Pando. We constrained our candidate regulatory regions to be either conserved in mammals (defined in phastConsElements20Mammals.UCSC.hg38 provided by Pando) or overlapped with ENCODE regions (defined in SCREEN.ccRE.UCSC.hg38 provided by Pando), and showing significantly correlated profiles with HVGs as output by LinkPeaks in Signac at the default distance threshold of 500 kb. We ran find_motifs and used the Pando-provided transcription factor-binding site (TFBS) motif database compiled from JASPAR and CIS-BP as reference for Pando to identify TFBS in candidate regulatory regions. We ran the infer_grn function with a Gaussian generalized linear model (model = ‘glm’) to infer regulatory coefficients from log-normalized transcript counts and binarized peak counts summarized to SLM algorithm-defined ATAC clusters (resolution = 10). We identified transcription factor–target gene modules using the find_modules function with default settings. We combined the modules from different datasets as inferred transcription factor–target pairs.
For visualization, we selected the condition-dependent DEGs with the top 500 absolute value of expression log-transformed fold change between conditions and the union set of the top three-correlated Pando-predicted transcription factors of each selected DEGs. We calculated pairwise Pearson correlation coefficients of expression profiles across cell types and conditions between selected genes, reduced the dimension of obtained correlation matrix to 20 principal components using prcomp_irlba in the irlba package and further projected genes to two-dimension embeddings using umap in the uwot package with the obtained principal components as input.
We ran the AddMotifs function in Signac to add the TFBS motifs information on our detected open chromatin regions and obtained a motif occurrence matrix. To identify TFBS motifs over-represented in open chromatin regions with increased accessibility upon infection in each cell type, we ran FindMotifs in Signac on the top 200 upregulated accessible regions, with 30,000 open chromatin regions with matched overall GC content retrieved by the MatchRegionStats function as background.
DEG identification in sorted infection dataset
We defined three comparisons to characterize the luminal effects: (1) ΔSPI-1/2 non-invaded (ΔSPI-1/2Out, GFP−) versus non-infected, (2) WT non-invaded (WTOut, GFP−) versus non-infected, and (3) WTOut versus ΔSPI-1/2Out; and three for intracellular effects: (1) WT invaded (WTIn, GFP+) versus WTOut, (2) ΔsteE invaded (ΔsteEIn, GFP+) versus WTIn, and (3) ΔSPI-2In versus WTIn. We subsetted to colonocytes. Genes detected in at least 50 colonocytes were retained, excluding features with Ensembl-style identifiers beginning with ‘ENSG’. Pairwise comparisons were conducted between predefined experimental conditions within each colonocyte cluster. Comparisons were performed only when at least 20 cells were available in at least one condition. When one of the conditions contained fewer than 20 cells, we supplemented with cells from other clusters of the same condition that were defined as nearest neighbours of the other condition, using get.knnx of the FNN package with k = 1 based on Euclidean distance in the top 20 principal component space. Differential expression testing was performed using the wilcoxauc function of the presto R package on normalized RNA expression values. We identified DEGs between conditions per cluster using the wilcoxauc function by the presto package, with cut-offs adjusted P < 0.05, pct_in > 10 and logFC > 0.1.
We then pooled genes defined as significant DEGs in at least one comparison in at least one cluster as the union set of condition DEGs. We then calculated the colonocyte average expression levels of each condition. We calculated the expression difference between WTOut and non-infected—namely, diff_WT_vs_NI, where positive values indicate upregulation in WTOut versus non-infected—and between WTIn and WTOut—namely, diff_WT_GFP_vs_WT, where positive values indicate upregulation in WTIn versus WTOut. We ranked the gene according to diff_WT_vs_NI, took the top 50 genes as feature genes and used the AddModuleScore function to calculate the luminal effect gene module score, and applied the same procedure for diff_WT_GFP_vs_WT values for intracellular effect gene module score.
CellChat analysis of epithelial–immune cell interactions
We used CellChat (v2)84 to infer intracellular communications between co-cultured intestinal epithelial cells and TRM cells. Normalized expression data were extracted from the epithelium and TRM cell combined Seurat RNA assay, and cell-type labels were used to group cells for interaction analysis. We used the built-in human CellChatDB database as reference for ligand–receptor interactions. To reduce computational cost, we subsetted the expression data to include only signalling genes present in the database. Overexpressed genes and interactions were identified using the identifyOverExpressedGenes and identifyOverExpressedInteractions functions. Communication probabilities were computed using the computeCommunProb function with type = truncatedMean and trim = 0.05. We subsetted to interactions between proximal small intestinal enterocytes and immune cell types, excluding proliferating CD4+ T cells for visualization.
Preprocessing of VASA-seq data
Read alignment, gene expression quantification and cell filtering of the VASA-seq data were performed by Single Cell Discoveries. In brief, raw sequencing data were processed using Cutadapt (v4.9) to remove adapter sequences and homopolymers, followed by Ribodetector (v0.3.1) to filter out ribosomal reads. Processed reads were then aligned to the reference genome using STARsolo (v2.7.11b), with the parameter–soloFeatures set to GeneFull_Ex50pAS. The human reference genome used was GRCh38, ENSEMBL release 103. The S.Tm reference genome was downloaded from EnsemblBacteria Salmonella enterica subsp. enterica serovar Typhimurium str. 14028S str. LT2 14028S (GCA_000022165) release 62. The resulting single-cell-level gene count matrices were used as inputs for downstream analysis in R.
To improve the gene annotation for the S.Tm genome, we performed sequence alignment for the genes in the S.Tm strain 14028S annotation against the S.Tm strain 14028 annotation (GCF_028596185.1_ASM2859618v1). Out of the 1,542 genes with Ensembl-style identifiers beginning with ENSB, 242 were mapped to annotated genes with common names in the S.Tm 14028 annotation by blastn85,86 with more than 90% of sequence similarity.
Cells without GFP signal, UMI count of less than 3,500 or External RNA Controls Consortium (ERCC) counts of less than 450 were excluded. Raw counts were normalized using the NormalizeData function in Seurat with a scale factor of 10,000.
Identification of DEGs associated with the GFP signal state
According to FACS index sorting values, cells with GFP < 500 were defined as GFP−, 500 or more and less than 2,000 as GFPlo, 2,000 or more and 10,000 or less as GFPint, and more than 10,000 as GFPhi. For human genes, only genes detected in at least 10% of cells in at least one GFP signal group were included in the differentially expressed test. For each retained gene, expression was modelled using two nested linear models. The reduced model included log-transformed total UMI counts per cell and the percentage of mitochondrial reads as technical covariates, whereas the full model additionally included the GFP signal group as a factor. The contribution of the GFP signal group was assessed by ANOVA comparing the full and reduced models. Genes with Benjamini–Hochberg-adjusted P < 0.05 were considered differentially expressed. To assign directionality, we calculated the difference in average expression between the GFPhi and GFPlo groups and assigned the directionality accordingly.
For S.Tm, we applied the same differentially expressed test strategy, but only included GFP+ cells for comparison. Given the sparsity of the bacteria transcripts, we reduced the detection rate cut-off to 1%. After further excluding ERCC transcripts and features with Ensembl-style identifiers beginning with ENSB, 3,137 genes were left as input for the differentially expressed test. We used nominal P < 0.05 as the cut-off to get marginally significant bacterial DEG.
Reporting summary
Further information on research design is available in the Nature Portfolio Reporting Summary linked to this article.