 Newshot
Main
Islands are fundamental for studying patterns of biodiversity in time and space1,7. The isolation and limited opportunities for colonization of remote islands have fostered evolutionarily distinct and highly endemic flora and fauna5,8,9. Consequently, islands have long been central to fundamental questions in macroecology, evolution, community ecology and species conservation10. Yet, despite their ecological and evolutionary importance, major gaps remain in our understanding of island colonization, evolution and diversification across animal taxa, especially arthropods.
Insects, the most diverse of all animal groups, remain underrepresented in global biogeographic studies and conservation assessments3. This gap largely reflects logistical and taxonomic challenges of assembling standardized, high-resolution data for insects across geographically and politically fragmented islands, which results in inadequate understanding of species’ distributions11. Consequently, tests of island biogeography theory have disproportionately focused on vertebrates (especially birds) and land vascular plants, and systematic studies across multiple archipelagos remain scarce both for insects and other invertebrates12,13,14 (but see Proios et al.15 for land snails).
Notable global efforts targeting other insect groups do exist, such as the Global Ant Biodiversity Informatics (GABI) database16, as well as efforts motivated by pest and pathogen spread, such as a global checklist of mosquito distributions17, and of patterns of island invasion by beetles18. Comparable progress has been made for Lepidoptera at regional scales, including recent large-scale analyses of butterfly biogeography across tropical Asian islands19. Nevertheless, comprehensive global syntheses—such as those available for plants20—of insect diversity and endemism across island systems are virtually absent.
There are approximately 21,000 described species of bees worldwide21. They have an important role in global ecosystems, pollinating many wild flowering plants22 and crops23. On continents, bees exhibit a bimodal latitudinal diversity distribution, with peak richness in seasonally xeric mid-latitude regions that support ecosystems with a Mediterranean climate (hereafter referred to as Mediterranean-type ecosystems), as well as in adjacent desert and montane habitats2,4,24. This pattern deviates from the latitudinal diversity gradients of most other groups of plants and animals, which usually peak in the tropics25. Although the continental-scale biogeographical and ecological patterns of bees are becoming better understood, how they translate to island systems remains underexplored.
Generalizations about island bee biogeography have hitherto been rather qualitative in nature. For example, Michener2 noted that whereas very small bees might be carried over long distances by winds, wood-nesting bees may have dispersed across oceans via driftwood: a rafting hypothesis supported by quantitative evidence that wood-nesting bees are overrepresented in island faunas26, Michener also suggested Polynesian transport by seafarers for certain wood-nesting bee taxa that reached some of the most remote oceanic archipelagos, such as the Hawaiian islands. Consequently, bees detected by the even the first European voyages of discovery cannot be assumed to be native.
Recent phylogenetic evidence indicates that several bee lineages colonized new biogeographic regions during the Neogene Period (around 23–2.6 million years ago) via island-hopping, showing how stepping-stone dispersal may have shaped bee composition. For example, the families Apidae, Megachilidae and Halictidae probably colonized Australia via movements from mainland Asia across the Indomalayan Archipelago27. Similar processes have been proposed to explain disjunct distributions in modern day Central America, where ancient archipelago chains acted as stepping stones between North and South America before the continents joined2.
Conversely, disjunct distribution patterns in other bee groups appear to reflect their more limited capacity to disperse and subsequently colonize islands. For example, following the breakup of Gondwana, stingless bees (Apidae, tribe Meliponini) appear to have been unable to cross the substantial marine barriers that appeared, and their present distribution in Indomalaya probably reflects episodes of sea level fluctuation and transient land-bridges, rather than long-distance overwater dispersal28.
These examples indicate the importance of accurately documenting insular bee diversity to achieve a more complete and fine-grained understanding of global bee biogeography and conservation. Yet, despite this need, comprehensive data remain sparse. Only 542 bee species have been assessed for the global International Union for Conservation of Nature (IUCN) Red List, including just 240 species recorded from islands and 68 island endemics. Of these assessed species, 26 are considered threatened, and for many of these, distributional data are not publicly accessible29. The limited representation of island taxa on global conservation lists does not reflect the well-established vulnerability of island biotas: for example, the majority of US federally listed endangered bee species are native Hawaiian endemics30.
Here we present a global assessment of native bee diversity on islands. Specifically, we investigate: (1) global patterns of native bee richness and endemism; (2) the influence of island characteristics (area and isolation), topography (elevation) and climate variables on both native bee richness and endemism; (3) how endemism scales with richness; and (4) the relationship between insular bee diversity and angiosperm richness. We expect the patterns of insular bee richness and endemism to be shaped by area and isolation, as predicted by island biogeography theory7, but also by biotic and climate constraints and associations, including mutualistic relationships with flowering plants22.
By addressing these questions, our analyses fill knowledge gaps, providing a global baseline for investigating the evolutionary and biogeographic history, ecology and vulnerability of island bees, while highlighting priority regions for future research and conservation at both archipelago and single-island scales. More broadly, this baseline enables rigorous tests of major hypotheses in island biogeography and (meta)community assembly1 using this taxonomically diverse, and ecologically and economically important group.
Global distribution of bees on islands
Our final dataset consists of 11,065 unique island-native bee species combinations, representing 4,128 native species across 305 islands (see Methods for details of this classification) (Fig. 1a). Consequently, of the approximately 21,000 bee species described worldwide, our data indicate that 20% occur on islands. Of these, 42% (1,742 species) are restricted exclusively to islands, accounting for around 8% of all described bee species. Although this proportion is lower than that reported for vascular plants, for which 21% of the global flora are island endemic, with 14.5% single-island endemic species (SIEs)9, as well as terrestrial mammals (about 12% single-island endemics31) and rodents specifically (about 17% endemics to islands32), it nevertheless represents a slightly higher contribution of islands to global bee diversity relative to the approximately 5–6% of global landmass represented by islands globally1. Although we focus here on native bee richness, we also recorded introduced species to distinguish genuine native diversity from non-native species accumulation. We identified at least 54 species as introduced on 143 islands, with the western honey bee (Apis mellifera) being by far the most widespread, introduced to 127 islands in our dataset (Extended Data Table 1). Invasion due to anthropogenic drivers is a major threat to insular diversity33, and evidence, at least for A. mellifera, suggests negative effects of invasive bees on native biodiversity on islands (see, for example, ref. 34).
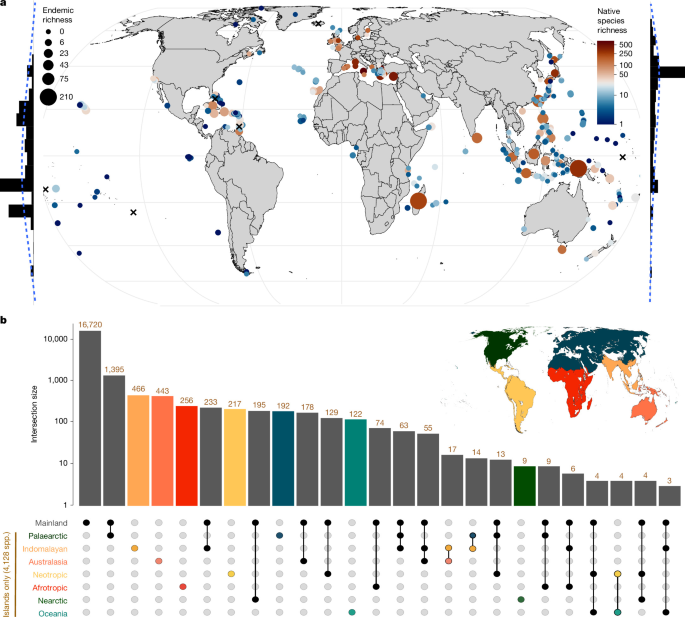
a, Map of global bee diversity on islands (n = 305 islands). Each circle represents an island for which there are recorded native bee species. The colour gradient is log-scaled and indicates the total number of native bee species recorded for each island; the size of the point or circle is proportional to the total number of endemic species found on each island. Endemism is measured as the total number of island (or island group; Methods) endemic species. Left, histogram showing the total number of endemic bee species by latitude. Right, histogram showing the total number of bees on islands by latitude (5° latitude steps; native richness maximum = 3,552 species (35° to 40° N), endemism maximum = 298 species (−10° to −5° N). Note that this pattern does not control for variation in the number and size distribution of islands across latitude (but see Fig. 2). Islands marked with an X have recorded bee species consisting exclusively of non-native species. b, Upset plot showing global distribution of bee species endemic to and shared between islands in different zoogeographical realms62 and the mainland. Of 4,128 native bee species found on islands, 1,742 are recorded only from islands, representing an 8.4% share of global bee diversity that is unique to islands. Each bar shows the number of species unique to that geographic combination. Coloured bars and coloured realm names represent the number of species endemic to islands within that realm. Coloured circles indicate island-only comparisons. Grey bars indicate species that are shared across the island realms or mainland. Island base map in a adapted from ref. 63.
Bee species richness peaks in the Western Palaearctic Realm, whereas endemism (species only found on islands within these realms) is highest on Indomalayan (466 species) and Australasian (443 species) islands (Fig. 1b). Clear differences in island bee richness are also apparent among biomes (Fig. 2), however this pattern is influenced by variation in island area. Species richness was highest in Mediterranean-type biomes: Sicily (approximately 25,000 km2, 636 species), is the island with the highest species richness worldwide and Cyprus (approximately 9,300 km2, 384 species) has the highest species richness of the oceanic islands. The East Aegean islands (approximately 5,000 km2, 589 species) also support large bee faunas, dominated by widespread continental species, reflecting their limited degree of isolation. In contrast to the high richness, endemism on these islands is low, with only Crete (14 species) and Cyprus (23 species) showing comparatively high levels of island endemism. Despite its proximity to the Levant region and its complex origins in tectonic uplift, Cyprus is treated here as an oceanic island owing to its lack of historical land bridge connections to the mainland. The most species-rich Mediterranean-type oceanic island of strictly volcanic origin is Tenerife (2,000 km2, 57 species).
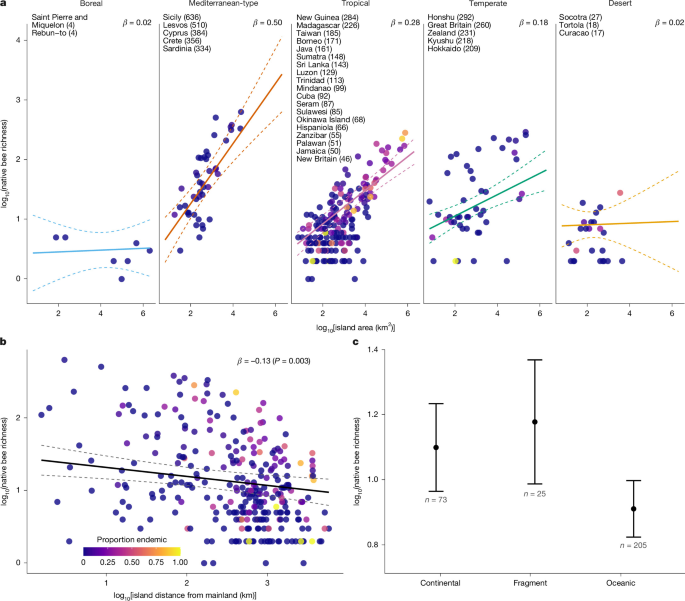
a, Biome-specific ISARs. Solid lines represent fitted mean regression lines from mixed-effects model, with dashed lines indicating 95% confidence intervals. Slopes (β) are reported for each biome. Point colour indicates the proportion of endemic species per island. Labelled islands are the top 10% most species-rich islands within each biome; values in parentheses show total native bee richness. b, Relationship between island isolation (log10 distance to mainland) and native bee species richness. The effect of isolation was evaluated using a two-sided t-test with Satterthwaite’s approximation (β = −0.13, 95% confidence interval [−0.21, −0.04], t(208.0) = −2.96, P = 0.003). The solid line represents the fitted mean regression line from mixed-effects model, with dashed lines indicating 95% confidence intervals. Point colour indicates the proportion of SIEs. c, Predicted bee species richness by island type (continental, fragment or oceanic) from the full mixed-effects model, holding other predictors constant (predictions represent an island of median area (around 445 km2), median isolation (approximately 605 km from mainland) and median sampling coverage (35% after sample-size adjustment, raw median 79%). Circles and lines indicate the model-predicted mean ± 95% confidence intervals, with the number of islands shown below each category.
Tropical islands, by contrast, account for moderate overall native species richness compared with Mediterranean-type islands but markedly higher levels of endemism. New Guinea supports 284 species, of which 210 (73%) are endemic, making it by far the richest island in the Australasian realm. The nearby Maluku Islands archipelago (34,000 km2) hosts 102 species, including 62 endemics (61%), and includes Seram (18,000 km2), the most species-rich tropical, oceanic island for bees (87 species).
In the Neotropics, Hispaniola represents the most species-rich oceanic island, with 66 species. In the Nearctic, the predominantly oceanic California Channel Islands (approximately 910 km2) have a high overall richness (154 species) but low levels of endemism (5%). In the Afrotropics, Madagascar stands out with 226 species, of which 201 (89%) are endemic. Within Oceania, which consists only of oceanic islands, the Hawaiian islands (17,000 km2) are a major hotspot, with all 65 native species of wild bees belonging to a single lineage of Hylaeus (Nesoprosopis), and endemic to the archipelago6. Among other oceanic systems, the Mediterranean-climate Canary Islands (approximately 5,400 km2) host a similarly high number of endemic species (57 out of 128 species), although at a lower proportional level of archipelago endemism (AE) (45%).
Globally, bee richness on islands peaks in the Northern Hemisphere at mid-latitudes (Fig. 1a), mirroring the mid-latitude peak of bee richness observed on mainlands4. This pattern contrasts with the latitudinal diversity gradient seen in other diverse insect groups, such as ants, whose global richness peaks predominantly in the tropics35. The lack of an island-specific bimodal diversity pattern comparable to that found for the mainlands2,4 is probably a consequence of the limited number of Mediterranean-type islands in the Southern Hemisphere. This asymmetry reflects the true distribution of islands globally36, and not simply sampling bias; our global dataset confirms data availability and sufficient coverage across these regions (Fig. 3). This pattern occurs both on continental and oceanic islands, although many of the larger islands within the Mediterranean-type biome were continental or complex in origin. Such environments favour diverse wild bee assemblages through a combination of evolutionary history and ecological conditions. Bees are thought to have originated in the arid environments of Western Gondwana2,27, with limited but predictable rainfall that generates short yet intense blooming periods and a high flowering plant diversity in open habitats2,4,37. These conditions promote temporal synchrony between bee flight periods and floral resources, fostering increased specialization and resource partitioning that reduces competition. This synchrony promotes local speciation and therefore increases richness, allowing these regions to defy the traditional latitudinal diversity gradient2. Our global results support these conclusions but trait-based research focusing on the biome-specific patterns of habitat and dietary specialization of bees on islands are needed to directly test these claims.
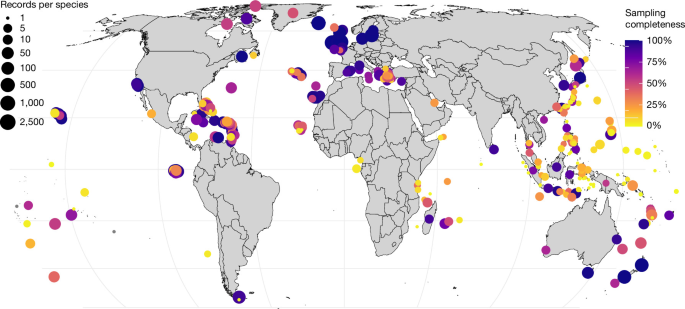
Map shows the geographic distribution of bee sampling effort and completeness across islands worldwide. Circle size represents the average number of individual records (specimens or observations; see Methods, ‘Island bee occurrences and global checklist’) collected per species on each island, with larger circles indicating greater sampling effort. Circle colour indicates sampling completeness measured as the sample-size-adjusted sample coverage (ranging from 0% (yellow) to 100% (purple)). The index combines Chao–Jost sample coverage64 with a weighted-by-sampling effort, based on the total number of occurrence records. Islands with dark purple colouring and large point sizes represent well-sampled regions with high confidence in richness estimates. Yellow and orange points represent under-sampled islands where true diversity is likely to be underestimated. Coverage was calculated using a species/island abundance (count of all occurrences per species per island) matrix of all records to estimate the proportion of the total individuals per island that belong to the observed species, using a non-parametric estimator that accounts for the frequency of rare species (singletons and doubletons). Because coverage can vary by sample size (for example, appearing high when based on very few records), we also applied a sample-size adjustment that scales coverage by the total number of occurrence records. n = 303 islands. Island base map adapted from ref. 63.
Predictors of island bee richness
To test fundamental aspects of MacArthur and Wilson’s theory of island biogeography7 for bee diversity, we used a mixed-effects model with archipelago identity as the random effect. The final best model was selected based on Akaike information criterion corrected for sample sizes (AICc) and included log10-transformed island area in km2 and its interaction with biome, as well as isolation (log10-transformed distance to continental mainland in km) as fixed effects. This model explains 66% of the variance in species richness through fixed effects (area, isolation, island type and biome), and 75% variance when including archipelago identity (conditional R2). This moderate difference in R2 values indicates that native richness is strongly governed by broad biogeographic variables, with some unexplained regional structure.
Island area shows a consistent positive effect on native bee richness but the island species–area relationship (ISAR) slopes differ significantly among biomes (Fig. 2a and Supplementary Table 1). Mediterranean-type biomes showed the strongest species–area response (β = 0.50), which is significantly steeper than that of all other biomes (Supplementary Table 2). Tropical islands exhibit an intermediate effect, (β = 0.28), which is indistinguishable from temperate islands (β = 0.18). By contrast, desert (β = 0.02) and boreal (β = 0.02) islands display flatter slopes, indicating that island size is not a major constraint on bee diversity in these biomes. The impact of biome on species area slopes is observed more clearly on oceanic islands (Extended Data Fig. 1 and Supplementary Table 3), specifically, the ISAR slope for Mediterranean-type islands is significantly greater than for the others. This is not the case for continental islands, where these ISAR slope differences are far less pronounced (Extended Data Fig. 2 and Supplementary Table 3).
Richness decreases with island isolation (β = −0.13, P < 0.003) (Fig. 2b and Supplementary Table 1), corresponding to a reduction of roughly 15% in species richness for each tenfold increase in distance from the mainland. This isolation effect is uniform across all biomes, supporting the fundamental principle that remote islands receive fewer colonists and consequently maintain lower richness as a function of their area7. We also observe a clear influence of island type on richness. Oceanic islands support substantially fewer species than continental (β = −0.19, P = 0.01) and fragment islands (β = −0.27, P = 0.01; Supplementary Table 2), consistent with their lack of past land connections to the mainland, more limited historical species pools and generally younger geological ages, whereas a high proportion of continental shelf islands were connected to the mainland only a few thousand years ago, leading to more ‘harmonic’ biotas1. Alternative models (ΔAICc < 2) additionally include positive relationships with temperature seasonality and annual precipitation. Neither climate variable has a statistically significant effect (Supplementary Table 4).
Our results support the conclusion that ISARs can vary considerably as a function of island geo-environmental properties12,38. Specifically, bees may benefit from biome-specific increases in ecological complexity in Mediterranean-type biomes owing to temporal differences in habitat availability, which can permit increased richness even at small scales, resulting in area having a stronger effect on richness than in tropical or temperate biomes2,4. The finding that Mediterranean-type islands in our models have the steepest ISAR slopes and highest richness values align with the high seasonality of the climate and flowering plant diversity characteristic of Mediterranean climates39, providing diverse nesting sites and floral resources throughout the year.
Although biomes explain considerable variation in richness on islands, they represent broad proxies for climate and habitat diversity. The steep ISAR slope for Mediterranean-type systems suggests that explicitly measuring finer-scale variables, such as resource availability and microhabitat diversity, may provide deeper insights into the mechanisms underlying island bee biogeography. Habitat diversity and environmental heterogeneity, and the potentially associated diversity of mutualist partners, can constitute important predictors of species richness40. In our global models, these factors are likely to be implicitly incorporated when comparing between islands by combining area and biome. However, a single biome classification masks within-island variation as for many large islands with a high elevational range, such as Madagascar, Tenerife, New Guinea or Hawai’i (Big Island), representing the island as a single biome inevitably underestimates its pronounced environmental heterogeneity, which is recognized as a driver of high species diversity and endemism40. Additionally, regional geographic context is an important consideration, as shown by the islands of Lesvos and Cyprus, which show comparatively high species richness values for their area (positive residuals from the Mediterranean-type ISAR; top 5% among Mediterranean-type islands). These islands sit at the border between the European bee fauna and the exceptionally rich western Asian fauna, and the resulting high comparative species richness for their area may be due to this dual species pool from which bees can colonize41.
Sampling effort is uneven across regions, as expected for a global dataset (Fig. 3), with parts of Oceania, Indomalaya and Australasia being comparatively under-sampled. To account for this heterogeneity, we included sampling completeness, measured as the proportion of individuals belonging to observed species and weighted by sample size, as a fixed effect in the native richness model (Supplementary Table 1). Completeness has a positive effect on native bee richness (β = 0.21, P < 0.001; Extended Data Fig. 3). Islands with a greater sampling completeness tend to have higher estimated richness. However, controlling for sampling completeness does not weaken the central results above. The island–biome–area effects remained strong after adjusting for sampling completeness confirming that these patterns were not a result of uneven sampling effort. This indicates that the relationships between area, isolation and richness, and in particular the contrast between mid-latitude richness and high tropical endemism, reflects true ecological differences (Fig. 3). Future efforts to digitize and provide open access to museum collections42,43, conduct targeted expeditions to historically difficult-to-sample islands2,44 and harness citizen science platforms such as iNaturalist45 will be critical to resolving knowledge gaps in island bee diversity, an important task given the projected gaps in global bee diversity46.
Predictors of island bee endemism
To identify the biogeographic and climatic predictors of endemism and assess whether richness can explain endemism patterns, we tested the same linear mixed-effects models as for native richness (Fig. 4a,b). Across islands capable of supporting SIEs (SIE ≥ 1, n = 113), area is associated with increased SIE richness (Fig. 4a and Supplementary Table 5) and this relationship varies significantly with biome, as observed for richness. However, unlike richness, biome-specific area slopes for SIE differs significantly between tropical and temperate islands, with a steeper relationship in tropical islands (Δ = 0.27, P = 0.01), whereas the difference between tropical and Mediterranean-type islands was marginal (Δ = 0.28, P = 0.06; Fig. 4a and Supplementary Table 6). Isolation (log10-transformed distance to nearest landmass larger than 1,000 km2) has only a weak, non-significant positive influence (β = 0.09, P = 0.11; Fig. 4a,b). Temperature seasonality had a significant positive effect on SIE (β = 0.28, P = 0.018), and sampling completeness and elevation range each appeared as significant positive predictors in alternative models within ΔAICc < 2 (Supplementary Table 7). We note that sampling completeness could bias endemism estimates in both directions, overestimating endemism on well-studied islands where the same species have not yet been recorded elsewhere, and underestimating it where undiscovered endemics remain.
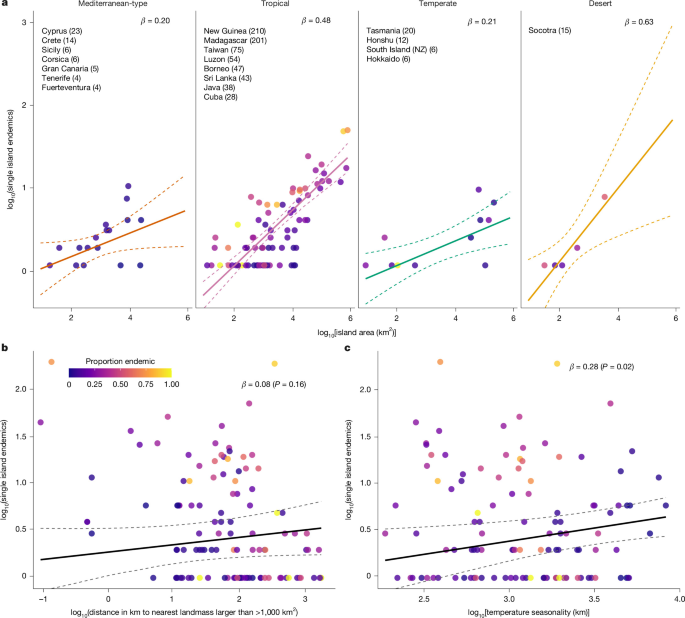
a, Biome-specific relationship between island area and SIE species richness. Slopes (β) are reported for each biome. Solid lines represent fitted mean regression lines from the mixed-effects model, with dashed lines indicating 95% confidence intervals. Point colour indicates the proportion of endemic species per island. Labelled islands are the top 10% most SIE species-rich islands within each biome (values in parentheses show number of SIEs; minimum of 4 species). b, Relationship between island isolation and SIE richness. The solid line represents fitted mean regression line from the mixed-effects model, with dashed lines indicating 95% confidence intervals. The effect of isolation was evaluated using a two-sided t-test with Satterthwaite’s approximation (β = 0.08, 95% confidence interval [−0.03, 0.19], t(113) = 1.41, P = 0.16). The solid line represents the fitted mean regression line from the mixed-effects model, with dashed lines indicating 95% confidence intervals. Circle colours as in a. c, Relationship between temperature seasonality and SIE richness. The solid line represents fitted mean regression line from the mixed-effects model, with dashed lines indicating 95% confidence intervals. The effect of temperature seasonality was evaluated using a two-sided t-test with Satterthwaite’s approximation (β = 0.28, 95% confidence interval [0.05, 0.52], t(113) = 2.40, P = 0.02). The solid line represents the fitted mean regression line from the mixed-effects model, with dashed lines indicating 95% confidence intervals. Circle colours as in a. n = 113 islands. NZ, New Zealand.
The observed patterns are consistent across data subsets but without the interaction of area and biome. On oceanic islands with endemics (n = 69), area remains the strongest predictor (β = 0.32, P < 0.001, R2 = 0.38; Extended Data Fig. 4 and Supplementary Table 5). Among islands rich in SIE (>5% of native richness; n = 96), SIE richness increases with area (β = 0.36, P < 0.001, R2 = 0.66) and increases marginally with sampling completeness (β = 0.16, P = 0.02) (Extended Data Fig. 4 and Supplementary Table 5). These results parallel global patterns of vascular plant endemism on islands47. The mid-latitudinal peak in bee species richness2, seen on islands predominantly in the Northern Hemisphere, does not translate into increased bee endemism. Rather, bee endemism is greatest in the tropics (Extended Data Fig. 5). Patterns for AE are broadly similar. Across islands hosting AEs (n = 217) area was again the main predictor and interacted with biome (Supplementary Table 5). However, AE–area slopes were consistent across tropical, temperate, and Mediterranean-type biomes, with only desert islands showing a significantly lower rate than tropical islands (Δ = 0.35, P = 0.01; Supplementary Table 6). Isolation (distance from mainland) is non-significant (β = −0.04, P = 0.48) and sampling completeness is also included as a significant effect, suggesting that islands with high numbers of AEs are also the best studied (β = 0.14, P = 0.01). Additionally, there is a significant positive effect of elevation (β = 0.18, P = 0.01) suggesting that topographically complex islands support a greater diversity of endemics at the archipelago scale (Extended Data Fig. 6).
A model predicting SIE from overall native richness alone shows a clear correlation (R2 = 0.44) and improved significantly with the inclusion of biome (ΔR2 = 0.15, χ2 = 33.1, P < 0.001; Supplementary Table 8). Although adding the interaction term yields a significant model improvement (ΔR2 = 0.02, χ2 = 8.15, P = 0.04), post hoc pairwise comparisons reveal no significant differences in slopes between biomes after correcting for multiple testing (Supplementary Table 8). This indicates a practically uniform global rate of increasing SIE with richness but with distinct baseline shifts; specifically, Mediterranean-type islands support significantly fewer baseline SIEs than all other biomes (Extended Data Fig. 7). Conversely, for AEs (R2 = 0.55), the full interaction model results in the best fit (ΔR2 = 0.14, χ2 = 72.54, P < 0.001; Extended Data Fig. 7 and Supplementary Table 8), demonstrating that the rate endemic species accumulate with increasing richness is biome-dependent. Pairwise comparisons indicate that the slope for Mediterranean-type biomes (0.42 ± 0.10) is significantly flatter than in desert (0.83 ± 0.12, P = 0.02), tropical (0.96 ± 0.03, P < 0.001) and temperate (0.75 ± 0.06, P = 0.01) biomes, indicating a partial decoupling between richness and AE (Supplementary Table 9). Although Mediterranean-type islands generally support fewer AEs than expected across the richness gradient, the Canary Islands stand out as an exception, showing high AE richness consistent with their high overall richness, although probably enhanced by their relative isolation from the primary Mediterranean source pool (Extended Data Fig. 6). This divergence also highlights that the AE model probably captures more ancient diversification compared with the SIE model48,49. This partial decoupling contrasts with vascular plants, for which the richest islands also tend to host the highest numbers of endemic species, particularly in the case of large tropical islands9. Our results are consistent with previous macroecological studies50, suggesting that the relationship between richness and endemism is not simple and varies among taxa.
Together, these findings reveal that bee endemism is concentrated on large tropical islands and certain oceanic archipelagos rather than in areas of peak species richness globally. New Guinea and Madagascar stand out for supporting both high numbers and high proportions of endemic species. By contrast, certain other island systems, including the Caribbean, the Philippines and the Hawaiian islands, are characterized by only a high proportion of endemics. This apparent divergence between patterns of richness and endemism suggests a distinction between the factors structuring island assembly attributable to colonization and evolutionary diversification in bees. Wet, humid tropical conditions, combined with greater isolation of many oceanic tropical islands, present environmental barriers to bee colonization2. Therefore, successful colonizers are presented with greater ecological opportunity, and this can lead to high in situ diversification1. These patterns suggest distinct evolutionary histories: high endemism in Madagascar probably reflects multiple independent radiations51, whereas in other systems single radiations account for high proportions of endemism, such as Palaeorhiza in New Guinea52, Hylaeus (Nesoprosopis) in the Hawaiian archipelago6 and Lasioglossum (Homalictus) across Pacific islands such as Samoa and Fiji53,54. Conversely, the factors that support high richness in Mediterranean-type islands are likely to include: (1) the adaptation to arid environments; but also (2) frequent arrivals from nearby continental source pools, providing sufficient gene flow to inhibit in situ diversification and thus result in lower endemism55. Globally, bees provide evidence that endemism, and by extension extinction risk, is not inextricably linked to overall species richness, often diverging into regions of high endemism but low richness or high richness with low endemism56.
Bee richness and angiosperm richness
Building on these findings, we additionally examine how plant diversity, as a potential biotic driver, covaries with bee richness, given that bees depend strongly on flowering plants for food and nesting resources22,24. Across the 175 islands for which we have both angiosperm richness data and native bee richness, we observe a positive correlation: angiosperm richness alone explains 49% of variation in bee richness across islands (R2 = 0.49), a relationship that persists after accounting for island area and isolation (β = 0.64, P < 0.001; Fig. 5a and Supplementary Table 10). The slope of the relationship between angiosperm and bee richness is largely consistent across biomes (likelihood ratio test: χ2 = 7.02, P = 0.06). However, temperate islands show a slightly steeper relationship compared with the tropical baseline (β = 0.55, P = 0.015; Fig. 5a and Supplementary Table 10). Additionally, we observe differences from the baseline in total supported bee richness in Mediterranean-type islands: they support 5.6 times more bee species than tropical islands at equivalent plant richness, area and isolation (P < 0.001; Fig. 5b and Supplementary Table 11).
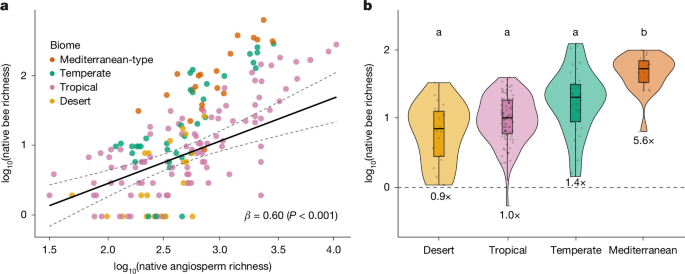
a, Relationship between native angiosperm richness and native bee species richness (n = 175 islands), after accounting for island area and isolation. Points are coloured by biome (desert, tropical, temperate and Mediterranean-type; boreal islands were excluded owing to small sample size (n = 3 islands)). The solid line represents the fitted mean regression from a mixed-effects model including angiosperm richness and biome, with archipelago as a random intercept, with dashed lines indicating 95% confidence intervals. Native angiosperm richness was evaluated using a two-sided t-test with Satterthwaite’s approximation for degrees of freedom (β = 0.60, 95% confidence interval [0.36, 0.84], t(126) = 5.00, P = 1.89 × 10⁻⁶). b, Bee species richness for each island (n = 175 islands) adjusted to the global mean angiosperm richness, area and isolation. Violins show the distribution of adjusted richness within each biome (ordered by increasing median), overlaid with box plots and individual islands (jittered points). Overlaid box plots represent the median (centre line) and 25th and 75th percentiles (box bounds, interquartile range); whiskers extend to the minimum and maximum values within 1.5× the interquartile range. Letters denote groups that differ significantly based on a two-sided post hoc pairwise comparisons of estimated marginal means (false discovery rate (FDR) correction, P < 0.05). Values below box plots show the estimated fold change in adjusted bee richness relative to tropical islands (Supplementary Table 10).
The relationship between angiosperm and bee richness probably reflects a combination of shared biogeographic drivers, such as area and climate, as well as ecological dependence, although the contribution of these factors cannot be separated here. However, the markedly higher baseline bee richness in Mediterranean-type islands at equivalent angiosperm richness is consistent with the hypothesis that temperature seasonality promotes bee specialization57. Seasonal climates can promote bee specialization through temporal resource partitioning while perhumid tropical systems, despite higher plant richness, may present ecological filters that limit bee diversity. Therefore, capturing more detailed information on the complex networks that wild bees form with native plants, and how they vary with island isolation and reduced colonization events, is crucial for developing more complete models of island biodiversity58,59 (reviewed in ref. 1). Yet recent evidence highlights that flowering plant communities may be reliant on bee pollinators when bee richness is comparatively low60. Consequently, we should not expect a simple, predictable relationship between plant and bee richness across islands of differing biomes, isolation and area.
Conclusions and future research
Our study demonstrates that islands account for a substantial share of global bee diversity, including many species that evolved on islands and are endemic. We find that species richness and endemism are partly disconnected, highlighting that these two metrics capture distinct aspects of insular bee diversity. Richness peaks in mid-latitude, Mediterranean-type islands in the Northern Hemisphere, whereas peak endemism occurs in large tropical islands, with these differences being strongest for oceanic islands. These patterns are further supported by the biome-dependent relationship between angiosperm and bee richness, showing that although floral richness is a strong predictor of bee diversity across islands, it does not fully account for the differences in bee richness observed among biomes. Only a small percentage of island bee species have been assessed for extinction risk29,30, and this risk is probably tied to evolutionary distinctiveness rather than richness55. Therefore, our results suggest that conserving bees on islands requires prioritization of areas of unique evolutionary history, from large continental fragments such as Madagascar to remote oceanic archipelagos like the Hawaiian islands, over species richness alone.
Bees are particularly well suited as a model taxon for studying island biogeographical dynamics. They are pivotal pollinators that are closely linked to plant reproduction and ecosystem functioning22, and represent a taxonomically discrete group with an increasing availability of distributional and phylogenetic data. However, much remains to be explored in understanding the mechanisms behind the patterns of colonization and speciation, and the potential for new discoveries. The increasing availability of molecular phylogenies opens up new research avenues for addressing the evolutionary history of bees27. Combined with detailed distribution and trait data61, these resources make it possible to reconstruct historical patterns of colonization, extinction and speciation on islands. With the baseline established here, we lay the foundation for understanding the colonization, diversification and vulnerability of insect diversity on islands more broadly.
Methods
Global checklist of bees on islands
We verified the presence of bees on islands on the basis of information available on Discover Life (https://www.discoverlife.org/) and more detailed and recently updated information, notably, for type locality and collection event data, extracted from source files for that resource21. These expert-vetted lists were filtered for island records and joined with spatial data to align species presence with island identifiers. The checklist data on Discover Life were collected from a variety of sources, including taxonomic revisions, primary species descriptions (including synonyms), verified human observations, and undigitized museum records. To avoid complications from historical boundary changes, species were recorded at the current state or country level. The data are available online as a matrix at the country level, with species-specific details provided for finer geographic scales. For further details on how the checklists were sourced see ref. 4. For islands not clearly associated with a specific country or state/province, additional sources were used to confirm species presence based on the broader political region. We then cross-referenced specimens with island-specific faunal checklists from the published literature; for example, when a species was known only from an archipelago we tried to determine its presence on specific islands within the archipelago. These included studies from Abd al Kuri and Socotra from the Socotra Archipelago65, the Azores including Corvo, Faial, Flores, Graciosa, Pico, Santa Maria, São Jorge, São Miguel and Terceira66, Balearic Islands including Ibiza, Mallorca and Menorca67, Bonaire68, Cabo Verde including Boa Vista, Brava, Sal, Santiago, Santo Antão, São Nicolau and São Vicente69, Cuba and East Grand Bahama70, Fiji52,71, Isla de Juventud72, Juan Fernández Islands73, Madeira Archipelago including Madeira, Porto Santo, and Deserto Grande and Selvagens Islands including Selvagem Grande74 and Madagascar75,76. European island checklists were extracted from the latest checklists for European species from Reverte et al.77 and included Åland islands, Great Britain, Ireland, Iceland, Faroe Islands, Malta, Corsica, Sardinia, Sicily, Crete, Cyprus and Isle of Man. We also included validated (Research Grade) iNaturalist records (up to December 2024) for all islands available from the initial checklists. Although these entries provide valuable data, a degree of taxonomic doubt remains, consequently, they have been labelled as uncertain within the final dataset pending further validation. The checklists for the Greek islands of Corfu and Rhodes were expanded with records from Rhodes78,79, Corfu80 and the personal collection of T. J. Wood. Recent additions to Corsica and Sardinia were also added81, as were the latest checklists of the Canary Islands82. Finally, the bee fauna of Tasmania was significantly adjusted due to recent taxonomic work on the Parasphecodes subgenus83. Names were cleaned using the synonym lists from Orr et al.4 and Dorey et al.84. In some cases, it was not possible to separate archipelago-level data into island records and some archipelagos were therefore retained in the dataset (for example, for the Solomon Islands).
To classify non-native species and calculate final island native species richness, we used Russo85 as a baseline, complemented by existing checklist information and expert opinion from J.S.A. Using the checklists, we calculated three measures of wild bee richness and endemism on islands. They included: (1) native species richness, calculated as the total number of unique native species included in the checklist for each island (or archipelago, as the case may be); (2) single-island endemism, calculated as the total number of species on the checklist only known from that island; (3) AE, calculated as the total number of species found only on that archipelago: this includes all SIEs.
Spatial information on islands and island selection
Using the above checklists, we extracted a spatially explicit database of islands by matching the names from the checklist to those found in the global islands (greater than 1 km2 in area) database of Sayre et al.63. We extracted a vector shapefile of all islands for which we had any wild bee checklist information. In most cases we endeavoured to associate each checklist with a single island entity. In cases where a single name from the bee database is associated with multiple land masses, we extracted all the landmasses for subsequent calculations (for example, Sao Tome and Principe, Saint Vincent and Grenadines, Wallis and Futuna, Antigua and Barbuda, Saint Pierre and Miquelon, Saint Kitts and Nevis, and Solomon Islands). Duplicate island names and spatial mismatches were checked manually. Following this we harmonized the island names with the islands included in the Global Inventory of Floras and Traits (GIFT) database and extracted information on island area, isolation (distance to mainland), island category (oceanic, fragment or continental), archipelago and richness of angiosperms from GIFT (for more detail, see ref. 20). Islands in the GIFT database were categorized by geological origin into oceanic (volcanic islands and atolls), continental shelf (land-bridge), and complex origin/continental fragments. Categorizing islands into three discrete types is a necessary simplification. Certain cases, such as the tectonic uplift of Cyprus or continental fragments such as Rhodes, New Caledonia and Seram that underwent periods of total submergence, represent intermediate states where biological isolation was prioritized over strict geological origin. Specifically, a lack of historical land-bridge connections was used to classify islands as oceanic in type. Of the final 305 islands, there were 207 oceanic islands, 25 fragment islands and 73 continental islands (see Supplementary Table 12 for a full breakdown by biome).
Species distribution data for 350,707 vascular plant species across 1,967 islands and 1,010 mainland regions were taken from Schrader et al.9 and then associated with islands for which we have bee species checklists. These data were originally sourced from the GIFT v.3.2 database using the R package GIFT86 and are taxonomically standardized according to the World Checklist of Vascular Plants9,20. In the few cases where we had bee checklist data for an island or archipelago that did not correspond to an island or archipelago in the GIFT database—for example, data aggregated at archipelago level in one but not the other—we calculated area and isolation directly from the aforementioned spatial map of islands63 and island-specific literature was used to determine island category and archipelago.
We incorporated additional island-level environmental information by overlaying our island shapefile with a spatial global shapefile of ecoregions62, which is an update of the original WWF biogeographical regionalization of Olson et al.87. This dataset provides a globally standardized classification of terrestrial ecoregions, biomes and biogeographic realms, and was selected because it offers consistent, GIS-based borders that explicitly include oceanic islands, allowing reproducible assignment of islands based solely on spatial overlap. Although developed as a general terrestrial biodiversity classification rather than for specific taxa, the underlying climatic, floristic and evolutionary discontinuities that define these realms are expected to also be relevant for bees, whose distributions are closely tied to vegetation structure and climatic regimes. Each island was assigned to a terrestrial biome and biogeographic realm using the intersect function from the R package sf (v1.0-2188). Biome classifications were aggregated into broader categories (boreal, desert, Mediterranean, temperate and tropical) for comparative purposes (Supplementary Table 13) and the final selected biome was the dominant biome found on the island. Realm classifications were one of Afrotropic, Australasia, Indomalaya, Nearctic, Neotropic, Oceania and Palaearctic. This allowed for consistent ecological context across islands and facilitated analyses of native bee richness by biome type and realm.
We also calculated additional isolation metrics by computing the edge-to-edge distance (km) from each study island to the nearest landmass across three size classes (>1 km2, >1,000 km2 and >10,000 km2) and the cumulative surrounding land area (km2) within buffers of 10 km, 100 km and 1,000 km around each island. To do this, we combined our global island database with a global continental layer from rnaturalearth v1.0.189. We tested correlations (r > 0.7) among all isolation variables prior to model fitting (Supplementary Fig. 1). We selected distance to the nearest landmass >1,000 km2 and the total land area within the 10 km buffer to represent isolation, alongside distance to mainland (km), in the final set of variables with which we conducted model selection. Climate data were extracted from bioclimatic rasters from the CHELSA v2.190 with a resolution of 30 arcsec. The variables included annual mean temperature (BIO1), temperature seasonality (BIO4; defined as the standard deviation of monthly mean temperatures multiplied by 100), annual precipitation (BIO12), and precipitation seasonality (BIO15; defined as the coefficient of variation of monthly precipitation). Local elevation metrics were extracted for each island using the elevatr package (v0.99.1)91. Climate variables were averaged for each island and elevation was recorded as the elevational range of each island.
To ensure comparability and ecological and biogeographical relevance, we limited our final dataset to islands with a minimum area of 5 km2 and located at least 1 km from the mainland. These thresholds helped to remove islands with high edge effects, and limited habitat heterogeneity, while ensuring a meaningful biogeographical break from the mainland.
Island bee occurrences and global checklist
To explore global patterns of bee sampling on islands we used the BeeBDC protocol outlined in Dorey et al.84 to extract all global records of bees on islands. Specifically, we downloaded all records of Anthophila from Global Biodiversity Information Facility92, Atlas of Living Australia93 and iDigBio. We corrected synonymous names as above using the synonym lists from Dorey et al.84 and Orr et al.4. As part of the cleaning process the data were subset to only include names of species found in the island checklist dataset, ensuring incorrect records of valid species unlikely to occur on the island were removed. To link bee occurrence records with islands spatially, we reprojected all coordinates to match the island shapefile and performed a spatial join, retaining only records intersecting island polygons defined in the checklist dataset. To ensure consistency between occurrence and checklist data, all species listed in the island checklists were added as supplementary records to the public database, standardizing species richness values across sources. The final dataset comprised 663,189 georeferenced records, which were subsequently used to assess sampling effort and spatial coverage across islands included in the analysis. This dataset was used to calculate a proxy for sampling effort and sampling completeness. To measure sampling completeness we calculated sampling coverage across islands using the Chao & Jost64 method via the coverage function in the iNEXT3D R package (v1.08)94. We used a species/island abundance (count of all occurrences per species per island) matrix of all records to estimate the proportion of the total individuals per island that belong to the observed species, using a non-parametric estimator that accounts for the frequency of rare species (singletons and doubletons). To account for large differences in sampling effort we additionally weighted coverage based on the total number of occurrence records, subsequently referred to as a sample-size-adjusted measure of sampling completeness.
We used the Discover Life global checklist through the BeeBDC tool84 as our baseline source for global bee species richness. To generate an estimate of mainland-only species richness, we excluded all species known to occur on islands by comparing with the above checklists and by removing all island-level records from the global checklist. The global checklist was also used to supplement endemism and island-only species data by filtering out species only recorded on islands from the checklist and cross-referencing with the island dataset. The mainland checklist was also used to test island occurrence patterns to create a binary classification of all species as either occurring or not occurring on islands.
Predictors of native bee richness
We used the island-level checklists to test the key predictors of species richness on islands. We fit a linear mixed-effects model using the lmer function from the lme4 R package (v1.1-37)95, with native species richness as the response variable. We log10-transformed native species richness after adding 1 to all values to accommodate islands with zero native bee species (n = 4) while preserving them in the analysis.
We constructed a full model including the full set of ecological predictors, and then tested all possible model subsets (dredge function, R package MuMIn v1.48.1196). In all models, log10-transformed island area and a measure of island isolation were retained as fixed effects because these variables represent the core predictions of island biogeography theory. We evaluated three alternative isolation metrics in separate full models: log10-transformed distance to the nearest mainland, log10-transformed distance to the nearest landmass exceeding 1,000 km2, and the surrounding land area in a 10 km buffer around the island.
The full model also included biome (5 categories), elevation range (log10), mean annual temperature (scaled), temperature seasonality (log10), annual precipitation (log10), precipitation seasonality (log10), island type (continental, fragment, or oceanic), and sampling completeness (sample-size-adjusted coverage, log10). We also evaluated an Area × Biome interaction and an Isolation × Biome interaction. We assessed collinearity among predictors using variance inflation factors (VIF; R package car, vif function97); mean annual temperature showed high collinearity with biome and other climate variables across all datasets (VIF > 5), and removing it from the full model brought all remaining predictors below this threshold. We therefore excluded mean annual temperature from the full model. Archipelago identity was included as a random intercept in all models to account for spatial non-independence among islands within the same archipelago and to allow baseline species richness to vary among archipelagos98. Models were fit by maximum likelihood and ranked by AICc; models with all three isolation-metric were then pooled into a single ranked set of models. When more than one model was within ΔAICc < 2, we selected the simplest model with the fewest degrees of freedom (Supplementary Table 4). The best-supported model included:
log10(NativeSpeciesRichness)ij = β0 + β1 × log10(Area)ij + β2 × Biomeij + β3 × (log10(Area)ij × Biomeij) + β4 × log10(Isolation)ij + β5 × IslandTypeij + β6 × SamplingCompletenessij + uj + εij
NativeSpeciesRichnessij = number of native bee species observed on island i in archipelago j
Areaij = island area (km2)
Biomeij = biome classification
Isolationij = distance to nearest mainland (km)
IslandTypeij = island type (continental, fragment, oceanic)
SamplingCompletenessij = sample-size-adjusted coverage
β0 = intercept
β1 = effect of log10(area)
β2 = effects of biome
β3 = interaction between log10(area) and biome
β4 = effect of log10(isolation)β5 = effects of island type
β6 = effect of sampling completeness
uj = random intercept for archipelago j
εij = residual error
The final model included the interaction between area and biome, indicating that the effect of area on species richness varies among biomes. Island type and sampling completeness were retained as fixed effects. Two island groups for which coverage could not be calculated were dropped from the final model (Wallis and Futuna, Pitcairn Islands, n = 303). We quantified variance explained by fixed effects alone using marginal R2 and using conditional R2 for variance explained by both fixed and random effects99. To compare species–area relationship slopes among biomes, we extracted biome-specific slopes and their standard errors from the variance–covariance matrix of fixed effects. We then tested for specific differences among biomes using pairwise comparisons of estimated marginal means for intercepts and estimated marginal trends for slopes (FDR correction100) using the emmeans package (v1.11.1)101. Model predictions and confidence intervals were generated using the fixed-effects design matrix and visualized using ggplot2 (v3.5.2)102. Finally, we fit the same best model for only oceanic and only continental and fragment islands, specifically to compare ISAR slopes among biomes of different island types.
Predictors of bee endemism and link to richness
To explore the predictors of endemic species richness and its relationship with total species richness across islands, we used a model selection approach mirroring our richness analysis. We fit a series of linear mixed-effects models using the lmer function from the R package lme4 (v1.1-37)95. Collinearity among predictors was assessed the same way as for richness and mean annual temperature was also removed from all endemism full models.
We focused on islands supporting at least one single-island endemic (SIE ≥ 1; n = 113 islands). In this subset of islands, all biomes are represented apart from boreal, as the boreal islands harboured no endemics. We used the same model fitting procedure as described for the native richness analysis. All models within ΔAICc < 2 are shown in Supplementary Table 7. The best-supported model included:
log10(Endemism)ij = β0 + β1 × log10(Area)ij + β2 × Biomeij + β3 × (log10(Area)ij × Biomeij) + β4 × log10(TemperatureSeasonality)ij + β5 × log10(Isolation)ij + uj + εij
Endemismij = number of single-island endemic bee species observed on island i in archipelago j
Areaij = island area (km2)
Biomeij = biome classification
TemperatureSeasonalityij = temperature seasonality
Isolationij = distance to nearest landmass >1,000 km2
β0 = intercept
β1 = effect of log10(area)
β2 = effects of biome
β3 = interaction between log10(area) and biome
β4 = effect of log10(temperature seasonality)
β5 = effect of log10(isolation)
uj = random intercept for archipelago j
εij = residual error
To assess the generality of endemism patterns, we repeated analyses on three subsets: (1) oceanic islands only (n = 69), where endemism is more probably driven by neo-endemic evolution rather than the retention of land-bridge palaeo-endemics; (2) endemic-rich islands (SIE > 5% of total richness; n = 96), focusing on systems where endemism is well-established. We also repeated all analyses for AEs (species endemic to entire archipelagos; AE ≥ 1; n = 217) to confirm patterns were robust across endemism definitions (Supplementary Tables 5 and 7). The archipelago-level approach captures archipelago-wide diversification processes while revealing which individual islands within archipelagos are endemism hotspots (see, for example, ref. 48). For the SIE ≥ 1 and oceanic island subsets, the variance of the archipelago random effect was estimated at zero; however, it was kept for consistency across all models.
Additionally, to formally test how the relationship between richness and endemism varies across biomes, we compared three nested models for SIEs and AEs:
- (1) where endemism is predicted solely by richness: log10(SIE/AE) ~ log10(Richness) + (1|Archipelago);
where endemism is predicted solely by richness: log10(SIE/AE) ~ log10(Richness) + (1|Archipelago);
- (2) where biome adds information beyond richness: log10(SIE/AE) ~ log10(Richness) + Biome + (1|Archipelago); and
where biome adds information beyond richness: log10(SIE/AE) ~ log10(Richness) + Biome + (1|Archipelago); and
- (3) where the slope of the effect of richness varies by biome: log10(SIE/AE) ~ log10(Richness) × Biome + (1|Archipelago)
where the slope of the effect of richness varies by biome: log10(SIE/AE) ~ log10(Richness) × Biome + (1|Archipelago)
We compared these nested models sequentially using likelihood ratio tests. If including biome as a fixed effect significantly improves model fit, this indicates that islands with similar richness support different baseline levels of endemism depending on biome. If including the interaction between biome and richness improves model fit then the rate at which endemics accumulate with increasing richness also varies across biomes. We then tested for specific differences among biomes using pairwise comparisons of estimated marginal means for intercepts and estimated marginal trends for slopes (FDR correction100) using the emmeans package (V1.11.1)101.
Bee richness versus angiosperm richness
To assess the extent to which bee diversity tracks angiosperm diversity across islands, we fitted a linear regression model with native bee richness as the response variable and native angiosperm richness and its interaction with biome as the predictors. We additionally included both island area and isolation as covariates to account for confounding geographic effects that influence the richness of both angiosperms and bees. Variance inflation factors indicated low multicollinearity among predictors (all VIFs < 2.4), supporting the inclusion of angiosperm richness, island area, and isolation in the same model. We fit the model for the 175 islands for which we had both bee native richness data and reliable angiosperm richness data from the GIFT database20. Archipelago identity was included as a random intercept to account for spatial non-independence of islands within the same archipelago. To include the interaction with biome we removed boreal islands from the analysis as there were too few islands (3) with which to test the interaction.
To (1) compare baseline shifts (intercepts) across biomes against a single baseline and (2) to conduct a likelihood ratio test on the significance of the interaction between biome and angiosperm richness, we additionally fitted a model with and without the angiosperm richness × biome interaction term. The full model with interaction was:
log10(NativeSpeciesRichness)ij = β0 + β1 × log10(AngiospermRichness)ij + β2 × Biomeij + β3 × (log10(AngiospermRichness)ij × Biomeij) + β4 × log10(Area)ij + β5 × log10(Isolation)ij + uj + εij
NativeSpeciesRichnessij = native bee species richness on island i in archipealgo j
AngiospermRichnessij = native angiosperm species richness
Areaij = island area (km2)
Biomeij = biome classification
Isolationij = distance to nearest mainland (km)
β0 = intercept
β1 = effect of log10(angiosperm richness)
β2 = effect of biome
β3 = interaction between log10(angiosperm richness) and biome
β4 = effect of log10(area)
β5 = effect of log10(isolation)
uj = random intercept for archipelago j
εij = residual error
Using the coefficients from this model, we computed an adjusted bee richness for each island by subtracting the centred contributions of angiosperm richness, island area, and isolation from the observed values. This adjustment standardizes the data, showing the bee richness for each island if it had the global average plant richness, land area, and isolation. Finally, we calculated estimated marginal means for each biome using the emmeans package (V1.11.1)101, and performed post hoc pairwise comparisons (FDR correction)100.
All statistical analyses, data manipulation, and visualizations were conducted in R (v4.5.0)103. In addition to the packages already cited; data processing, post hoc tests, and figure formatting were carried out using the following packages: broom.mixed (v0.2.9.6)104, ComplexUpset (v1.3.3)105, corrplot (v0.95)106, cowplot (v1.2.0)107, ggnewscale (v0.5.1)108, ggrepel (v0.9.6)109, ggtext (v0.1.2)110, kableExtra (v1.4.0)111, lmerTest (v3.1-3)112, maps (v3.4.2.1)113, mgcv (v1.9-4)114, multcomp (v1.4-28)115, multcompView (v0.1−10)116, patchwork (v1.3.0)117, performance (v0.13.0)118, scales (v1.4.0)119, scico (v1.5.0)120, tidyverse (v2.0.0)121 and UpSetR (v1.4.1)122.
Reporting summary
Further information on research design is available in the Nature Portfolio Reporting Summary linked to this article.