 Newshot
Main
Uncontrolled lipid peroxidation is integral to ferroptosis5,15. Cancer cells are commonly protected from unrestrained lipid peroxidation and spontaneous ferroptotic cell death by molecular defence systems such as the system xc––glutathione (GSH)–glutathione peroxidase 4 (GPX4) pathway5,16, in which GPX4 is the key enzyme mediating lipid peroxide detoxification. Strategies to promote ferroptosis by blockade of ferroptosis defence systems, such as GPX4 inhibitors, have been considered promising approaches to achieve tumour elimination in patients with difficult-to-treat cancers8,9. Studies using preclinical mouse models have uncovered that effective tumour elimination by ferroptosis-inducing strategies requires anticancer immunity by DCs10 and tumour-infiltrating CD8+ T cells11,12,13. Yet recent findings have suggested that DC-driven anticancer CD8+ T cell immunity is suppressed in ferroptotic tumours8,9,10,17. Emerging evidence has implicated that the unrestrained generation of membrane lipid peroxides in ferroptotic cells can promote the production and release of molecules that may impact immune cell functions18. However, what causes the suppression of DC-mediated anticancer CD8+ T cell immunity in the context of tumour ferroptosis remains largely unclear.
Ferroptosis triggers PGE2 production in cancer cells
Potentially relevant immunoregulatory factors produced by ferroptotic cancer cells are oxylipins, bioactive lipids generated through peroxidation of polyunsaturated fatty acid-containing membrane lipids, a hallmark of ferroptosis15. To assess ferroptosis-induced oxylipin production and identify key factors, we profiled the oxylipin secretome of mouse BRAF(V600E) and NRAS(G12D) melanoma, 4T1 breast cancer and MC38 colorectal cancer cells following RSL3-induced ferroptosis. Across all these cancer cell lines, RSL3-treated (ferroptotic) cells displayed increased production of oxylipins compared with untreated (non-ferroptotic) controls (Fig. 1a). Of note, in all groups, the eicosanoid PGE2 was by far the most abundant oxylipin upregulated by ferroptosis induction (Fig. 1a). Similar to ferroptosis induction by RSL3 (which inhibits selenoproteins beyond GPX4), we observed strong PGE2 production after genetic ablation of the ferroptosis-protective enzyme GPX4, ferroptosis induction using the GPX4 inhibitor ML210 or erastin-mediated inactivation of system xc–-mediated cystine import (Extended Data Fig. 1a–f). Thus, ferroptosis may trigger the production of PGE2 in cancer cells, which is a notable finding given the important role of PGE2 for suppression of anticancer immunity19,20,21.
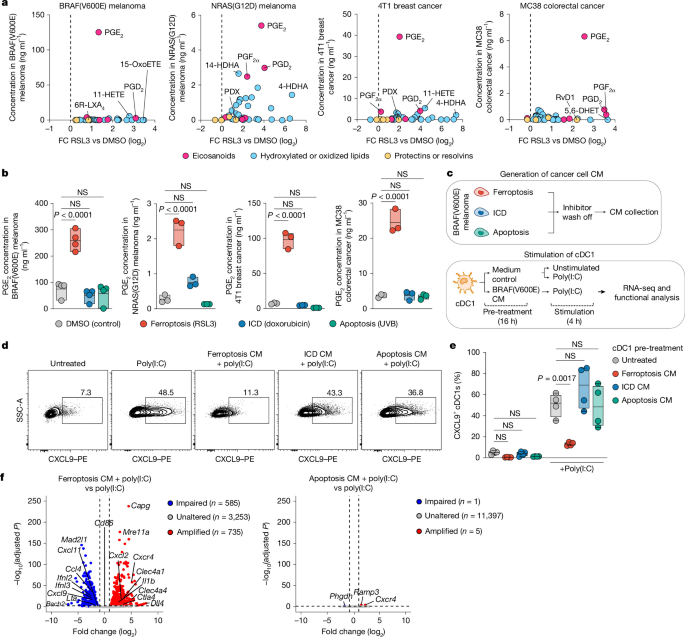
a, Oxylipin profiles for the indicated cancer cell lines after RSL3 treatment. 4-HDHA, 4-hydroxydocosahexaenoic acid; 5,6-DHET, 5,6-dihydroxyeicosatrienoic acid; 6R-LXA4, 6R-lipoxin A4; 11-HETE, 11-hydroxyeicosatetraenoic acid; 15-oxoETE, 15-oxoeicosatetraenoic acid; DMSO, dimethyl sulfoxide; PDX, protectin DX; RvD1, resolvin D1; vs, versus. The vertical dotted line indicates a fold change (FC) (log2) of 0. b, PGE2 production by cancer cell lines after induction of ferroptosis, immunogenic cell death (ICD) or apoptosis. n = 4 samples for BRAF(V600E) melanoma, and n = 3 samples for NRAS(G12D) melanoma, 4T1 breast cancer and MC38 colorectal cancer. NS, not significant. c–f, Functional analyses of cDC1s exposed to dying cancer cell conditioned medium (CM). Experimental design (c). CXCL9 production by cDC1s; the plots show one cDC1 culture representative of n = 4 cultures (d). Quantification of CXCL9+ cDC1s, based on panel d; n = 4 samples (e). Analysis of cDC1s by RNA-seq (n = 4); the volcano plots show the effect of CM from ferroptotic (left) or apoptotic (right) BRAF(V600E) cells on activation-induced cDC1 genes (f). PE, phycoerythrin; RNA-seq, RNA sequencing; SSC-A, side scatter area. Data show mean ± s.e.m. of n = 3 biological replicates (a). In b, the centre line indicates the mean and the bounds show the minimum and maximum values. In e, the centre line indicates the median, the bounds extend from the 25th to the 75th percentile, and the whiskers correspond to he minimum and maximum values. P values are from one-way analysis of variance (ANOVA) with Tukey’s multiple-comparison test (two-sided; b,e). Differentially expressed genes were identified using a two-sided Wald test with Benjamini–Hochberg correction (f).
By contrast, stimulation of ultraviolet B (UVB)-induced apoptosis, doxorubicin-induced immunogenic cell death or necrocide 1 (NC1)-induced necrotic cell death failed to promote PGE2 production (Fig. 1b and Extended Data Fig. 1g). However, PGE2 production was induced in cells undergoing necroptosis (Extended Data Fig. 1h). These findings imply that PGE2 production is selectively induced by as yet unknown molecular events in ferroptotic cells and that these events, at least to some extent, may be shared with necroptotic cells.
Using liproxstatin-1 (Lip-1), we further validated that ferroptotic cancer cells depend on lipid peroxides to produce PGE2 (Extended Data Fig. 2a,b). This was not the case for key effectors of other cell death pathways, such as caspases or receptor-interacting serine–threonine-protein kinase 1 (RIPK1; Extended Data Fig. 2a,b). We extended our analyses to a broader panel of mouse and human cancer cells, including established cell lines, cells from spontaneous mouse cancer models and cells from patients with pancreatic cancer. In all these cells, RSL3-induced ferroptosis triggered markedly increased PGE2 production (Extended Data Fig. 2c–e). Together, these data suggest that ferroptosis promotes aberrant production of PGE2 in mouse and human cancer cells, prompting us to investigate the underlying molecular mechanisms and consequences for anticancer immunity.
PGE2 released by ferroptotic cancer cells causes cDC1 dysfunction
Effective anticancer immunity often depends on cDC1s22,23, which fulfil essential roles in the priming of anticancer CD8+ T cell responses24,25 and effector differentiation and expansion of CD8+ tumour-infiltrating T lymphocytes (TILs)26,27. These cDC1 functions are impacted by immunoregulatory factors derived from dying cancer cells22,23,28; however, how mediators released by ferroptotic cancer cells impact cDC1s and their functions is not known.
To address this issue, we generated cDC1s from bone marrow cells, exposed them to conditioned medium from RSL3-induced, ferroptotic BRAF(V600E) melanoma cells and assessed their functional properties after activation with polyinosinic–polycytidylic acid (poly(I:C); Fig. 1c). The conditioned medium from ferroptotic BRAF(V600E) cells strongly compromised the capacity of cDC1s to produce CXCL9 (Fig. 1d,e and Extended Data Fig. 3a), a chemokine required for cDC1-mediated orchestration of CD8+ TIL responses26,29. Similar results were observed for cDC1 production of the T cell stimulatory cytokine interleukin-12 (IL-12)30 (Extended Data Fig. 3b,c). By contrast, no impairment was observed for cDC1s exposed to conditioned medium from cancer cells undergoing apoptosis or doxorubicin-induced immunogenic cell death (Fig. 1d,e and Extended Data Fig. 3b,c). Impaired CXCL9 production was similarly observed for splenic cDC1s treated with conditioned medium from ferroptotic BRAF(V600E) cells (Extended Data Fig. 3d). These results suggest that factors released by ferroptotic cancer cells disable cDC1s from producing molecules required to promote anticancer CD8+ T cell immunity.
cDC1 functions are controlled by transcriptional programming31,32. We therefore subjected cDC1s activated by poly(I:C) following exposure to ferroptotic or apoptotic BRAF(V600E) cell conditioned medium to transcriptional profiling by RNA sequencing. We found that ferroptotic, but not apoptotic, cancer cell-derived factors induced prominent transcriptional changes in cDC1s (Fig. 1f), including impaired expression of genes encoding stimulatory cytokines (including Ifnb and Ifnl2), T cell-recruiting chemokines (Cxcl9 and Ccl4) and integrins important for T cell activation (Itgal; Fig. 1f). We also confirmed the inhibitory effect on cDC1 cytokine and chemokine production at the protein level (Extended Data Fig. 3e). Of note, we did not detect a defect in upregulation of MHC or costimulatory molecules (Fig. 1f and Supplementary Table 1), implying that ferroptotic cancer cell-derived factors do not prevent cDC1 activation. Of note, many of the genes impaired in cDC1s following exposure to ferroptotic cancer cell-derived factors were shared with a core gene set of PGE2-mediated cDC1 dysfunction (Extended Data Fig. 3f,g and Supplementary Table 1), although genes beyond this set were also impaired. Consistently, gene set enrichment analyses revealed a prominent impairment of PGE2-regulated functional cDC1 genes (Extended Data Fig. 3h), whereas genes associated with migration or antigen processing (that is, molecular programs not regulated by PGE2 signalling in cDC1s19), remained unaffected (Extended Data Fig. 3h). Together, these data suggest that ferroptotic cancer cells promote cDC1 dysfunction and that this is mediated by PGE2.
Ca2+-dependent p38 MAPK signalling drives PGE2 production
Similar to cancer cells, ferroptosis induction caused aberrant PGE2 production in Pfa1 cells (Extended Data Fig. 4a), an established mouse embryonic fibroblast model often used to study the molecular underpinnings of ferroptosis33. This was linked to markedly increased transcript and protein expression of the key PGE2-producing enzyme COX2 (encoded by Ptgs2; Fig. 2a and Extended Data Fig. 4b–d). Lip-1 treatment rescued this effect (Fig. 2a), whereas stimulation of lipid peroxidation by cumene hydroperoxide promoted both Ptgs2 expression and increased PGE2 production in Pfa1 cells (Extended Data Fig. 4e,f). Together, these results point towards a requirement of membrane lipid peroxide generation for PGE2 production through transcriptional regulation of COX2. Using COX inhibitors, we also confirmed that COX activity was required for PGE2 production by ferroptotic Pfa1 cells (Fig. 2b), but dispensable for execution of ferroptotic cell death (Fig. 2c).
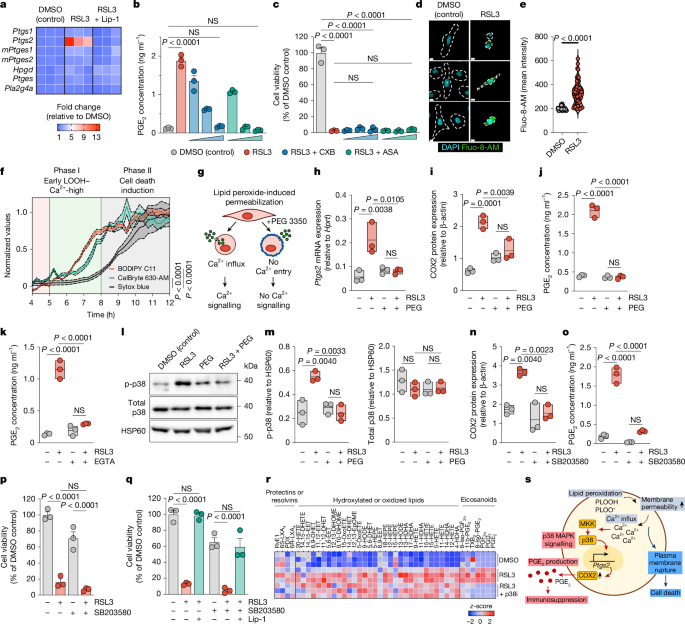
a–r, Molecular analyses of RSL3-induced, ferroptotic Pfa1 cells. Transcript expression of COX–PGE2 pathway enzymes; n = 3 samples (a). mPtges1, microsomal Ptges1. Effect of CXB (1, 10 or 100 nM) or acetylsalicylic acid (ASA) (1, 10 or 100 µM) on PGE2 production (b) and cell viability (c); n = 3 samples. Microscopy analysis of Ca2+ influx (fluo-8-AM) after 8 h (d). Scale bars, 10 µm. The dashed lines indicate cell borders. Quantification of Ca2+ influx, based on panel d; n = 45 cells for DMSO control and n = 60 cells for RSL3 (e). Time-resolved live cell imaging of lipid peroxidation (BODIPY C11), Ca2+ influx (CalBryte 630-AM) and cell death (Sytox blue); n = 4 samples (f). Effect of PEG treatment; n = 3 samples (g–j): experimental design (g); quantification of Ptgs2 mRNA (h) and COX2 protein (i) expression after 8 h; and measurement of PGE2 production (j). Effect of EGTA on PGE2 production; n = 3 samples (k). Representative western blot of p-p38 protein expression after 8 h (l). Quantification of p-p38 and total p38 expression, based on panel l; n = 3 samples (m). Effect of SB203580-mediated p38 MAPK inhibition on COX2 expression after 8 h (n), PGE2 production (o) and cell viability (p); n = 3 samples. Effect of Lip-1 on cell viability (q). Oxylipin profiles of cells treated as indicated; n = 3 samples (r). DHETE, dihydroxyeicosatetraenoic acid; DiHOME, dihydroxyoctadecenoic acid; EET, epoxyeicosatrienoic acid; EpOME, epoxy octadecenoic acid; HETrE, hydroxyeicosatrienoic acid; HODE, hydroxyoctadecadienoic acid; LOOH, lipid hydroperoxide; TXB2, thromboxane B2. s, Schematic illustrating the mechanistic underpinnings of PGE2 production in ferroptotic cancer cells. Data depict mean ± s.e.m. (b,c,p,q). Data are depicted as boxplots (h–k,m–o). Plots show data for one sample of n = 6 samples from two independent experiments (d,f,l). In h–k,m–o, the centre line indicates the mean and the bounds show the minimum and maximum values. P values are from one-way ANOVA with Tukey’s multiple-comparison test (b,c,h–k,m–q) or unpaired Student’s t-tests (e). NS (P ≥ 0.05).
A key event caused by lipid peroxides in ferroptotic cells is the influx of extracellular Ca2+ (ref. 5), which constitutes an early event in pro-ferroptotic cells before the onset of cell death. Consistently, microscopy imaging revealed high intracellular Ca2+ levels in Pfa1 cells early after RSL3-mediated ferroptosis induction (Fig. 2d,e), which was similarly observed for multiple mouse cancer cells (Extended Data Fig. 4g,h). Time-resolved live cell imaging of ferroptotic Pfa1 cells confirmed that Ca2+ influx followed peroxide accumulation, but occurred before the cell death-associated loss of plasma membrane integrity (Fig. 2f). Of note, preventing Ca2+ influx through polyethylene glycol (PEG)-mediated blockade of membrane permeabilization-enabled osmotic molecule exchange5,34,35 (Fig. 2g and Extended Data Fig. 4i,j) abrogated the upregulation of Ptgs2 mRNA (Fig. 2h) and COX2 protein expression (Fig. 2i) in ferroptotic Pfa1 cells, resulting in a loss of PGE2 production (Fig. 2j). We also validated that lipid peroxide generation was only minimally affected by PEG treatment (Extended Data Fig. 4k,l) and that ferroptotic cells become permeable to other small extracellular molecules5, including sodium ions (Na+; Extended Data Fig. 4m–p).
Gain-of-function experiments using ionomycin, which selectively transport extracellular Ca2+ into cells, revealed that Ca2+ influx alone was sufficient to promote COX2 upregulation and PGE2 production across Pfa1, BRAF(V600E) melanoma and MC38 colorectal cancer cells (Extended Data Fig. 4q,r). Thus, although small molecules beyond Ca2+ enter ferroptotic cells, they probably do not contribute substantially to the activation of COX-mediated PGE2 production. Consistently, blockade of Ca2+ influx using the Ca2+ chelator EGTA confirmed the relevance of Ca2+ signalling for PGE2 production in ferroptotic cells (Fig. 2k and Extended Data Fig. 4s,t).
Ca2+ influx can regulate gene expression via p38 MAPK signalling, which requires p38 MAPK activatory phosphorylation (p-p38). Consistently, ferroptotic Pfa1 cells displayed a prominent increase in p-p38 levels (Fig. 2l,m), which was abolished by PEG treatment (Fig. 2l,m). Moreover, treatment with the selective p38 MAPK inhibitor SB203580 abrogated the upregulation of COX2 expression and PGE2 production in ferroptotic Pfa1 cells (Fig. 2n,o), demonstrating the relevance of p38 MAPK signalling for PGE2 production. Of note, the later execution of cell death remained unaffected by p38 MAPK inhibition (Fig. 2p) or blockade of Ca2+ influx (Extended Data Fig. 5a). These results suggest that Ca2+-induced p38 MAPK signalling is not required for ferroptotic cell death. We also confirmed that SB203580 did not induce cell death in non-ferroptotic cells (Extended Data Fig. 5a), and that the death of SB203580-treated ferroptotic Pfa1 cells was rescued by Lip-1 (Fig. 2q).
Oxylipin profiling revealed a selective requirement of p38 MAPK signalling for production of PGE2 and other COX-derived eicosanoids in ferroptotic Pfa1 cells (Fig. 2r), whereas other oxylipins remained largely unaffected. Similar to Pfa1 cells, PEG-mediated inhibition of Ca2+ influx or inhibition of p38 MAPK abolished PGE2 production in ferroptotic cancer cells (Extended Data Fig. 5b–e), demonstrating the relevance of Ca2+-mediated p38 MAPK pathway activation for PGE2 production also in ferroptotic cancer cells. We also confirmed that, in cancer cells, this mechanistic axis is already active in the early phase after ferroptosis induction (Extended Data Fig. 5f–r) and that p38 MAPK signalling is dispensable for the propagation of ferroptotic cell death (Extended Data Fig. 5s–v). Experiments with cells deficient in p38α (the p38 MAPK isoform commonly expressed in cancer cells) further validated that p38 MAPK signalling is required for PGE2 production by ferroptotic cancer cells (Extended Data Fig. 5w,x), but not their cell death execution (Extended Data Fig. 5y). We conclude that Ca2+-mediated activation of p38 MAPK signalling triggers PGE2 production by ferroptotic cells and that this mechanism is not required for ferroptosis-dependent cancer cell death (Fig. 2s). This molecular uncoupling enables to selectively interfere with p38 MAPK pathway activity to impair PGE2 production by ferroptotic cancer cells while preserving ferroptosis-mediated cancer cell elimination.
PGE2–EP2/EP4 signalling mediates cDC1 inhibition
To test whether ferroptotic cancer cells depend on PGE2 to promote cDC1 dysfunction, we induced ferroptosis in COX-deficient Ptgs1/Ptgs2−/− BRAF(V600E) melanoma cells, which cannot produce PGE2 (Extended Data Fig. 6a–c). We then exposed cDC1s to conditioned medium from ferroptotic Ptgs1/Ptgs2−/− or control BRAF(V600E) cells, activated them by poly(I:C) and compared their gene expression profile by RNA sequencing (Fig. 3a). We also included cDC1s exposed to conditioned medium from apoptotic BRAF(V600E) cells, to test possible effects of dying cancer cell-derived factors unrelated to ferroptosis. We observed that PGE2 deficiency in ferroptotic BRAF(V600E) cells prevented cDC1 reprogramming (Fig. 3b) and, consequently, rescued the expression of functional cDC1 genes (for example, Irf8, Ifnl2 and Cxcl9; Fig. 3c). This regain of gene expression was similarly observed in a more detailed analysis of the core functional cDC1 genes selectively suppressed by factors from ferroptotic, but not apoptotic, BRAF(V600E) cells (Fig. 3d).
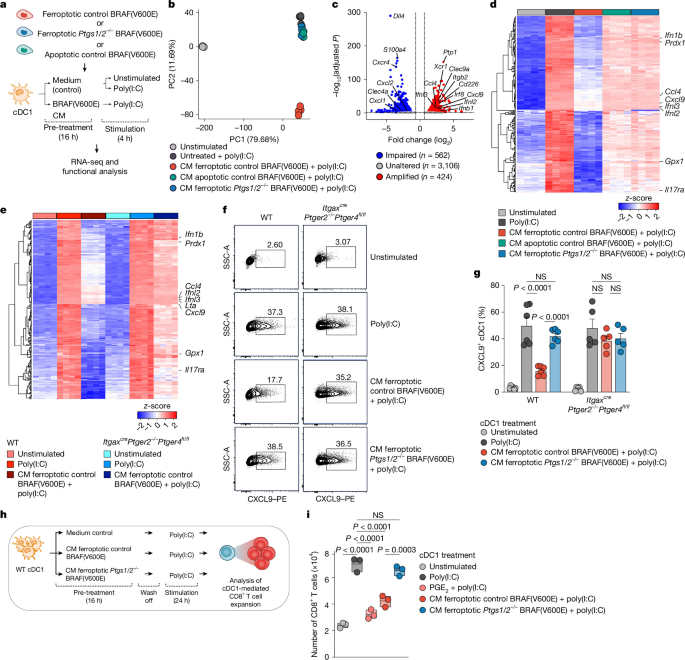
a, Experimental design for panels b–d. b, Principal component (PC) analysis of differentially expressed genes in cDC1s treated as indicated. c, Effect of COX deficiency in ferroptotic BRAF(V600E) cells on gene expression of poly(I:C)-activated cDC1. d, Heatmap showing the expression of core functional cDC1 genes. e–g, Effect of EP2/EP4 deficiency on ferroptotic cancer cell-induced cDC1 dysfunction: heatmap showing the expression of core functional genes in WT or ItgaxcrePtger2−/−Ptger4fl/fl cDC1s treated as indicated (e); flow cytometry plots showing CXCL9 expression, with one of n = 5 samples (f); and quantification of CXCL9+ cDC1s, based on panel f (g; n = 6 samples for WT, and n = 5 samples for ItgaxcrePtger2−/−Ptger4fl/fl). Data show mean ± s.e.m. h,i, Effect of ferroptotic cancer cell-derived CM on cDC1-induced CD8+ T cell expansion: experimental design (h), and quantification of CD8+ T cell expansion (i; n = 3 samples). In i, the centre line indicates the mean and the bounds show the minimum and maximum values. Differentially expressed genes were identified by two-sided Wald test with multiple testing using the Benjamini–Hochberg method (c). P values are from one-way ANOVA with Tukey’s multiple-comparison test (g,i). NS (P ≥ 0.05).
The inhibitory effect of PGE2 on immune cells36, including cDC1s19, is mediated by signalling through the PGE2 receptors EP2 (encoded by Ptger2) and EP4 (encoded by Ptger4). We therefore extended our RNA sequencing analyses to EP2/EP4-deficient cDC1s from ItgaxcrePtger2−/−Ptger4fl/fl mice19,26. Whereas conditioned medium from PGE2-producing ferroptotic control BRAF(V600E) cells compromised the upregulation of activation induced genes in (EP2/EP4-proficient) wildtype (WT) cDC1s, this defect was fully rescued in EP2/EP4-deficient cDC1s (Fig. 3e and Supplementary Table 2). This result demonstrates the relevance of PGE2–EP2/EP4 signalling for ferroptotic cancer cell-mediated impairment of cDC1 functions. In separate experiments, we further validated that CXCL9 and IL-12 production is rescued in both EP2/EP4-deficient cDC1s treated with conditioned medium from ferroptotic BRAF(V600E) cells and cDC1s treated with conditioned medium from (PGE2-deficient) ferroptotic Ptgs1/Ptgs2−/− (BRAF(V600E)) cells (Fig. 3f,g and Extended Data Fig. 6d,e). Using CXCL9 as a functional marker, we also confirmed that PGE2 was similarly required for ferroptotic cancer cell-mediated inhibition of cDC1s activated by stimuli reported to promote cDC1 activation in tumours (Extended Data Fig. 6f,g). In a T cell stimulation assay, we further probed the ability of cDC1s to stimulate CD8+ T cell expansion. This function was similarly rescued in cDC1s exposed to conditioned medium from PGE2-deficient ferroptotic BRAF(V600E) cells (Fig. 3h,i). Using celecoxib (CXB)-mediated blockade of PGE2 production, we also confirmed that other ferroptotic cancer cells depend on PGE2 to inhibit cDC1 function, as determined by CXCL9 staining (Extended Data Fig. 6h,i). Together, these findings suggest that PGE2–EP2/EP4 signalling mediates the impairment of cDC1 functions caused by ferroptotic cancer cells. Moreover, EP2/EP4 deficiency rescues cDC1s from ferroptotic cancer cell-mediated inhibition.
PGE2 from ferroptotic cancer cells impairs anticancer immunity
Our results raised the question whether cDC1s can mount effective CD8+ T cell responses against ferroptotic cancer cells when protected from inhibitory PGE2 signalling. To address this issue, we adoptively transferred CD8+ OT-I T cells, which express a transgenic T cell receptor (TCR) specific for the model antigen ovalbumin (OVA), into WT mice subsequently transplanted with ferroptotic, OVA-expressing control or Ptgs1/Ptgs2−/− BRAF(V600E) cells (Extended Data Fig. 7a). To determine the relevance of EP2/EP4-mediated PGE2 signalling in cDC1, we further included Clec9acrePtger2−/−Ptger4fl/fl mice, which lack EP2 and EP4 in CLEC9A-expressing cDC1. Analyses of OT-I T cell expansion in lymphoid tissues revealed that ferroptotic cancer cell-derived PGE2 impairs the productive generation of anticancer CD8+ T cell responses through PGE2-mediated inhibition of cDC1 functions (Extended Data Fig. 7b–e). Moreover, OT-I T cell expansion was lost in cDC1-deficient Batf3−/− mice challenged with ferroptotic BRAF(V600E)–OVA cells (Extended Data Fig. 7f), confirming the functional relevance of cDC1s for generation of anticancer CD8+ T cell responses.
EP2/EP4 deficiency in cDC1s restores anticancer T cell immunity
To determine whether ferroptotic tumours depend on PGE2 production to restrict cDC1-mediated anticancer CD8+ TIL responses and escape immune control, we analysed the growth of (ferroptotic) Gpx4−/− or (non-ferroptotic) WT MC38 cells transplanted into WT and Clec9acrePtger2−/−Ptger4fl/fl mice (Fig. 4a). By microscopy-based analysis of the ferroptosis marker 4-hydroxynonenal (4-HNE) and COX2 protein, we confirmed cancer cell ferroptosis leading to enhanced COX pathway activity in Gpx4−/−, but not WT, MC38 tumours (Extended Data Fig. 8). In WT mice, tumours formed by Gpx4−/− MC38 cells exhibited progressive tumour growth, which was only minimally slower than WT MC38 cells (Fig. 4b and Extended Data Fig. 9a). These data are consistent with inefficient control of ferroptotic cancers in immunocompetent mice. By contrast, Clec9acrePtger2−/−Ptger4fl/fl mice exhibited improved tumour immune control and fully rejected Gpx4−/− MC38 tumours (Fig. 4b and Extended Data Fig. 9a). By contrast, WT MC38 tumours displayed reduced growth but failed to be eliminated in Clec9acrePtger2−/−Ptger4fl/fl mice (Fig. 4b and Extended Data Fig. 9a). Of note, this pattern was similarly observed for Cd4crePtger2−/−Ptger4fl/fl mice in which T cells lack EP2/EP4 expression (Extended Data Fig. 9b), implying that ferroptotic tumours, in parallel to inhibiting cDC1, depend on PGE2-mediated inhibition of T cells to escape anticancer immunity.
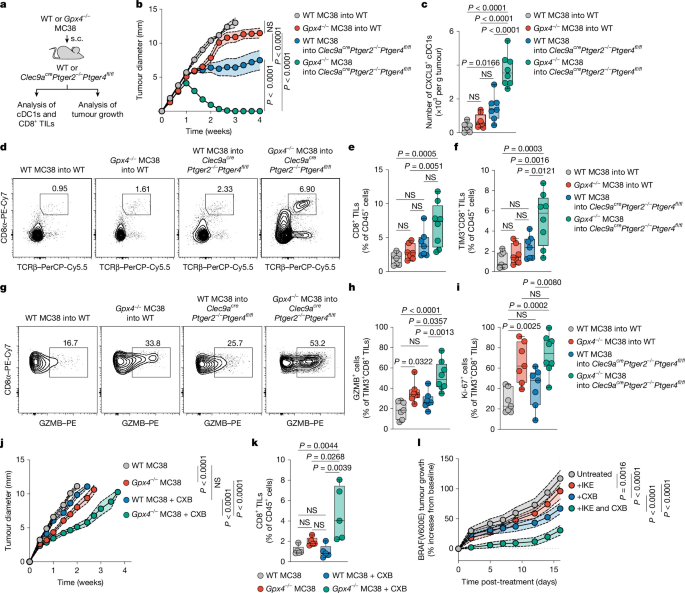
a, Experimental design for panels b–i. s.c., subcutaneous. b, Tumour growth profiles of WT or Gpx4−/− MC38 cells transplanted into WT (n = 12) or Clec9acrePtger2–/–Ptger4fl/fl (n = 9) mice. c, Quantification of intratumoural CXCL9+ cDC1s at day 6 after tumour transplantation (n = 7 for WT MC38 into WT; n = 8 for Gpx4−/− MC38 into WT; n = 7 for WT MC38 into Clec9acrePtger2−/−Ptger4fl/fl; and n = 8 for Gpx4−/− MC38 into Clec9acrePtger2−/−Ptger4fl/fl). d–l, Functional analysis of CD8+ TILs at day 8 after tumour transplantation (n = 7 for WT MC38 into WT, Gpx4−/− MC38 into WT, and WT MC38 into Clec9acrePtger2−/−Ptger4fl/fl; and n = 8 for Gpx4−/− MC38 into Clec9acrePtger2−/−Ptger4fl/fl). CD8+TCRβ+ TIL frequencies (d). Quantification of total CD8+ TILs (e). Frequencies of TIM3+CD8+ effector TILs (f). GZMB expression in TIM3+CD8+ TILs (g). Quantification of GZMB+TIM3+ TILs based on panel g (h). Ki-67 expression in TIM-3+CD8+ TILs (i). j–l, WT or Gpx4−/− MC38 cells were transplanted into WT mice treated or not with CXB: tumour growth profiles (j; n = 10), and quantification of CD8+ TILs at day 8 after tumour transplantation (k; n = 5). WT mice were transplanted with BRAF(V600E) cells and treated with CXB or IKE from day 5 after tumour transplantation (l). Tumour growth was analysed relative to baseline tumour size at day 5 (n = 20 for untreated; n = 20 for +IKE; n = 22 for +CXB; and n = 20 for +IKE and CXB). Data were pooled from two independent experiments (b,c,e,f,h–l). Plots show data for one sample representative of n = 7 samples (d,g). Data are presented as mean ± s.e.m. (b,j,l). In c,e,f,h,i,k, the centre line indicates the median, the bounds extend from the 25th to the 75th percentile, and the whiskers correspond to he minimum and maximum values. P values are from two-way ANOVA with Bonferroni’s correction for multiple testing (b,j,l) or one-way ANOVA with Tukey’s multiple-comparison test (c,e,f,h,i,k).
We also genetically ablated p38α in Gpx4−/− MC38 cells, which disabled ferroptosis-induced PGE2 production (Extended Data Fig. 9c) and resulted in enhanced tumour growth control in WT mice (Extended Data Fig. 9d), consistent with the idea that p38 MAPK-induced PGE2 production by ferroptotic tumours promotes immune escape.
Of note, the efficient elimination of Gpx4−/− MC38 tumours in Clec9acrePtger2−/−Ptger4fl/fl mice was linked to markedly increased intratumoural numbers of CXCL9-producing cDC1s (Fig. 4c), indicating their enhanced anticancer activity. By contrast, the numbers of CXCL9-producing cDC1s remained low in Gpx4−/− MC38 tumours in WT mice, and in WT MC38 tumours in both WT and Clec9acrePtger2−/−Ptger4fl/fl mice (Fig. 4c). Confocal immunofluorescence microscopy further revealed a prominent increase of interactive clusters between cDC1s and CD8+ TILs in Gpx4−/− MC38 tumours in Clec9acrePtger2−/−Ptger4fl/fl mice (Extended Data Fig. 9e,f), pointing towards more productive cDC1-mediated instruction of anticancer CD8+ TIL responses19,26. Consistently, CD8+ TILs displayed substantially enhanced expansion in Gpx4−/− MC38 tumours in Clec9acrePtger2−/−Ptger4fl/fl mice compared with all other groups (Fig. 4d,e).
cDC1s fulfil an essential role in anticancer immunity by driving the expansion and effector differentiation of TCF1+CD8+ TILs (often referred to as ‘stem-like’ T cells) into TIM3+(TCF1−)CD8+ TILs with cytotoxic effector functions26. In many tumours, this process is critical for protective anticancer immunity37,38,39,40. The CD8+ TILs selectively accumulating in Gpx4−/− MC38 tumours in Clec9acrePtger2−/−Ptger4fl/fl mice predominantly encompassed TIM3+(TCF1−)CD8+ TILs (Fig. 4f and Extended Data Fig. 10a) with high PD-1 and CXCR6 expression (Extended Data Fig. 10a), indicating more productive effector differentiation20,40. Consistently, TIM3+ TILs in Gpx4−/− MC38 tumours in Clec9acrePtger2−/−Ptger4fl/fl mice showed markedly increased frequencies of cells expressing the cytotoxic effector molecule granzyme B (GZMB) compared with all other groups (Fig. 4g,h). We also confirmed that the numbers of stem-like TCF1+ TILs were comparable across all groups (Extended Data Fig. 10b), consistent with their unaffected tumour infiltration.
Of note, the few TIM3+CD8+ TILs detectable in Gpx4−/− MC38 tumours in WT mice, similar to Gpx4−/− MC38 tumours in Clec9acrePtger2−/−Ptger4fl/fl mice, displayed high expression of the proliferation marker Ki-67 (Fig. 4i and Extended Data Fig. 10c). This result indicates that CD8+ TILs, at least to some degree, mount proliferative responses also in ferroptotic tumours in the presence of intact PGE2 signalling on cDC1s. However, profiling of CD8+ TILs at later stages demonstrated that, in Gpx4−/− tumours in WT mice, these responses are not sustained over time, both in terms of Ki-67 expression, GZMB expression and CD8+ TIL expansion (Extended Data Fig. 10d–f). By contrast, CD8+ TIL responses in Clec9acrePtger2−/−Ptger4fl/fl mice in Gpx4−/− MC38 tumours further increased over time (Extended Data Fig. 10d–f). Thus, only Clec9acrePtger2−/−Ptger4fl/fl mice, but not WT mice, can mount protective CD8+ T cell immunity against ferroptotic tumours. By antibody-mediated CD8+ T cell depletion, we further confirmed the relevance of CD8+ T cells for elimination of ferroptotic Gpx4−/− MC38 tumours in Clec9acrePtger2−/−Ptger4fl/fl mice (Extended Data Fig. 10g–i).
Finally, to specifically examine whether pharmacological inhibition of COX-driven PGE2 production can achieve better immune control of ferroptotic tumours, we analysed the growth of Gpx4−/− MC38 tumours transplanted into WT mice with or without CXB treatment. In line with PGE2-mediated impairment of anticancer immunity against ferroptotic tumours, Gpx4−/− MC38 tumours in CXB-treated mice displayed markedly increased control of tumour growth (Fig. 4j). Of note, this effect was associated with prominently enhanced expansion of CD8+ TILs (Fig. 4k), with a high frequency of GZMB-expressing cells (Extended Data Fig. 10j). Similarly, tumours formed by Gpx4−/− BRAF(V600E) melanoma cells exhibited tumour regression in CXB-treated, but not in untreated, WT mice (Extended Data Fig. 10k). Consistent with these data, BRAF(V600E) melanoma tumour-bearing WT mice treated with a combination of CXB and the ferroptosis inducer imidazole ketone erastin (IKE) displayed enhanced tumour growth control compared with untreated mice or mice treated with CXB or IKE alone (Fig. 4l and Extended Data Fig. 10l). Together, these data suggest that PGE2 produced by ferroptotic cancer cells limits anticancer immunity by controlling cDC1-driven effector differentiation and expansion of CD8+ TILs, which enables ferroptotic tumours to escape immune control. Interfering with the PGE2–EP2/EP4 axis can elicit cDC1-mediated expansion and effector differentiation of CD8+ TILs in ferroptotic tumours and result in protective anticancer immunity.
Discussion
Our results demonstrate that ferroptosis in cancer cells triggers aberrant synthesis of the bioactive lipid PGE2, enabling ferroptotic cancer cells to exert deleterious effects on cDC1-dependent, CD8+ TIL-mediated anticancer immunity within tumour tissue. This inhibitory mechanism is critical for immune escape of ferroptotic tumours.
Beyond highlighting that tumour ferroptosis causes suppression of anticancer immunity, as has been recently suggested8,9,10,14,17, our results reveal that this barrier to ferroptosis-inducing strategies mechanistically depends on PGE2 and its signalling through the PGE2 receptors EP2 and EP4, preventing cDC1-mediated expansion and effector differentiation of anticancer CD8+ TILs. As a result, interference with PGE2–EP2/EP4 signalling enhances the anticancer activity of cDC1s in ferroptotic tumours and induces protective, CD8+ TIL-mediated anticancer immunity. These findings therefore identify a molecular mechanism fundamentally linked to the metabolic underpinnings of ferroptosis that may be decisive for ferroptosis-mediated impairment of cancer immunity. Of note, it seems likely that PGE2 from ferroptotic tumour cells not only targets cDC1s but in parallel also interferes directly with anticancer TILs, as indicated by our data. PGE2 may further limit the anticancer activity of other innate immune cells such as type 2 conventional DCs (cDC2s), monocyte–macrophages or natural killer cells41.
We have revealed that PGE2 production by ferroptotic cancer cells involves p38 MAPK signalling activated through lipid peroxidation-induced, membrane permeabilization-dependent Ca2+ influx, which activates a molecular program that causes transcriptional upregulation of the COX–PGE2 pathway. Beyond providing a mechanistic explanation for high COX2 levels in ferroptotic cells, as has been recently observed18,42, our results uncover that this trait acquired by ferroptotic cells is uncoupled from the execution of cell death. As a consequence, interference with p38 MAPK signalling can disable the production of PGE2 while maintaining effective cancer cell elimination by ferroptosis inducers.
Multiple studies have highlighted the vulnerability of therapy-resistant and difficult-to-treat cancers to ferroptosis induction and the dependency of ferroptotic cancer elimination on anticancer immunity. Therefore, our discoveries that ferroptotic tumour cells antagonize anticancer immunity through the PGE2–EP2/EP4 axis and the uncoupling of this mechanism from ferroptosis-mediated tumour cell elimination have important mechanistic and clinical implications. Our results indicate that targeting PGE2–EP2/EP4 signalling to overcome ferroptosis-induced immunosuppression may provide an attractive means to unleash anticancer CD8+ T cell immunity and achieve cancer elimination by ferroptosis-inducing strategies. On this note, abolishing PGE2 production by inhibition of p38 MAPK signalling bears the potential to interfere with the immunosuppressive capacity of ferroptotic cancer cells without curbing ferroptosis-mediated cancer cell elimination. Our findings therefore identify p38 MAPK signalling-induced COX–PGE2 pathway activity in ferroptotic cancer cells as a potential molecular target to prevent immune evasion and improve cancer therapy by ferroptosis-inducing strategies. Of note, disabling the p38 MAPK–COX–PGE2 signalling may further benefit necroptosis-inducing strategies, as indicated by our findings with necroptotic cells.
Methods
Mice
All mice used in this study were on a C57BL/6J genetic background and obtained from Jackson Laboratory (JAX). Ptger2−/−Ptger4fl/fl mice were generated by crossing Ptger2−/− mice (004376, JAX) to Ptger4fl/fl mice (028102, JAX) and further crossed to Clec9acre mice (025523, JAX) to generate Clec9acrePtger2−/−Ptger4fl/fl mice, crossed to Cd4cre mice (022071, JAX) to generate Cd4crePtger2−/−Ptger4fl/fl mice or crossed to Itgaxcre mice (008068, JAX) to generate ItgaxcrePtger2−/−Ptger4fl/fl mice. OT-I × CD45.1 mice were generated by crossing OT-I mice (003831, JAX) to CD45.1 (002014, JAX) mice. Unless stated otherwise, all mice used in this study were used on a CD45.2/CD45.2 background. In all experiments, mice at 8–20 weeks of age were sex matched and randomly assigned to control or treatment groups. Mouse tumour experiments with Gpx4−/− tumours as well as T cell depletion were conducted without blinding; all other experiments were conducted in a blinded manner. No statistical methods were used to predetermine sample sizes. Mice were killed by cervical dislocation under anaesthesia. All mice were maintained and bred at the Technical University of Munich Klinikum rechts der Isar, under specific-pathogen-free, standard conditions with water and food ad libitum, in a controlled environment (22 ± 2 °C, 55 ± 10% humidity, 12 h light–dark cycle) and in accordance with the guidelines of the Federation of European Laboratory Animal Science Associations. All animal experiments were performed in accordance with the guidelines of the District Government of Upper Bavaria (Department 5–Environment, Health and Consumer Protection).
Cell lines
Control and Ptgs1/Ptgs2−/− BRAF(V600E) melanoma cells were generated using the CRISPR–Cas9 system as previously described21. BRAF(V600E)–OVA and Ptgs1/Ptgs2−/− BRAF(V600E)–OVA variants were generated by lentiviral transduction, as previously described20. 4-OH-TAM-inducible Gpx4−/− mouse immortalized fibroblasts (Pfa1) have been previously described43. Gpx4−/− MC38 and Gpx4−/− BRAF(V600E) cells were generated by CRISPR–Cas9-mediated gene editing using the lentiCRISPR v2-puro vector expressing single guide RNAs, as previously described44. In brief, Gpx4-targeting single guide RNA (5′-caccGCGTGTGCATCGTCACCAACG) was cloned in the BsmBI-digested lentiCRISPR v2-puro vector (98290, Addgene) and used to transiently transfect cancer cell lines using the X-tremeGENE HP agent (Roche). One day after transfection, cells were selected using puromycin (5 µg ml−1) and further cultivated with Lip-1 (1 µM) to prevent ferroptosis. After selection, single-cell clones were picked, and knockout clones were identified by immunoblotting. Mapk14−/− cells were generated by CRISPR–Cas9-mediated gene editing using the p38α MAPK14 CRISPR–Cas9 knockout plasmid (sc-424051; Santa Cruz) according to manufacturer’s protocol. After sorting for GFP+ cells, single-cell clones were picked, and knockout clones were identified by immunoblotting. Pfa1, Lewis lung carcinoma (LLC) and Gpx4−/− LLC cells were provided by M.C.; MC38 and Su86.86 cells were provided by A. Krüger. small-cell lung cancer (SCLC) cell lines were provided by S.v.K.
BRAF(V600E), Ptgs1/Ptgs2−/− BRAF(V600E), BRAF(V600E)–OVA, Ptgs1/Ptgs2−/− BRAF(V600E)–OVA, 4T1, NRAS(G12D), LLC, CT26, SLCL, Pfa1, NIH3T3, A549, Su86.86 and HT-29 cells were cultured in complete RPMI medium (RPMI 1640 medium, Thermo Fisher Scientific) supplemented with 10% FCS (PAN-Biotech), 50 U ml–1 penicillin (Thermo Fisher Scientific) and 50 µg ml–1 streptomycin (Thermo Fisher Scientific). MC38, D4M.3 A, Panc02, mouse pancreatic ductal adenocarcinoma (PDAC) and human patient-derived PDAC cells were cultured in DMEM (Thermo Fisher Scientific) supplemented with 10% FCS, 50 U ml–1 penicillin and 50 mg ml–1 streptomycin. Gpx4−/− cells were cultured in their respective medium supplemented with 1 μM Lip-1 to prevent ferroptosis. For in vitro assays, Gpx4−/− cell lines were cultivated in 1 µM Ferrostatin-1 (Fer-1) for one passage before seeding them with or without Fer-1 to assess ferroptosis and PGE2 production. Unless stated otherwise, all analyses of cell viability and PGE2 production were performed after 24 h.
To generate cancer cell conditioned medium, 4 × 10⁵ cancer cells were cultured in 2 ml complete RPMI medium or DMEM for 24 h before addition of the ferroptosis inducers RSL3 or ML210 (250 nM for NRAS(G12D), 500 nM for 4T1 and D4M.3A, and 1,000 nM for BRAF(V600E) and MC38 cells), doxorubicin (10 µM) or treatment with 150 mJ cm−2 UVB. 8 h later, cancer cells were washed three times with PBS and cultivated for another 16 h in complete RPMI or DMEM. The cell supernatant was collected, centrifuged at 600g for 5 min to remove dead cell debris and stored at −20 °C until further use. All cell lines were routinely tested for mycoplasma contamination in-house by PCR. No further cell line authentications were conducted in the laboratory.
Tumour cell injections
Cancer cell lines were detached by trypsinization (Thermo Fisher Scientific) and washed three times in sterile PBS (Thermo Fisher Scientific). Cells were injected subcutaneously in 100 μl endotoxin-free PBS on the flank of recipient mice, using 2 × 10⁵ cells for tumour growth studies and 2 × 10⁶ cells for all other experiments. Tumour growth was measured using a digital calliper. Tumour diameters stated in the figures refer to the average values of the longest diameter and its perpendicular for each tumour. Tumour growth was restricted to a maximum diameter of 15 mm, which served as the humane end point and was not exceeded in any of the experiments. For animals reaching the humane end point before the end of the observation period, the last measured tumour diameter was carried forwards to subsequent time points (last observation carried forwards). For experiments involving ferroptotic control or Ptgs1/Ptgs2−/− BRAF(V600E)–OVA melanoma cells, cancer cells were pre-treated with 1 μM RSL3 for 8 h before subcutaneous injection of 1 × 10⁶ cells in 100 μl of endotoxin-free PBS into the flank of recipient mice.
CD8+ T cell depletion in vivo
To deplete CD8+ T cells, mice received intraperitoneal injections of 100 µl anti-mouse CD8β antibody (200 µg per mouse; 53-5.8, BioXCell) every 5 days, beginning on day 1 following tumour cell inoculation.
Pharmacological treatment in vivo
Treatment of mice bearing subcutaneous MC38 or control BRAF(V600E) tumours was initiated once tumours were palpable, on days 3–5 post-tumour cell transplantation. Solutions were prepared fresh every day. For induction of ferroptosis, mice received daily intraperitoneal injection of 40 mg kg−1 IKE dissolved in 55% PEG 300 (Sigma) and 45% PBS. Lyophilized CXB (MedChem) was weighed using a fine balance and made up in a 60:40 ratio of DMSO (1 part, Sigma)/PEG400 (5 parts, Sigma):dH2O. The final concentration was 6 mg ml−1, corresponding to a dose of 30 mg kg−1 delivered in a total volume of 100 µl per mouse. CXB was administered daily by oral gavage.
Processing of tumour tissue and lymphoid organs
Tumours, lymph nodes or spleens of tumour cell-inoculated mice were collected at the indicated time points after cancer cell transplantation. Tumour or organ weight was measured using a microscale. For flow cytometry analysis, tumour samples were mechanically dissociated and digested with DNase I (100 µg ml–1, Merck) and collagenase IV (200 U ml–1, Thermo Fisher Scientific) for 40 min at 37 °C followed by filtration through a 70-µm and a 30-µm cell strainer (Miltenyi) and washing with FACS buffer (PBS with 1% FCS and 2 mM EDTA) to generate single-cell suspensions before proceeding with antibody-mediated staining. Spleens were passed through a 70-µm cell strainer, followed by red blood cell lysis with ACK-lysis buffer for 3 min and additional filtration using a 30-µm cell strainer. Lymph nodes were dissociated using a 30-µm cell strainer.
Antibodies and reagents for flow cytometry and cell sorting
The following antibodies and staining reagents were used for flow cytometry or cell sorting: fixable viability dye eFluor 450 (dilution: 1:1,000; Thermo Fisher Scientific); fixable viability dye APC-eF780 (1:2,000; Thermo Fisher Scientific); PE-Cy7 anti-CD8α (1:200; 53-6.7, BioLegend); PE-Dazzle594 anti-CD8α (1:200; 53-6.7, BioLegend); BV711 anti-mouse/human-CD44 (1:100; IM7, BioLegend); PerCP-Cy5.5 anti-mouse/human-CD44 (1:100; IM7, BioLegend); PE anti-CD45.1 (1:100; A20, BioLegend); BV510 anti-CD45.2 (1:100; 104, BD Biosciences); BUV395 anti-CD45.2 (1:100; 104, BD Biosciences); FITC anti-CD62L (1:100; MEL-14, BioLegend); FITC anti-CD103 (1:100; M290, BD Biosciences); Pe-Cy7 anti-CD103 (1:100; 2E7; BioLegend); PE-Dazzle594 anti-CD186/CXCR6 (1:200; SA051D1, BioLegend); BV421 anti-CD366/TIM-3 (1:200; RMT3-23, BioLegend); BV605 anti-CD279/PD-1 (1:100; 29F.1A12, BioLegend); PerCP/Cy5.5 anti-TCRβ (1:100; H57-597, BioLegend); AF700 anti-TCRβ (1:100; H57-597, Sony); APC anti-human GZMB (1:200; GB12, Thermo Fisher Scientific); PE anti-human GZMB (1:200; GB12; Thermo Fisher Scientific); FITC anti-Ki-67 (1:100; SolA-15, Thermo Fisher Scientific); PE anti-mouse TCF1 (1:200; S33-966, BD Biosciences); and rabbit-anti-mouse-TCF1/TCF7 (1:100; C.725.7, Thermo Fisher Scientific). This was followed by staining with AF647 donkey-anti-rabbit IgG (1:200; Poly4064, BioLegend); BV605 anti-CD11b (1:200; M1/70; BioLegend); PerCP-Cy5.5 anti-CD11c (1:200; N418; BioLegend); PE-Cy7 anti-CD11c (1:200; M17/4; BioLegend); BV421 anti-XCR1 (1:200; ZET; BioLegend); PE anti-CXCL9 (1:100; MIG-2F5.5, BioLegend); PerCP/Cy5.5 anti-IL-12/IL-23 p40 (1:100; C15.6, BioLegend); FITC anti-I-A/I-E (MHC class II) (1:1,000; M5/114.15.2, Thermo Fisher Scientific); AF700 anti-mouse H-2kb (1:100; AF6-88.5, BioLegend); AF647 anti-CD86 (1:200; GL-1, BioLegend); BV605 anti-CD80 (1:200; 16-10A1, BioLegend); and BV421 anti-CD3 (1:200; 17A2, BioLegend).
Flow cytometry and cell sorting
Staining of the cell surface with fluorescently labelled antibodies and viability dyes was performed for 20 min at 4 °C in FACS buffer (PBS with 1% FCS and 2 mM EDTA). For intracellular staining of GZMB, TCF1 and Ki-67, cells were fixed and permeabilized using the True-Nuclear Transcription Factor Buffer Set (BioLegend) according to the manufacturer’s protocol. Intracellular staining of CXCL9 or IL-12 was performed using the Intracellular Fixation & Permeabilization Buffer Set (Thermo Fisher) according to the manufacturer’s protocol. Intracellular staining was performed overnight in permeabilization buffer at 4 °C. Flow cytometry analyses were performed using a ID7000C Spectral Cell Analyzer (ID7000 software v2.0.2.17121, Sony Biotechnologies) or a SP6800 Spectral Cell Analyzer (spectral analyser software v2.0.2.14140, Sony Biotechnologies). Flow cytometric quantification of cell numbers was done using CountBright Absolute Counting Beads (Thermo Fisher Scientific). All flow cytometric data were analysed using FlowJo (v10.10.0, BD Biosciences). Sorting of naive OT-I T cells (CD45.1+CD8+CD62L+CD44–) from blood for adoptive transfer experiments and mouse cDC1s (CD103+) from bone marrow cultures was performed using a SH800S Cell Sorter (cell sorter software v2.1.6, Sony Biotechnologies). Representative flow cytometry-gating strategies for analyses of CD8+ TILs, intratumoural cDC1s and cDC2s or splenic cDC1s and cDC2s can be found in Supplementary Fig. 1.
Adoptive T cell transfer of OT-I T cells
For adoptive transfer of OVA-specific OT-I cells, 1 × 10³ congenically marked naive CD8+ T cells (CD45.1+CD8+CD62L+CD44−) were isolated from the blood of OT-I donor mice and injected intravenously into sex-matched CD45.2+ recipient mice in 100 µl sterile PBS. The transfer was performed 6 h before subcutaneous transplantation of ferroptotic control or Ptgs1/Ptgs2−/− BRAF(V600E)–OVA melanoma cells.
Immunofluorescence microscopy and image analysis
Volumetric immunofluorescence tumour microscopy was performed as previously described45. In brief, tumours were fixed in Antigenfix solution (Diapath). Samples were dehydrated in 30% sucrose, embedded in TissueTek OCT freezing medium (Sakura Finetek) and stored at −80 °C. Consecutive sections of 50 μm thickness were generated using a Leica CM3050 S cryostat. Sections were permeabilized, blocked and stained in 0.1 M Tris (Carl Roth) supplemented with 1% BSA, 0.3% Triton X-100 (Merck), normal mouse serum (Merck) and donkey serum (Merck). Stained sections were mounted in Mowiol (Merck) and analysed using an inverted TCS SP8 confocal microscope (Leica), a STELLARIS confocal microscope (Leica) or a THUNDER imager (Leica) for tiled imaging using a HC PL APO CS2 ×20/0.75 NA objective or a HC PL APO CS2 ×40/1.30 NA THUNDER objective, or a Fluoview FV3000 microscope using an UPlanSApo ×20 air/0.75 NA objective (Olympus). All images were acquired as tiled image stacks, covering whole-tumour sections in the xy plane, with 2-μm z-spacing to provide large three-dimensional (3D) image volumes of at least 20 μm depth. Image analysis and cell rendering was performed as previously described45. 3D images were analysed using the Imaris 10.2.0 software (Oxford Instruments). The Imaris surface generation tool was used to reconstruct and visualize 3D objects for individual cells. Clusters of interacting cDC1s and CD8+ T cells were identified in a multi-step process using positional information for cell objects. CD8+ T cell clusters were defined as a minimum of five cells within a distance of 20 μm measured from the outer surface of each cell and identified using the Imaris built-in ‘distance to 5 nearest neighbours’ function. cDC1s interacting with clustered CD8+ T cells (referred to as ‘interacting cDC1’) were identified using object–object closest distance (distance ≤ 5 μm). To identify clustered CD8+ T cells interacting with cDC1s (‘interacting CD8+ T cells’), CD8+ T cells localized more than 15 μm from these interacting cDC1s were removed by distance thresholding using the Imaris filter function. Quantification of cell clusters was performed relative to the volume of the imaged section.
Antibodies for immunofluorescence microscopy
The following antibodies were used for staining of mouse tissues: AF594 anti-CD3 (1:200; clone 17A2, BioLegend), BV421 anti-CD8α (1:100; clone 53-6.7; BioLegend), anti-CD103 (1:200; goat polyclonal; R&D Systems), FITC anti-MHC class II I-A/I-E (1:500; clone M5/114.15.2, BioLegend), AF680 anti-goat IgG (1:500; donkey polyclonal; Jackson ImmunoResearch), anti-COX2 (1:200; amino acids 584–598; Cayman Chemicals) and AF647 anti-rabbit IgG (1:400; A-21244, Invitrogen). All antibodies were either validated by the manufacturer or were previously reported for immunofluorescence microscopy.
Live-cell imaging
Live-cell imaging was performed using a DMi8 microscope (Leica) with a HC PL APO ×20/0.8 PH2 or HC PL APO ×40/0.95 CORR PH2 objective. Temperature was regulated at 37 °C and CO2 level at 5% using a Heating Unit 2000 (Pecon) equipped with a TempController 2000 (Pecon) and CO2-Controller 2000 (Pecon). Pfa1 cells (2 × 10⁴) were seeded in a µ-slide glass-bottom chamber slide (Ibidi) and cultivated for 24 h before imaging. Dyes for the staining of lipid peroxidation using BODIPY C11 (2 µM; Thermo Fisher Scientific), Ca2+ influx using Fluo-8-AM (4 µM; AAT Bioquest) or CalBryte 630-AM (5 µM; AAT Bioquest), small-molecule influx using FITC-labelled dextrans of 4 kDa or 70 kDa and membrane permeabilization as a marker for cell death using Sytox blue (5 µM; Thermo Fisher Scientific) or 7-AAD (1:40; Thermo Fisher Scientific) were added 30 min before imaging and kept in the media for the time of imaging. To assess lipid peroxidation by BODIPY staining, BODIPY 581/591 C11 (Thermo Fisher) was added directly into the cell culture media at a final concentration of 2 µM and cells were incubated for 30 min at 37 °C before being washed three times with PBS. For live-cell microscopy-based single-cell analyses, BODIPY C11 was kept in the media for the time of imaging. Measurement of oxidized BODIPY C11 was performed after excitation by a 488 nm laser, and measurement of non-oxidized BODIPY C11 after excitation with a 581 nm laser.
Immunohistochemistry of tumour tissue
For immunohistochemistry, formalin-fixed and paraffin-embedded tumour tissue sections were heated at 60 °C for 15 min and deparaffinized with xylene and graded ethanol. Sections were washed in TBS containing 0.01% Tween-20 (TBS-T) and blocked with 5% normal goat serum in TBS-T for 20 min at room temperature. Sections were then incubated overnight at 4 °C with mouse monoclonal anti-4-HNE antibody (1:200; HNEJ-2, JaICA) diluted in TBS-T containing 5% goat serum. After three washes in TBS-T, endogenous peroxidase activity was quenched by incubation with 0.3% H2O2 in methanol for 20 min, followed by three washes in TBS-T. Sections were incubated with biotinylated goat anti-mouse IgG secondary antibody (1:200; 115-065-166, Jackson ImmunoResearch) in TBS-T containing 5% goat serum for 30 min at room temperature, followed by incubation with the VECTASTAIN Elite ABC peroxidase system (PK-6100, Vector Laboratories) for 30 min at room temperature. After washing, sections were visualized using DAB substrate (SK-4100, Vector Laboratories), with development monitored microscopically until a suitable brown colour was obtained. The reaction was stopped by washing with water, and sections were counterstained with haematoxylin, blued in tap water, dehydrated through graded ethanol and xylene, and mounted in Roti Mounting medium (Carl Roth).
cDC1 assays
Generation of cDC1s was performed as previously described19, with minor modifications. In brief, bone marrow cells were isolated from mouse femur and tibia by flushing the bones with RPMI using a syringe and a 20-gauge cannula. After red blood cell lysis using ACK buffer (double-distilled H2O (ddH2O) with 150 mM ammonium chloride, 10 mM potassium bicarbonate and 1μm disodium EDTA) for 3 min at room temperature, 1.5 × 10⁶ cells per millilitre were incubated with GM-CSF (300 pg ml−1) and FLT3L (55 ng ml−1) in RPMI 1640 medium (Thermo Fisher Scientific) supplemented with 10% FCS (PAN-Biotech), 50 µM β-mercaptoethanol (Thermo Fisher Scientific), 50 U ml–1 penicillin (Thermo Fisher Scientific) and 50 µg ml–1 streptomycin (Thermo Fisher Scientific). After 9 days of culture, non-adherent cells were reseeded at 0.3 × 10⁶ cells per millilitre in fresh medium containing GM-CSF and FLT3L for an additional 5 days before FACS sorting of differentiated cDC1s based on CD103 expression. For assays using splenic cDCs, freshly isolated mouse spleens were digested in RPMI 1640 containing DNase I (100 µg ml–1; Merck) and collagenase IV (200 U ml–1; Thermo Fisher Scientific) for 30 min. Dendritic cells were subsequently isolated using the Pan Dendritic Cell Isolation Kit, mouse (130-100-875, Miltenyi Biotec), according to the manufacturer’s protocol.
For in vitro treatment with cancer cell conditioned medium, mouse cDC1s were cultured with conditioned medium from cancer cells at 37 °C for 16 h before their analysis or use in functional assays. For assessment of cytokine and chemokine production following activation, cDC1s were stimulated with poly(I:C) (10 μg ml−1) for 4 h, and brefeldin A (5 μg ml−1) was added for the last 3 h of stimulation before proceeding with antibody staining for flow cytometric analyses. In some experiments, cDC1 stimulation was done using IFNγ (10 ng ml−1), IFNα (10 ng ml−1), 2′,3′-cGAMP (10 μM), NAD (10 μM) or ATP (100 μM). For the generation of cDC1 conditioned medium, cDC1s were first treated with cancer cell conditioned medium for 16 h, washed three times with PBS and stimulated with poly(I:C) (10 μg ml−1) for 24 h. The culture supernatant was collected and centrifuged at 600g for 5 min to remove remaining cell material, and the cell-free conditioned medium was collected and stored at −20 °C until further use.
Analysis of cDC1-mediated CD8+ T cell expansion
To generate antigen-experienced stem-like CD8+ T cells, naive CD8+ T cells were isolated from the spleens of mice using MACS separation and stimulated with mouse anti-CD3/CD28 microbeads and IL-2 (85 U ml–1) for 4 days. After 2 days of culture, CD8+ T cells were re-seeded at 1 × 10⁶ cells per millilitre with fresh medium containing anti-CD3/28 microbeads plus IL-2. To assess the ability of cDC1s to promote antigen-experienced CD8+ T cell expansion, 2.5 × 10⁴ CD8+ T cells from T cell cultures were incubated with mouse anti-CD3/CD28 microbeads in the presence or absence of supernatant from cDC1s pre-treated as indicated in the figure legends. After 72 h of incubation, the number of viable CD3+CD8+ T cells was quantified by flow cytometry.
Cell viability assay
Resazurin (7-hydroxy-10-oxidophenoxazin-10-ium-3-one, sodium; Stemcell) was added directly to the culture medium at a final concentration of 50 µg ml−1 and incubated for 1 h at 37 °C. Viability was measured at an excitation/emission wavelength of 540/590 nm using a Tecan infinite M1000Pro and Tecan i-control software (v3.9.1.0). Cell viability was calculated as the percentage of fluorescence intensity relative to the vehicle control group.
PGE2 measurements
PGE2 concentration in cell-free conditioned medium was measured by enzyme-linked immunosorbent assay (ELISA) (Cayman Chemical) according to the manufacturer’s protocol using a Tecan infinite M1000Pro and Tecan i-control software (v3.9.1.0).
Measurement of cDC1 cytokine production
Cytokine and chemokine concentrations in conditioned medium from stimulated cDC1s were quantified using the LEGENDplex bead-based multiplex immunoassay (BioLegend) according to the manufacturer’s protocol.
Blockade of Ca2+ influx
To block the influx of extracellular Ca2+ into ferroptotic cells, the calcium-chelator EGTA (2 mM) or the osmoprotectant PEG 3350 (10 mM) was added to the cell culture media 4 h after cancer cell treatment with the ferroptosis inducer RSL3.
Western blotting
Cells were lysed in RIPA lysis buffer (150 mM NaCl, 5 mM EDTA, 50 mM Tris, 1% NP-40, 0.5% sodium deoxycholate and 0.1% SDS in ddH20) containing protease and phosphatase inhibitor cocktail (Sigma-Aldrich), sonicated three times for 10 s at 35 kHz and centrifuged at 15,000g at 4 °C for 5 min. The supernatant was collected and used as the protein sample. Western blotting was performed by standard immunoblotting procedure with 12% SDS–PAGE gel and nitrocellulose membrane. Primary antibody staining to GPX4 (1:2,000; EPNCIR144, Abcam), COX2 (1:1,000; amino acids 584–598; Cayman Chemical), β-actin (1:2,000; #4967S, Cell Signaling), p38 (1:1,000; #9212S, Cell Signaling), phospho-p38 (1:1,000; D3F9, Cell Signaling), p38α (1:1,000; #9218S, Cell Signaling) or HSP60 (1:2,000; D6F1, Cell Signaling) was performed at 4 °C overnight. Horseradish peroxidase-labelled secondary antibodies to mouse IgG (1:10,000; RRID: AB_10015289, Jackson ImmunoResearch) or rabbit IgG (1:10,000; RRID: AB_2313567, Jackson ImmunoResearch) were stained for 1 h at room temperature. Bands were visualized using Pierce ECL Western Blotting Substrate (Thermo Fisher Scientific). Images were taken with a ChemiDoc XRS+ (Bio-Rad). Images were analysed with Image Lab software (v6.0.1; Bio-Rad). Images of all uncut blots can be found in Supplementary Fig. 2.
Liquid chromatography with tandem mass spectrometry-based lipid profiling
Cell-free conditioned media from cancer cells were mixed 1:1 with methanol (50% v/v) immediately after collection and stored at −80 °C. For analysis, 200 µl of each sample was thawed on ice, spiked with 10 µl of an internal standard mix (final concentration of 5 ng ml−1) and precipitated with 50 µl cold methanol (−20 °C). After protein denaturation on ice (10 min) and centrifugation (10,000g for 15 min at 4 °C), supernatants were adjusted to 1 ml with Milli-Q water. Eicosanoids were extracted using Strata-X 33-µm polymeric reversed-phase SPE plates (Phenomenex) on a Positive Pressure-96 Processor (Waters). Columns were conditioned with methanol and water, and samples were loaded and washed with 10% methanol. Target analytes were eluted in 100% methanol. Eluates were evaporated under nitrogen at 30 °C and reconstituted in 30 µl of 50% methanol. Ten microlitres were injected onto a Sciex QTRAP 6500+ mass spectrometer associated with an Exion UHPLC operated in negative-ion mode using scheduled multiple reaction monitoring. Quantification was carried out using calibration curves and internal standards, with quality control pools and blank samples analysed throughout the run to ensure accuracy and reproducibility. For BRAF(V600E), NRAS(G12D), 4T1 and MC38 cancer cell lines, fold change of each analyte production during ferroptosis relative to DMSO control group was plotted against its final concentration in ferroptotic conditioned medium. For Pfa1 cells, analytes from each oxylipin subclass (eicosanoid, hydroxylated/oxidized lipids and protectins/resolvins) were ordered from high to low abundance in ferroptotic-conditioned medium and plotted as a z-score between different treatment groups.
RNA isolation and quantitative real-time PCR
RNA was isolated using Monarch Total RNA Miniprep kit (New England Biolabs) and complementary DNA (cDNA) was generated using a SensiFAST cDNA synthesis kit (Bioline). Quantitative real-time PCR was performed on a LightCycler 480 (LightCycler 480 software v1.5.1, Roche) using the TAKYON No ROX SYBR MasterMix dTTP Blue kit (Eurogentec) according to the manufacturer’s protocol. Gene expression was normalized to the reference gene Hprt by using the ΔCt method. All primers were purchased from Eurofins.
RNA sequencing
In vitro-generated WT or ItgaxcrePtger2−/−Ptger4fl/fl CD103+ cDC1s were incubated for 16 h with conditioned medium from control or Ptgs1/Ptgs2−/− ferroptotic BRAF(V600E) melanoma cells followed by stimulation with poly(I:C) (10 μg ml−1) for an additional 4 h. RNA was isolated using an Arcturus PicoPure RNA isolation kit (Thermo Fisher Scientific). Library preparation was carried out using the Novogene manufactured internal kit. mRNA was purified from total RNA using poly-T oligo-attached magnetic beads. After fragmentation, the first strand cDNA was synthesized using random hexamer primers, followed by the second strand cDNA synthesis using dUTP for directional (strand-specific) library construction. Sequencing was performed on a NovaSeq X Plus with 25B flowcell 2 × 150 bp paired-end sequencing (300 cycles kit). The raw fastq files related to the sequence reads were mapped to the mouse genome, which was downloaded from the UCSC browser (GRCm38/mm10), using the STAR algorithm46. The reads were counted using the Rsubread R package47. These read counts were normalized, and differentially expressed genes were analysed using the iDEP (v2.01) web server48, utilizing the DESeq2 R package49 for differentially expressed gene identification (with fold change ≥ 1.5 and adjusted P < 0.05). Principal component analysis was performed using the prcomp R function and plotted using the ggplot2 R package. Volcano plots were rendered using the Enhanced Volcano R package (https://github.com/kevinblighe/EnhancedVolcano). The ‘Core functional cDC1’ gene set was defined as activation-induced genes significantly downregulated in activated cDC1s following incubation with conditioned medium from ferroptotic control BRAF(V600E) cells. Hierarchical clustering of core functional cDC1 genes was performed using the hclust function in R (Euclidean distance, complete linkage), and heatmaps were generated using the heatmap.2 function of the gplots R package. Gene set enrichment analysis (GSEA) was performed on core functional cDC1 genes and arranged according to log2(fold changes). Enrichment of gene sets was then conducted using GSEA (v4.2.3)50. Gene sets related to cytokine signalling and cell migration were extracted from the Molecular Signature Database (https://www.gsea-msigdb.org/gsea/msigdb/index.jsp). Gene signatures for antigen uptake and cross-presentation were from a previous study51. The gene set for PGE2 impaired functional cDC1 genes was from a previous study19. PGE2-impaired core functional cDC1 genes for correlation analysis were defined as activation-induced genes significantly downregulated in activated cDC1s following incubation with PGE2. The PreRanked tool from GSEA (v4.2.3) was used to assess the normalized enrichment score, and a false discovery rate (q < 0.25) was utilized to evaluate the statistical significance of the normalized enrichment score.
Statistics and reproducibility
Throughout this study, different statistical tests were used to assess statistical significance, as indicated in the figure legends. Data are shown as the mean ± s.e.m., mean ± minimum and maximum values or boxplots, as indicated in the figure legends.
Data shown in Figs. 1e and 3g are pooled from two independent experiments. Data shown in Figs. 1b,d, 2b,c,h–k,m–q, 3f,i and 4d,g are representative of two independent experiments. For the boxplots in Figs. 1b, 2h–k,m–o and 3i, the centre line indicates the mean and the bounds show the minimum and maximum values. For the boxplots in Figs. 1e and 4c,e,f,h,i,k, the centre line indicates the median, the bounds extend from the 25th to 75th percentiles and the whiskers correspond to the minimum and maximum values. GraphPad Prism software (v9.5.0 and v9.5.1) was used for statistical analyses.
Reporting summary
Further information on research design is available in the Nature Portfolio Reporting Summary linked to this article.