 Newshot
Main
Solid-organ cancers represent a complex spectrum of pathology, with the intricately associated TME having a pivotal role in disease progression and therapeutic response4,5. Within the TME, both stromal and immune cells have emerged as key modulators of tumour growth, invasion and metastasis1,6,7,8,9,10. However, different studies (often in single-organ contexts) have shown conflicting roles for these cells in promoting versus suppressing tumour growth11,12,13,14. The heterogeneity of the TME, both within individual tumours and across tumour types, poses a substantial challenge to understanding the functional diversity of tumour-associated stromal and immune cells3,15,16.
Previous studies have identified distinct cell subpopulations within the TME based on their gene expression profiles, spatial distributions and functional characteristics17,18,19,20,21. However, these findings stem largely from isolated single-cell RNA sequencing (scRNA-seq) studies22,23,24, and subsequent pan-cancer efforts have remained limited in size and scope3,25,26,27,28. To our knowledge, the largest cancer-associated fibroblast atlas to date integrates data from 1,116 samples across 10 tumour types29; the largest tumour endothelial cell atlas includes 575 samples across 19 tumour types30; and no specific tumour mural or nerve atlases have been generated. Pan-cancer immune cell atlases have been larger28, especially those focused on individual immune cell lineages31,32,33; however, these typically have not examined immune cell interactions within the broader TME.
Here we integrated single-cell transcriptomic data from 3,381 human and mouse samples across 42 cancer types and 258 datasets to create a definitive TME transcriptional atlas. By mapping this massive cellular landscape, we resolved the stromal and immune ecosystem of solid tumours. Furthermore, by linking enriched subpopulations to poor clinical outcomes, we identified opportunities for future TME-targeted cancer therapies. Key computational predictions are subsequently validated through in vitro and in vivo experiments. Finally, we have consolidated this work into an interactive web atlas (tmeatlas.stanford.edu) and R software package (scTME) that will serve as practical resources for groups investigating the TME.
Curation
To systematically analyse single-cell transcriptomic data, we evaluated every scRNA-seq cancer study published in the public domain between January 2014 and July 2025. Separate queries were evaluated independently for human and mouse datasets within the foundational public repositories for single-cell transcriptomics: the Gene Expression Omnibus (GEO) and ArrayExpress. We screened a total of 3,975 published datasets (Fig. 1a). Studies specific to either blood or central nervous system cancers were excluded from our analysis, as were those failing to meet specific architectural requirements (Methods; see Fig. 1a,b). Our comprehensive screen identified 190 human and 68 mouse datasets (Supplementary Table 1), collectively comprising more than 15.4 million cells. Collectively, these datasets formed the final analytical cohort, comprising 3,381 individual scRNA-seq samples across 42 unique cancer types (Fig. 1b and Supplementary Tables 2 and 3).
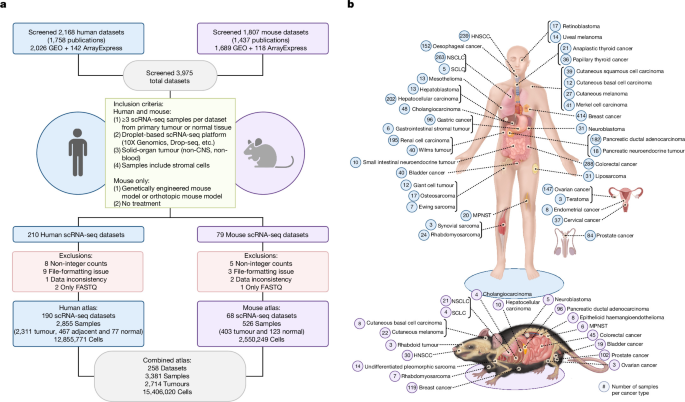
a, Systematic workflow detailing the scRNA-seq dataset curation process. The initial screen examined 3,975 datasets, of which 190 human and 68 mouse scRNA-seq remained after filtering. The combined 258 datasets comprised 3,381 samples and more than 15 million cells. Schematic created in BioRender; Wang, H. https://biorender.com/w8x4pii (2026). CNS, central nervous system. b, Illustration of all cancer types from human (top) and mouse (bottom) included in this study. HNSCC, head and neck squamous cell carcinoma; MPNST, malignant peripheral nerve sheath tumour; NSCLC, non-small-cell lung cancer; SCLC, small-cell lung cancer. Illustration created in BioRender; Wang, H. https://biorender.com/p0byno1 (2026).
Human dataset integration and annotation
To process the more than 12.8 million human cells from 2,855 samples and 190 datasets (Extended Data Fig. 1a,b and Supplementary Fig. 1), nearly an order of magnitude greater than many recent seminal studies3,25,26,27,28,31,32,33,34, we used sketch-based sampling and memory read optimization (Extended Data Fig. 1c,d). We applied three independent approaches for data integration to reduce batch effects: Harmony, scVI and FastMNN (Extended Data Figs. 1e and 2a). We then projected each integrated result onto the full dataset (Extended Data Fig. 2b,c). Supervised annotation using four methods—canonical marker genes, estimated copy number variation (inferCNV), SingleR and scATOMIC (Extended Data Fig. 3 and Supplementary Fig. 2)—delineated the presence of seven main cell types across nearly all human cancers (Fig. 2a–c, Extended Data Fig. 1e,f and Supplementary Table 4). These encompass principal stromal (fibroblast, endothelial, mural and nerve) and immune (myeloid and lymphoid) lineages, alongside epithelial cells, which were excluded from subsequent characterization to focus on the two core TME compartments. Comparing the three integration approaches (Supplementary Table 5), Harmony demonstrated the most robust integration and was selected for all subsequent evaluations. The three integration approaches also frequently yielded discordant cell-type assignments for individual cells (Extended Data Fig. 2d–f), highlighting the stochasticity and misclassification risks inherent to relying on any single method35,36. To mitigate this, we provisionally pooled all cells assigned to a specific TME lineage by any of the three algorithms (Extended Data Fig. 1g). Misassigned cells within these overlapping pools were subsequently removed through recursive downstream filtering (Extended Data Fig. 1h and Supplementary Fig. 3a–e), generating final, high-fidelity atlases for the six principal TME cell types (Fig. 2d–i and Extended Data Fig. 1i,j).
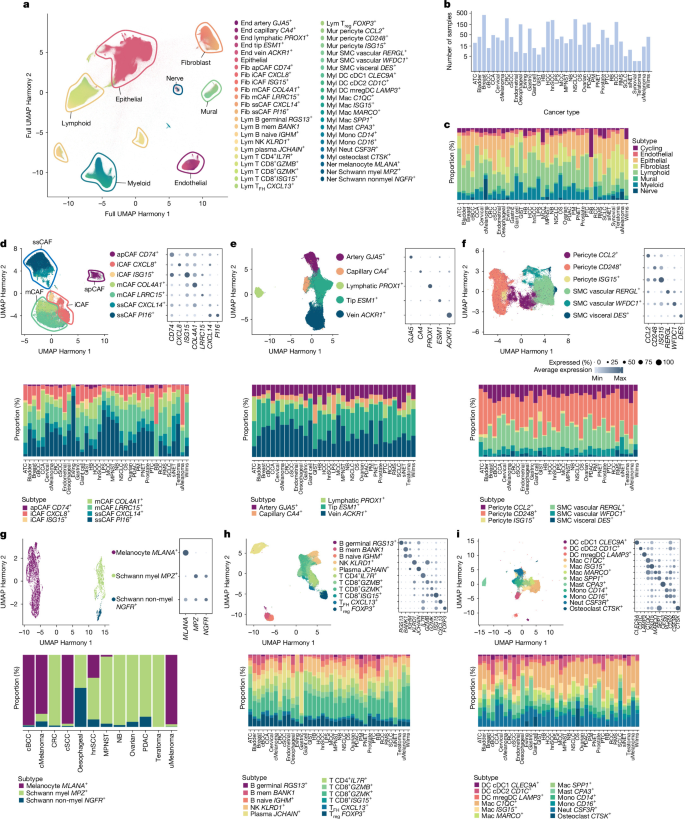
a, UMAP embeddings of 12,855,771 cells from 190 human studies integrated using Harmony, with consensus seven cell-type annotations (outlined and labelled within the panel) derived through multiple annotation approaches (Extended Data Figs. 1 and 2 and Supplementary Figs. 1–3). Individual cells are labelled according to downstream final cell annotations in panels d–i. cDC, conventional dendritic cell; DC, dendritic cell; End, endothelial; Fib, fibroblast; Lym, lymphoid; Mac, macrophage; mem, memory; Mono, monocyte; mregDC, mature dendritic cell enriched in immunoregulatory molecules; Mur, mural; myel, myelinating; Myl, myeloid; Neut, neutrophil; NK, natural killer; SMC, smooth muscle cell; TFH, follicular helper T; Treg, regulatory T. b, Total number of human samples included for each type of cancer. c, Distribution of cell types for each cancer, after selecting for only unsorted samples. Abbreviations of cancer names are listed in Supplementary Table 2. d, UMAP embedding of CAFs, manually clustered into four parent populations (outlined and labelled within the UMAP) from a total of seven transcriptionally distinct subpopulations, the latter of which are coloured separately (top left). A dot plot displaying relative gene expression for characteristic markers of the seven transcriptionally distinct CAF subpopulations shown in the left panel (top right). Distributions of CAF subpopulations among tumour samples for different cancer types are also shown (bottom; n = 328,877 cells). e–i, UMAPs (top left), dot plots (top right) and distributions among tumour samples for different cancer types (bottom) for endothelial (e; n = 234,948 cells), mural (f; n = 162,178 cells), nerve (g; n = 7,655 cells), lymphoid (h; n = 1,580,785 cells) and myeloid (i; n = 805,111 cells) cells. Between 3 and 12 subpopulations are identified for each cell type, and one population-defining gene per subpopulation is displayed in the dot plot for each cell type (full list in Supplementary Tables 6 and 7).
Cancer-associated fibroblasts
We next characterized cancer-associated fibroblasts (CAFs), the predominant stromal population in the TME37. Following our recursive isolation strategy (Extended Data Fig. 1h), we delineated four transcriptionally distinct CAF meta-clusters (Fig. 2d) expressing canonical markers (PDGFRA, LUM and DCN) and lacking non-fibroblast markers (Extended Data Fig. 4a and Supplementary Fig. 4). Specifically, we identified (1) antigen-presenting CAFs (apCAFs; class II HLA+), (2) immunomodulatory/inflammatory CAFs (iCAFs; cytokine+), (3) myofibroblastic/mechanoresponsive CAFs (mCAFs; extracellular matrix (ECM)+, mechanotransduction+), and (4) steady-state CAFs (ssCAFs; progenitor-like markers+; Fig. 2d), broadly consistent with observations from our previous work38 and that of others25,39,40,41. High-resolution sub-clustering (Fig. 2d, Supplementary Table 6 and 7 and Supplementary Fig. 4) further stratified these into seven subpopulations: two iCAF (CXCL8+ or ISG15+), two mCAF (LRRC15+ or COL4A1+), two ssCAF (PI16+ or CXCL14+) and one apCAF. All seven subpopulations were conserved across nearly all evaluated tumour types and tissues (Fig. 2d, bottom). Of note, apCAFs were nearly universally present, whereas previous studies had found them only in rare tumour subsets6. Furthermore, the human apCAFs that we identified did not express mesothelial markers such as MSLN, which are characteristic of mouse apCAFs42 (Extended Data Fig. 4a).
Comparing relative abundances between tumour and non-malignant tissues (Fig. 3a), both mCAF populations were significantly enriched in tumours (3.5-fold for LRRC15+; 2.7-fold for COL4A1+; Supplementary Table 8), reflecting cancer-induced desmoplasia37,43. Similarly, iCAFs and apCAFs were enriched in tumour samples (6.3-fold for ISG15+ iCAFs, 1.3-fold for CXCL8+ iCAFs and 2.0-fold for apCAFs), consistent with their roles in inducing immune evasion42 or secreting inflammatory cytokines41. Analysing abundance across tumour stage and patient treatment response, we found ISG15+ iCAFs, LRRC15+ mCAFs and COL4A1+ mCAFs significantly enriched in late-stage (III–IV) versus early-stage (I–II) tumours (1.9-fold, 1.3-fold and 1.2-fold, respectively; Fig. 3b). Treatment responsiveness did not significantly correlate with any CAF subpopulation (Fig. 3c). Overall, ISG15+ iCAFs were the most consistently enriched fibroblast subset defining both the malignant state and advanced disease (Fig. 3a–c, blue box).
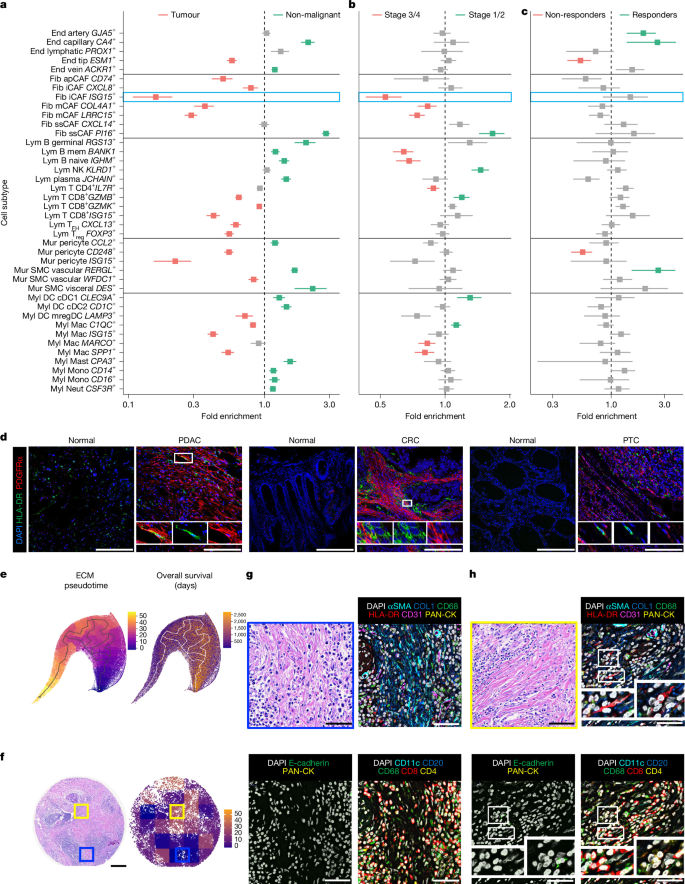
a–c, Forest plots of cell subpopulation proportions, relative to their parent population, between tumour and non-malignant samples (a), advanced-stage (3–4) versus early-stage (1–2) cancer (b), and treatment non-responders versus responders (c). The blue box in panel a highlights ISG15+ iCAFs. Non-malignant samples comprise tissue resected adjacent to a tumour, pooled with tissue from individuals or animals without tumours. The points show fold enrichment, the ratio of weighted mean per-sample proportions; the unit of replication is the individual scRNA-seq sample, weighted by the square root of its cell number. The error bars show the propagated standard error of that ratio (see Methods). Significance was determined by two-sided weighted Welch t-tests, with Benjamini–Hochberg adjustment within each parent lineage; the colour denotes adjusted P < 0.05. All samples are biologically independent; n = 859–1,777 (a), 311–658 (b) and 48–108 (c) samples per parent lineage. Exact n, group means, standard errors, fold enrichments with 95% confidence intervals, test statistics and exact P values are provided in Supplementary Table 8. d, Immunofluorescence for apCAFs (PDGFRα+HLA-DR+ co-staining) in tumour and matched tumour-adjacent tissue from PDAC, CRC and PTC. The white boxes mark co-staining. n = 7 PDAC, 3 CRC and 3 PTC biologically independent specimens; each was stained and imaged once, with comparable patterns within each tumour type. Scale bars, 100 µm. e, Pseudotemporal manifold from a published PDAC dataset62, with yellow indicating ECM regions of high pseudotime and blue showing low pseudotime (left). UMAP is coloured by overall survival; higher pseudotime accompanies shorter survival (right). f, PDAC tissue microarray with haematoxylin and eosin (H&E) staining (left) and ECM pseudotime (right); the blue and yellow boxes mark the low-pseudotime and high-pseudotime regions shown in panels g,h. Scale bar, 200 µm. g,h, Histology and CODEX of those regions with low matrix pseudotime and good patient survival (g) and high matrix pseudotime and poor patient survival (h). H&E (top left); remaining panels, CODEX for the indicated markers. The white boxes mark putative apCAFs: HLA-DR+ spindle-like cells in areas of high COL1A1/αSMA expression without tumour or other immune markers. CODEX was performed on n = 3 biologically independent PDAC specimens, each analysed once in a single multiplexed run. Scale bars, 50 µm.
Focusing on the iCAF compartment, our atlas revealed two distinct and conserved transcriptional states: ISG15+ iCAFs exhibiting canonical interferon-γ (IFNγ) stimulation (for example, CXCL10)44, and CXCL8+ iCAFs expressing pro-inflammatory cytokines (for example, CXCL1)41. Crucially, these iCAF subpopulations provide additional granularity compared with previously reported CXCL12+ iCAFs39. Recent consensus frameworks have identified CXCL12 to be among the steady-state fibroblast hallmark genes rather than specific to a malignancy-induced inflammatory CAF state25. In line with this, our CXCL14+ ssCAFs co-expressed high levels of CXCL12 while maintaining a homeostatic signature. Abundance analyses revealed divergent ssCAF dynamics: conventional PI16+ ssCAFs (which also strongly express CXCL12) were heavily enriched in non-malignant tissue (2.8-fold), potentially representing a progenitor pool, whereas the CXCL14+ pool remained proportionally stable across benign and malignant tissues (1.0-fold), typifying embedded parenchymal fibroblasts. We therefore propose that traditional ‘CXCL12+ iCAFs’ are more accurately classified as tissue-resident CXCL14+ ssCAFs.
To elucidate the regulatory networks driving these distinct states, we examined transcription factor activity using SCENIC. The apCAF population exhibited elevated inferred activity of RUNX3 and IKZF1, regulators of MHC class II expression45, suggesting a mechanism for direct T cell interaction and immunotherapy resistance (Extended Data Fig. 5a). The ISG15+ iCAFs showed predicted activation of ETV7 and IRF2, implicating suppressive cytokine signalling in tumour progression46 (Extended Data Fig. 5b). Both mCAF populations were enriched for CREB3L1 and NKX3-2, linked to ECM overexpression and stiffness (Extended Data Fig. 5c). Conversely, ssCAF populations exhibited higher predicted activity of CEBPA and FOXO3, which regulate lineage and redox homeostasis, respectively, consistent with the homeostatic properties ascribed to this population26 (Extended Data Fig. 5d). Overall, these regulatory profiles broadly align with the putative functional roles attributed to each CAF subpopulation.
To evaluate whether specific populations could be distinguished by differences in metabolic programs, we applied scMetabolism to analyse our scRNA-seq dataset. Of note, we observed that LRRC15+ mCAFs were enriched for genes associated with elevated oxidative phosphorylation, in contrast to the traditional glycolytic programs of ISG15+ iCAFs (Extended Data Fig. 5e,f and Supplementary Fig. 5a–c). These profiles align with the distinct energy demands of each cell type: iCAFs expressed genes linked with rapid glycolytic ATP generation that would permit overproduction of pro-inflammatory cytokines, whereas mCAFs were predicted to utilize the more efficient oxidative phosphorylation, enabling them to sustain intense ECM production and remodelling driving the desmoplastic response to neoplasia47. ssCAFs exhibited globally lower expression of metabolic pathway genes, reinforcing their relatively quiescent state.
To determine whether these distinct functional and metabolic states ultimately impact patient survival, we paired bulk RNA-seq and clinical outcome data from The Cancer Genome Atlas (TCGA) using CIBERSORTx deconvolution (Supplementary Table 9 and Supplementary Fig. 6a,b). Patients whose tumours were estimated to have higher abundances of apCAFs, iCAFs or mCAFs exhibited worse overall survival across most cancer types, consistent with previous observations48. By contrast, we observed a positive (but not statistically significant; 1.3-fold, P = 0.27) relationship between CXCL14+ ssCAF proportion and patient survival. Together, these results suggest that fibroblast differentiation and lineage progression may be associated with worse outcomes in solid-organ tumours, reflecting a pro-tumorigenic role for apCAFs, iCAFs and mCAFs.
Endothelial, mural and nerve cells
Beyond fibroblasts, we examined tumour endothelial, mural and nerve cells, which drive angiogenesis, cytokine signalling and metastatic spread1,7,8,49. In silico isolation of endothelial cells (Extended Data Fig. 1a–j) identified five pan-cancer subpopulations (Fig. 2e): GJA5+ arterial, CA4+ capillary, PROX1+ lymphatic, ESM1+ tip and ACKR1+ venous. All expressed canonical markers (PECAM1, VWF and CDH5) and lacked non-endothelial signatures (Extended Data Fig. 4b, Supplementary Table 6 and Supplementary Fig. 7). Of note, angiogenic ESM1+ tip cells50 were the sole endothelial subpopulation significantly enriched in tumours versus non-malignant tissue (1.7-fold; Fig. 3a and Supplementary Table 8), reflecting dysfunctional tumour neovascularization51. These tip cells, co-expressing FLT1 (VEGFR1) and KDR (VEGFR2), were significantly elevated in treatment non-responsive tumours (1.9-fold; Fig. 3c). Furthermore, they correlated with elevated metabolic activity (Extended Data Fig. 5g and Supplementary Fig. 5d) and worse overall survival across most TCGA cohorts (Supplementary Fig. 6b). These data reinforce the pro-tumorigenic role of tip cells7,52,53, which may continuously support growth by rapidly initiating marginal angiogenesis, highlighting them as candidate targets for multi-drug therapy.
Subclustering of pan-cancer mural cells delineated six distinct subpopulations (Fig. 2f): CCL2+, CD248+ and ISG15+ pericytes; RERGL+ and WFDC1+ vascular smooth muscle cells; and DES+ visceral smooth muscle cells. All expressed canonical markers (RGS5, PDGFRB and CSPG4) and lacked non-mural signatures (Supplementary Table 6 and Supplementary Fig. 8). ISG15+ and CD248+ pericytes, alongside WFDC1+ vascular smooth muscle cells, were significantly enriched in tumours versus non-malignant tissue (4.5-fold, 1.8-fold and 1.2-fold, respectively; Fig. 3a and Supplementary Table 8), with ISG15+ pericytes also exhibiting elevated overall metabolic activity (Extended Data Fig. 5h). Clinically, CD248+ pericytes correlated with poor treatment response (1.8-fold; Fig. 3c). Mechanistically, both tumour-enriched pericyte populations expressed ECM genes (COL1A1, COL3A1 and COL4A1), supporting a role in tumour desmoplasia (Supplementary Fig. 5e,f). Of note, PIEZO2, which encodes a mechanotransduction channel, was detected in a small subset of CD248+ pericytes and was not detected in other mural populations (Supplementary Fig. 8). Detection was sparse and expression levels were low, indicating selective rather than robust population-specific expression. Given the established role of PIEZO2 in cellular mechanosensation54, we hypothesize that this fraction of pro-fibrotic pericytes may be activated by the stiffened TME to further upregulate ECM production, a possibility that merits further investigation.
Finally, we analysed tumour-associated nerve cells, filtering out neural crest cancers to avoid transcriptional overlap with nerve-based tumours49. Our analysis revealed three distinct subpopulations and their canonical markers: MLANA+ melanocytes, MPZ+ myelinating Schwann cells and NGFR+ non-myelinating Schwann cells (Fig. 2g, Supplementary Table 6 and Supplementary Fig. 9). Subpopulation proportions varied markedly across tumour types (Fig. 2g, bottom). Because this heterogeneity probably reflects both tissue-specific neural architecture and the general rarity of nerve cells in standard biopsies, these populations were omitted from subsequent downstream analyses.
Immune cells
Comprising over 2.4 million cells, immune cells constituted the largest TME compartment in our atlas. In silico isolation broadly segregated these into lymphoid and myeloid lineages. Focusing first on lymphoid cells—primary mediators of antitumour immunity55—we identified 11 subpopulations: CD4+ (3) and CD8+ (3) T cells, natural killer cells (1), B cells (3) and plasma cells (1; Fig. 2h, Supplementary Table 6 and Supplementary Fig. 10). Nearly all T cell populations were significantly enriched in tumours (Fig. 3a). This was driven primarily by CD8+ISG15+ IFN-primed T cells (2.4-fold) and CD8+GZMB+ tumour-reactive exhausted T (TEX) cells (1.5-fold). Of note, this GZMB+ population was also significantly enriched in early-stage disease (Fig. 3b), reflecting an initial wave of localized antitumour immunity undergoing rapid, chronic antigen-driven dysfunction56. In addition, FOXP3+ regulatory T cells (1.8-fold) and CXCL13+ follicular helper T cells (1.6-fold) were both enriched in tumours. By contrast, B cell and plasma populations were comparatively depleted within the tumour but enriched in non-malignant tissue, probably reflecting peritumoural accumulation and immune exclusion from the tumour core57.
Examining tumour myeloid cells, we identified dendritic cells (three populations), monocytes (two populations), macrophages (four populations), mast cells, neutrophils and osteoclasts (Fig. 2i, Supplementary Table 6 and Supplementary Fig. 11). Most spanned all tumour types, except the tissue-specific osteoclasts (Fig. 2i, bottom). Three macrophage subtypes and LAMP3+ mature immunoregulatory dendritic cells were significantly tumour enriched (Fig. 3a), with SPP1+ and MARCO+ subpopulations further enriched in late-stage disease (Fig. 3b). SPP1+ macrophages (GPNMB+ and APOC1+) are known drivers of desmoplasia and poor clinical outcomes32, whereas late-stage MARCO+ enrichment suggests a specialized role in immunosuppression and hindered phagocytosis. Conversely, C1QC+ macrophages maintain a homeostatic, complement-rich signature (C1QA–C and FOLR2) linked to T cell infiltration and a non-exhausted TME58. LAMP3+ mature immunoregulatory dendritic cells (IDO1+ and CCR7+) represent a critical regulatory checkpoint, limiting cytotoxic T cell activity to facilitate late-stage immune evasion59. Finally, shared ISG15+ ‘IFN-primed’ clusters across both macrophages and T cells suggest a common axis of chronic inflammation driving terminal exhaustion via sustained type I IFN signalling31,32.
To evaluate alignment with broader transcriptional consensus models, we performed quantitative cell-level comparisons against four pan-cancer reference atlases using pairwise expression mapping via our scTME software package60 (Extended Data Fig. 6a–d). Most of our subpopulations exhibited strong, reciprocal alignment with comparable cell types across datasets (for example, PI16+ ssCAFs, LRRC15+ mCAFs, ESM1+ tip cells, C1QC+/SPP1+ macrophages and FOXP3+ regulatory T cells). These comparisons also differentiated several of our newly characterized and finely partitioned subpopulations. The IFN-primed (ISG15+) axis mapped robustly to analogous IFN-activated states across lineages (Extended Data Fig. 6b). In addition, our newly identified ISG15+ pericytes mapped to parent pericytes (Extended Data Fig. 6a) but diverged from CD248+ pericytes in broader TME atlases by lacking myofibroblast overlap, reinforcing their distinct state (Extended Data Fig. 6c,d). Furthermore, CXCL14+ fibroblasts mapped predominantly to non-inflammatory populations—unlike the CXCL8+ and ISG15+ iCAF subpopulations—supporting their separation from canonical iCAFs. Overall, although our TME atlas is broadly congruent with established datasets, our fibroblast and mural subpopulations reflect a uniquely refined, data-driven partitioning with functional relevance.
In vivo mapping of the apCAF compartment
Our meta-analysis identified apCAFs across nearly all evaluated tumour types (Fig. 2d, bottom), far exceeding the limited number of cancers in which they have been validated in vivo6. Therefore, we performed immunohistochemistry to confirm their presence in previously uncharacterized tumour types. Co-staining for the membranous fibroblast marker PDGFRα and the antigen-presenting marker HLA-DR confirmed apCAF presence in human pancreatic ductal adenocarcinoma (PDAC) controls61, as well as in previously non-validated colorectal cancer (CRC) and papillary thyroid cancer (PTC) tissues, as predicted by our atlas (Fig. 3d). To exclude possible immune cell misclassification, we analysed multiplexed spatial proteomic (CODEX) data from human PDAC62. Spindle-like HLA-DR+ cells localized to highly fibrotic (COL1A1+/αSMA+) regions, lacked immune or epithelial markers (Fig. 3g,h), and occupied distinct ECM architectures associated with poor patient outcomes (Fig. 3e,f and Supplementary Fig. 12a–f). We further orthogonally validated apCAF presence using public Xenium spatial transcriptomic datasets63,64 (Supplementary Fig. 13a–c). scRNA-seq revealed only a modest correlation between apCAF and T cell abundances in tumour samples (Supplementary Fig. 14a), suggesting that apCAF expansion occurs regional to but independent of direct T cell support. By contrast, ISG15+ iCAFs strongly correlated with CD8+ISG15+ IFN-primed T cells (Supplementary Fig. 14b), supporting our hypothesis that this CAF population interacts with T cells to drive exhaustion and promote immune evasion.
Cell–cell communication patterns
To infer interaction networks, we paired CellChat receptor–ligand predictions with orthogonal NicheNet modelling of downstream transcriptional targets. Because multiple lineages harboured ISG15+ clusters, we first evaluated the IFNγ network. CellChat predicted robust signalling from CD8+GZMB+ tumour-reactive TEX cells to ISG15+ iCAFs (Fig. 4a), which was corroborated by NicheNet (Fig. 4b). These aligned predictions support the hypothesis that ISG15+ iCAFs act as direct responders to chronic, T cell-derived IFNγ within the TME. Applying this approach to explore drivers of dysfunctional neovascularization, CellChat predicted that ESM1+ endothelial tip cells receive disproportionately high VEGF signalling from tumour-associated macrophages and monocytes (Extended Data Fig. 7a). NicheNet further corroborated this relationship (Extended Data Fig. 7b), successfully recapitulating this established myeloid-driven angiogenic axis using data solely from our atlas65. Conversely, NicheNet did not directly substantiate several other CellChat-predicted receptor–ligand pairings as transcriptional drivers, suggesting that these specific interactions may operate via indirect or non-transcriptional mechanisms (Extended Data Fig. 7c,d and Supplementary Fig. 15a–d).
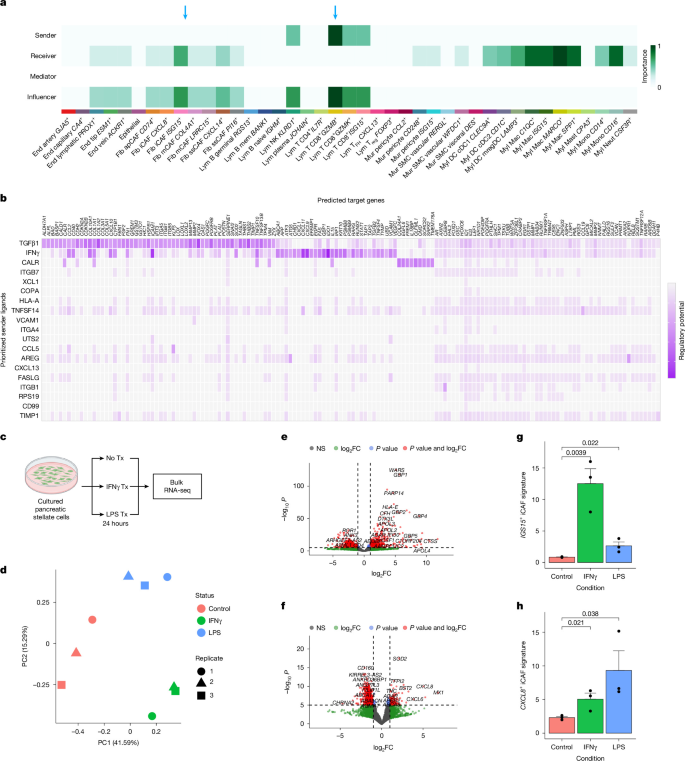
a, CellChat evaluation of the IFNγ signalling pathway network. The heatmap details the relative importance of individual cell populations as senders, receivers, mediators and influencers within the overall IFNγ signalling network. The dark green to black regions indicate strong signalling contributions, whereas the light green to white regions indicate weaker signals. The blue arrows highlight interactions of interest. b, NicheNet heatmap of regulatory potential for T CD8+GZMB+ to ISG15+ iCAF signalling displays prioritized sender ligands on the y axis and their regulatory potential against predicted target genes on the x axis. c, Schematic illustrating the strategy for in vitro experiments in panels d–h. Tx, treatment. Schematic created in BioRender; Wang, H. https://biorender.com/q41gtvr (2026). d, Principal component (PC) analysis plot showing coarse groupings among the nine bulk RNA-seq samples (three conditions; n = 3 replicate cultures per condition, split from a single primary PDAC CAF isolate and treated and sequenced independently). e,f, Volcano plots displaying genes significantly differentially expressed in IFNγ-treated (e) or LPS-treated (f) cells versus untreated control cells. n = 3 replicate cultures per condition, split from a single primary PDAC CAF isolate and treated and sequenced independently. Differential expression was assessed using DESeq2 (v1.38.4) with a two-sided Wald test, and P values were adjusted for multiple comparisons across all 26,363 tested genes using the Benjamini–Hochberg procedure; log2 fold changes (log2FC) were shrunk using lfcShrink. Exact adjusted P values, log2FC and standard errors for all tested genes are provided in Supplementary Table 10. Total n = 17,890 variables. g,h, Bar plots showing the expression strength of gene signatures for the ISG15+ iCAF (g) and CXCL8+ iCAF (h) populations from the atlas across cell culture conditions. Signatures were derived from the average adjusted expression of the top 50 differentially expressed genes in ISG15+ iCAFs (g) or CXCL8+ iCAFs (h) compared with all CAFs. Data are presented as mean ± s.d., with the individual value for each replicate overlaid as a dot; n = 3 replicate cultures per group, split from a single primary PDAC CAF isolate and treated and sequenced independently. Statistical significance was assessed using two-sided unpaired Student’s t-tests (equal variances assumed), and exact P values are displayed above the corresponding comparison bars.
In vitro fibroblast stimulation
The CellChat and NicheNet findings that ISG15+ iCAFs were putatively IFNγ responsive led us to further explore whether IFNγ stimulation could polarize fibroblasts towards the ISG15+ iCAF state. On the basis of the previous work, we also hypothesized that fibroblasts could be activated towards the CXCL8+ iCAF state in response to lipopolysaccharide (LPS) or IL-1 exposure66. To test these hypotheses, we treated cultured human primary pancreatic CAFs with IFNγ, LPS or vehicle control for 24 h, followed by bulk RNA-seq (Fig. 4c,d and Supplementary Fig. 16a). Both treatments successfully upregulated their respective canonical response pathways (Fig. 4e,f, Supplementary Table 10 and Supplementary Fig. 16b,c). Direct gene signature comparisons revealed that the ISG15+ and CXCL8+ iCAF transcriptional profiles were maximally enriched in the IFNγ-treated and LPS-treated cohorts, respectively (Fig. 4g,h). Although this transcriptional concordance is compelling, in vivo CAF phenotypes are undoubtedly shaped by complex, multifactorial microenvironmental cues. Nevertheless, these experiments support the biological relevance of our identified iCAF signatures.
Integration of mouse scRNA-seq datasets
To evaluate the cross-species conservation of these cell subpopulations, we expanded our atlas to include mouse models, the primary experimental system for solid tumour research67. Applying our established analytical framework, we evaluated more than 2.5 million cells across 526 samples from 68 mouse solid tumour datasets (Fig. 1a,b and Supplementary Table 1). To manage the computational scale, individual datasets underwent an identical sketching, three-way integration and full-dataset projection pipeline detailed previously (Extended Data Fig. 8a–c). This parallel approach successfully delineated the same seven major cell lineages observed in the human TME (Extended Data Figs. 8d–f and 9a and Supplementary Table 11), which were highly conserved across nearly all mouse cancer types (Extended Data Fig. 9b,c).
Heterogeneity of mouse stromal cells
Applying our recursive integration and reclustering pipeline to the mouse stromal compartment, we evaluated the heterogeneity of fibroblast, endothelial, mural and nerve populations (Supplementary Table 12). Mouse CAFs segregated into four broad subpopulations corresponding to the human TME: apCAFs, iCAFs, mCAFs and ssCAFs (Extended Data Figs. 9d and 10a and Supplementary Fig. 17). Crucially, the Isg15+ iCAF state, which our human data suggest as a direct responder to chronic IFNγ from tumour-reactive TEX cells, was highly conserved in mice. By contrast, because mice lack a direct CXCL8 orthologue, the second human iCAF state (CXCL8+) aligned with a functionally analogous Spp1+ iCAF population in mice. Furthermore, we did not observe a clear mouse equivalent to the human COL4A1+LRRC15− mCAF population. Both mouse ssCAF subpopulations were broadly conserved; however, the transcriptional equivalent of the human CXCL14+ state was defined primarily by Cxcl12 expression in mice. Of note, mouse apCAFs expressed mesothelial markers such as Msln42, suggesting a potential distinct lineage origin compared with their human counterparts (Extended Data Fig. 10a and Supplementary Fig. 17).
Within the endothelial compartment, we identified subpopulations matching the human TME: artery, capillary, lymphatic, vein and, importantly, Esm1+ tip cells (Extended Data Figs. 9e and 10b and Supplementary Fig. 18). The conservation of these Esm1+ tip cells across nearly all mouse tumour types (Extended Data Fig. 9e′) provides a robust cross-species model for studying the myeloid-driven angiogenic axis identified in our human atlas. Mural cells constituted a smaller fraction of the mouse TME (0.46%) than humans (1.3%), consistent with limited recruitment pools in many mouse hosts68. Nevertheless, we identified conserved mural subpopulations: Ccl2+ pericytes, Cd248+ pericytes and an umbrella group of smooth muscle cells (Extended Data Figs. 9f,f′ and 10c and Supplementary Fig. 19). Finally, as in humans, both myelinating (Mpz+) and non-myelinating (Ngfr+) Schwann cells were present (Extended Data Figs. 9g,g′ and 10d and Supplementary Fig. 20); however, mouse melanocytes were not readily distinguishable in our analysis.
Overall, these tumour stromal subpopulations appear largely conserved across mouse cancer types, and their relative abundances in tumour compared with non-malignant samples mirror those of the analogous human subpopulations (Fig. 3a, Supplementary Table 13 and Supplementary Fig. 21). Isg15+ iCAFs, Esm1+ tip endothelial cells and Cd248+ pericytes were consistently enriched in malignant tissues across both species, reinforcing their conserved roles as foundational components of TME dysfunction.
Heterogeneity of mouse immune cells
Consistent with our human datasets, immune cells constituted the largest component of the mouse TME, with over 749,000 cells recursively isolated into broad lymphoid and myeloid lineages (Extended Data Fig. 1g–j). Among lymphoid cells, we identified seven T cell, two B cell, one natural killer cell and one plasma cell populations, all closely mirroring those identified in humans (Extended Data Fig. 9h,h′ and Supplementary Fig. 22). Crucially, this included a conserved population of exhausted T cells (Pdcd1+ TEX), confirming the presence of the putative upstream signalling drivers of the Isg15+ iCAF inflammatory axis within the mouse atlas. Similarly, mouse myeloid analysis delineated 14 putative subpopulations, composed primarily of dendritic cells, monocytes and macrophages—the conserved source of the myeloid-driven angiogenic signalling to Esm1+ tip cells—alongside mast cells, neutrophils and osteoclasts (Extended Data Fig. 9i,i′ and Supplementary Fig. 23). Overall, these findings underscore the deep transcriptional concordance between the human and mouse immune microenvironments.
Conservation across species
Finally, we assessed the evolutionary conservation of stromal and immune cells between human and mouse tumours. For fibroblasts, we first pooled all 554,238 CAFs isolated from both species and performed orthologue transformation of the mouse data into a shared human gene space. Cells within the resultant datasets were integrated on a per-study basis using Harmony (Fig. 5a, left), demonstrating that CAF subpopulations were largely conserved (Fig. 5a, right). Specifically, the iCAF, mCAF and ssCAF populations overlapped strongly within the integrated uniform manifold approximation and projection (UMAP) embedding, whereas apCAF populations exhibited moderate discordance, possibly reflecting distinct lineage origins tied to Msln expression.
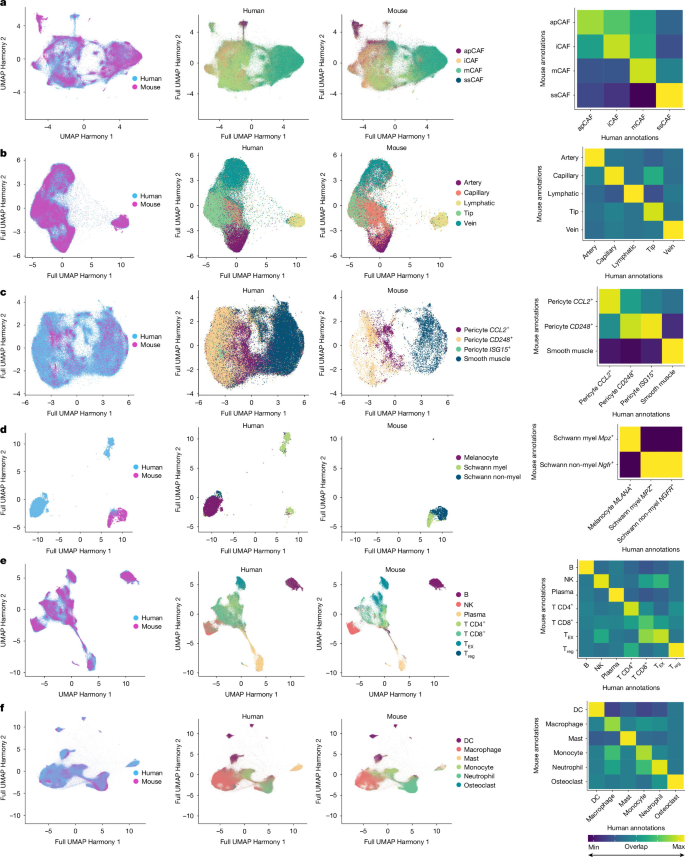
a, Human and mouse CAF atlases were merged and re-integrated using Harmony (left), showing substantial overlap between the human and mouse fibroblast subpopulations (middle). Spearman correlations were calculated based on co-incidence among underlying clusters (right). n = 554,238 cells. b–f, Merged and re-integrated human and mouse tumour atlases for endothelial (b; n = 296,957), mural (c; n = 173,859), nerve (d; n = 10,129), lymphoid (e; n = 1,913,684) and myeloid (f; n = 1,221,301) cells using Harmony, with correlation matrices derived as described for panel a.
We similarly performed integrative cross-species analyses on the endothelial (296,957 cells), mural (173,859 cells) and nerve (10,129 cells) compartments (Fig. 5b–d, left). Endothelial and mural subpopulations proved highly conserved across species (Fig. 5b,c, right). By contrast, within the nerve compartment, only a minor population of Schwann cells exhibited interspecies overlap (Fig. 5d, right). Furthermore, integration of the massive immune TME (1,913,684 lymphoid and 1,221,301 myeloid cells; Fig. 5e,f, left) revealed robust evolutionary conservation of subpopulations across both broad lineages (Fig. 5e,f, right).
To formally quantify this conservation, we evaluated the shared overlap of populations across co-clustering integrations, generating heatmaps as proxies for cellular transcriptomic alignment (Fig. 5a–f, right). An orthogonal analysis utilizing anchor-based label transfer of annotated mouse datasets projected onto their human counterparts yielded parallel results (Supplementary Fig. 24a–f). Both quantitative assessments revealed striking cross-species correlations for all non-nerve subpopulations. In summary, this cross-species integration demonstrates that the core transcriptomic states defining the TME are highly conserved between human and mouse solid tumours.
Discussion
Here we have presented a formal meta-analysis of more than 15 million cells across 42 types of solid tumours in humans and mice, providing unprecedented insight into the highly conserved cellular ecosystem of the TME. By leveraging parallel, semi-orthogonal integration strategies, we established a highly robust, inclusive framework for resolving distinct cluster-wise annotations across massive, heterogeneous datasets. Through this approach, we selectively isolated distinct cell subpopulations within the shared stromal and immune compartments, enabling a pan-cancer mapping of the TME that also captures transitional and peripheral cell states often lost in standard single-pipeline approaches.
By harmonizing our atlas-level clusters with established paradigms13,25,38,39,40,41, we developed a unified framework that resolves the overlapping stromal descriptions in the literature. For fibroblasts, we delineated four overarching superclusters: apCAFs, iCAFs, mCAFs and ssCAFs, as well as multiple subclusters. The massive scale of this atlas allowed us to consolidate previously fragmented nomenclature. For instance, we grouped both classical LRRC15+ myofibroblastic and COL4A1/SPP1+ mechanoresponsive states into a unified mCAF compartment, reflecting their shared ECM-remodelling programming. Furthermore, our orthogonal analyses consistently indicate that the traditional CXCL12+ iCAF state would be better defined as a tissue-resident ssCAF population (CXCL14/CXCL12+), transcriptionally distinct from true inflammatory iCAFs. For endothelial, mural and nerve cells, we have similarly provided nomenclature that clarifies previous descriptions in smaller studies8,52.
A consequence of these refined classifications is the emergence of more precisely specialized cellular states. For example, within the iCAF compartment, we resolved a distinct subpopulation defined by ISG15 expression. These cells are strongly enriched in tumours and across stages of neoplastic growth, exhibit gene expression patterns consistent with receiving IFNγ signalling from T cells and correlate with significantly decreased survival. This suggests that these ISG15+ iCAFs represent an important component of the immunosuppressive TME and a promising therapeutic target.
The identification of ISG15+ iCAFs underscores a primary clinical implication of this atlas: the profound conservation of the stroma suggests that targeting such core populations could yield broadly applicable multicancer therapeutics. By systematically isolating fibroblast, endothelial and mural populations that are distinctly tumour enriched and linked to poor clinical outcomes, this framework transitions from a descriptive atlas to a therapeutic blueprint, offering the potential to selectively modulate pro-tumorigenic stroma while avoiding the off-target toxicity frequently associated with traditional interventions.
Consistent with our findings in the stroma, we observed an equally high degree of conservation within the immune microenvironment of solid tumours, providing a parallel, broadly applicable framework for lymphoid and myeloid populations. Although combinatorial immunotherapies are rapidly being adopted, their efficacy fundamentally hinges on the permissiveness of the TME. Yet, these immune populations are rarely analysed in the context of broader stromal diversity. By establishing a consistent cellular framework across both compartments, we have provided a unified lens to evaluate antitumour immunity within the TME as a whole. As a proof of principle, we have provided supporting evidence for selected immune–stromal interactions predicted by our meta-analysis by eliciting the expected transcriptional shifts within treated stromal cells.
Overall, this study is considerably larger in scope than previous seminal studies in the field. This study also assessed all cells within the TME, whereas most previous work has either examined only single-cell types in isolation or been limited to either the tumour stromal or immune compartments. By establishing the high degree of cross-species conservation between human and mouse TMEs, this atlas bridges a critical gap in translating preclinical models to human disease. We complemented our computational framework with in vitro and in vivo assays to link predicted cellular states with observable tumour biology. Moreover, by codifying these findings into a public toolkit, we have provided a standardized reference framework that enables automated label transfer and reference mapping to assist in analysing new cancer datasets.
This meta-analysis provides a foundational resource for interpreting the cellular diversity of the stromal and immune components of solid tumours. To ensure broad accessibility, we have released an interactive web portal for independent dataset exploration (tmeatlas.stanford.edu) alongside an R package (scTME) designed to systematically project and annotate these classifications onto external datasets. Moreover, the underlying code, including the central pipeline for atlas construction and custom scripts for downstream analysis, is publicly available through a GitHub repository (see Code availability). We hope that this work will facilitate future explorations in cancer biology and promote the development of therapeutic agents to manipulate the complex TME.
Methods
Human and mouse scRNA-seq meta-analysis
To systematically analyse scRNA-seq cancer studies in the public domain, we evaluated all datasets published from January 2014 (when scRNA-seq was first described69) to July 2025. We only included studies using droplet-based methods, which have emerged as the dominant scRNA-seq approach, to minimize potential technique-specific artefacts when analysing integrated data70. Separate queries were evaluated independently for human and mouse datasets in the two largest public scRNA-seq repositories: the GEO71, managed by the National Institutes of Health (NIH), and ArrayExpress72, run by the European Bioinformatics Institute (EBI). Datasets that were specific to either blood or central nervous system cancers, or that failed to meet specific data architecture requirements (see Fig. 1a), were excluded from our analysis. We also excluded studies that removed stromal cells to ensure that these comparatively understudied cell populations were appropriately represented in the final atlas.
Our final comprehensive human TME atlas comprises 2,855 total samples from 190 scRNA-seq datasets. Our mouse atlas contains 526 total samples from 68 scRNA-seq datasets. Both human and mouse integrated TME atlases were generated (separately) using the following steps:
- (1) Comprehensive curation of all publicly available cancer scRNA-seq datasets (Extended Data Fig. 1a).
Comprehensive curation of all publicly available cancer scRNA-seq datasets (Extended Data Fig. 1a).
- (2) Processing, filtering and quality control for individual scRNA-seq datasets (Extended Data Fig. 1b).
Processing, filtering and quality control for individual scRNA-seq datasets (Extended Data Fig. 1b).
- (3) Disk/memory read optimization using the R package BPCells73,74 (Extended Data Fig. 1c,d).
Disk/memory read optimization using the R package BPCells73,74 (Extended Data Fig. 1c,d).
- (4) Sketch-based sampling and integration across datasets using three independent approaches to reduce batch effects: Harmony, FastMNN or scVI75,76,77 (Extended Data Figs. 1e and 2a–f and Supplementary Fig. 1a–d).
Sketch-based sampling and integration across datasets using three independent approaches to reduce batch effects: Harmony, FastMNN or scVI75,76,77 (Extended Data Figs. 1e and 2a–f and Supplementary Fig. 1a–d).
- (5) Supervised annotation and filtering using a combination of canonical marker genes, estimated copy number variation (inferCNV, v1.14.2)78, SingleR79 and scATOMIC27 into seven broad cell types: epithelial, fibroblast, endothelial, mural, nerve, lymphoid and myeloid (Extended Data Fig. 1f and Supplementary Fig. 2).
Supervised annotation and filtering using a combination of canonical marker genes, estimated copy number variation (inferCNV, v1.14.2)78, SingleR79 and scATOMIC27 into seven broad cell types: epithelial, fibroblast, endothelial, mural, nerve, lymphoid and myeloid (Extended Data Fig. 1f and Supplementary Fig. 2).
- (6) Initial pooling of all cells that had been assigned to a given cell type by any one of the three approaches, permitting overlapping annotations (that is, the same cell being initially assigned to more than one cell type; Extended Data Fig. 1g).
Initial pooling of all cells that had been assigned to a given cell type by any one of the three approaches, permitting overlapping annotations (that is, the same cell being initially assigned to more than one cell type; Extended Data Fig. 1g).
- (7) Iterative removal of ‘misassigned’ cells through re-normalization, re-finding of variable features, re-scaling of data, re-performing of PCA, re-integration using Harmony (see the section ‘Selection of Harmony for downstream integration’ below for justification of this selection), re-clustering and re-annotation to generate the final ‘pure’ atlases for fibroblast, endothelial, mural, nerve, lymphoid and myeloid cells (Extended Data Fig. 1h), followed by final annotation of each population (Fig. 2d–i, Extended Data Fig. 1i,j and Supplementary Tables 6 and 7).
Iterative removal of ‘misassigned’ cells through re-normalization, re-finding of variable features, re-scaling of data, re-performing of PCA, re-integration using Harmony (see the section ‘Selection of Harmony for downstream integration’ below for justification of this selection), re-clustering and re-annotation to generate the final ‘pure’ atlases for fibroblast, endothelial, mural, nerve, lymphoid and myeloid cells (Extended Data Fig. 1h), followed by final annotation of each population (Fig. 2d–i, Extended Data Fig. 1i,j and Supplementary Tables 6 and 7).
- (8) Generation of the final pan-cancer, all-cells TME human and mouse atlases.
Generation of the final pan-cancer, all-cells TME human and mouse atlases.
- (9) Cross-species integration of human and mouse TME atlases.
Cross-species integration of human and mouse TME atlases.
These steps are described in detail in the following sections.
Comprehensive curation of all publicly available cancer scRNA-seq datasets
Publicly available human and mouse cancer scRNA-seq datasets were identified by searching two functional genomics databases: GEO and ArrayExpress (Extended Data Fig. 1a). The following search terms were used:
Human GEO: (‘cancer’ OR ‘tumor’ OR ‘tumour’ OR ‘carcinoma’) AND ((‘single cell’ OR ‘single-cell’ OR ‘scRNA’ OR ‘sc-RNA’) OR (‘single nuc’ OR ‘single-nuc’ OR ‘snRNA’ OR ‘sn-RNA’)) AND 2014/01:2025/07[Publication Date] AND ‘Homo sapiens’[organism] AND ‘expression profiling by high throughput sequencing’[DataSet Type].
Mouse GEO: (‘cancer’ OR ‘tumor’ OR ‘tumour’ OR ‘carcinoma’) AND ((‘single cell’ OR ‘single-cell’ OR ‘scRNA’ OR ‘sc-RNA’) OR (‘single nuc’ OR ‘single-nuc’ OR ‘snRNA’ OR ‘sn-RNA’)) AND 2014/01:2025/07[Publication Date] AND ‘Mus musculus’[organism] AND ‘expression profiling by high throughput sequencing’[DataSet Type].
ArrayExpress: (‘cancer’ OR ‘tumor’ OR ‘tumour’ OR ‘carcinoma’) AND ((‘single cell’ OR ‘single-cell’ OR ‘scRNA’ OR ‘sc-RNA’) OR (‘single nuc’ OR ‘single-nuc’ OR ‘snRNA’ OR ‘sn-RNA’)).
A total of 2,168 human and 1,807 mouse datasets were manually screened to identify datasets that met the study inclusion criteria: (1) datasets must contain at least three scRNA-seq samples from primary tumour or non-malignant tissue samples; (2) the scRNA-seq platform must be droplet based (for example, 10X Genomics, Drop-seq, among others); (3) the cancer type must be a non-central nervous system, solid-organ tumour; and (4) the scRNA-seq sample must include at least some stromal cells. The mouse datasets were further screened to meet two additional inclusion criteria: (1) the tumour model must be either a genetically engineered mouse model or an orthotopic cancer cell line mouse model; and (2) the mouse bearing the tumour must not have received treatment. A total of 210 human scRNA-seq datasets and 79 mouse scRNA-seq datasets met these inclusion criteria (Extended Data Fig. 1a).
Data for each dataset were downloaded from their public repositories and converted into base Seurat objects using the functions read10X, read10X_h5, ReadMtx + CreateSeuratObject or read.table + CreateSeuratObject in R (v4.2.2). Each newly created Seurat object (corresponding to a single scRNA-seq sample) was then populated with the relevant sample-level meta-data. This was accomplished by first constructing a single large.csv file containing: the sample name, study name, organ, cancer, site (that is, tumour, tumour-adjacent or non-cancer) and FACS-sorting strategy (if any). For human samples, additional clinical meta-data — including patient age, sex, tumour clinical stage and treatment response — were recorded if available. For all mouse samples, the precise tumour model (for example, MMTV-PyMT) and tumour model type (for example, genetically engineered mouse model) were also recorded. These meta-data were manually collected from the corresponding database entries and articles across all 2,855 human samples and all 526 mouse samples.
Processing and filtering of individual scRNA-seq datasets
Once populated with the above meta-data, samples were then analysed individually for quality control using the Seurat single-cell analysis pipeline (v4.9.9.9050)73. To ensure comparability across datasets, ENSEMBL transcript IDs and gene synonyms were converted to human or mouse gene symbols using biomaRt (v2.56), and only genes found in the human or mouse reference genome GRCh38.p14 or GRCm39 were retained. Afterwards, the raw count matrices for each dataset were confirmed to contain only integer values. Low-quality cells with nFeature_RNA ≤ 200 or nFeature_RNA ≥ 20% mitochondrial reads were then filtered out80 (Extended Data Fig. 1b). To remove potential doublets, data from individual samples were separately exported to Python using the writeH5AD function from the zellkonverter R package, followed by application of the Scrublet function from the Scrublet package81 and exported back to R. Cells ascribed as ‘doublets’ by scrublet using the default parameters were then removed. Finally, all samples from each dataset were merged and ‘flattened’ (using the JoinLayers function) into single Seurat objects for downstream analysis.
Disk read/write optimization and sketch-based sampling
Given the large number of cells (more than 10 million), we used the BPCells package in R to abstract our sparse data matrices using bit-packing compression to minimize disk read/write requirements74 (Extended Data Fig. 1c). All subsequent operations were performed using objects in ‘BPCells format’, with conversion back into memory as dgCMatrix objects only when explicitly required (for example, R functions such as FindAllMarkers, as well as conversion to anndata objects for Python analyses). Conversion into BPCells objects was performed at the per-study level.
Sketch-based sampling and integration across datasets
The human and mouse datasets were separately integrated following the same steps: using Seurat (v4.9.9.9050) on study-level objects, the raw RNA counts were log normalized, and the top 2,000 variable features (highly variable genes) were identified. To improve the computational efficiency of analysing datasets spanning millions of cells, we selected a representative sketch of 1,000 cells per dataset based on the leverage scores calculated for each cell73 (Extended Data Fig. 1d). Using the sketched datasets, variable features were re-identified, expression levels were scaled and PCA was performed (npcs = 30). Next, integration of the sketched data was performed. Given that there is an element of stochasticity to any one method for integration and downstream analyses, which may result in the misclassification of a given individual cell35,79, we initially applied three distinct integration approaches in Seurat: Harmony, scVI and FastMNN (Extended Data Fig. 1e). The batch key for this integration was ‘study’, and no covariate regression was performed for any of the three methods. After each integration approach, UMAP dimensionality reduction was performed (dims = 1:30, min.dist = 0.001), neighbours were found (dims = 1:30) and initial clusters were identified (resolution varied based on dataset). The integration results and clusters from the sketched dataset were then projected onto the full dataset (Supplementary Fig. 2). All steps were performed using Seurat functions (NormalizeData, FindVariableFeatures, SketchData, ScaleData, RunPCA, IntegrateLayers, RunUMAP, FindNeighbours and FindClusters) with default parameters, except as mentioned above.
Supervised annotation
Distinct cell types in each of the Harmony, scVI and FastMNN atlases were identified and grouped into seven broad categories using canonical marker genes in conjunction with SingleR79, scATOMIC27, EnrichR82 and inferCNV78 (Supplementary Fig. 2). The predominant markers for each population were: epithelial cells (EPCAM), fibroblasts (PDGFRA), endothelial cells (PECAM1 (also known as CD31)), mural cells (RGS5), lymphoid cells (CD19 and CD3E), myeloid cells (CD14) and nerve cells (PLP1; Extended Data Fig. 1f).
Initial pooling
To separately generate pan-cancer atlases for human and mouse CAFs, cells identified as fibroblasts by any of the Harmony, scVI or FastMNN algorithms were extracted in silico for further analysis (Extended Data Fig. 1g).
Iterative filtering and final annotation
Using Seurat (v4.9.9.9050) and BPCells74, each cell type (for example, endothelial cells) was split by dataset, the raw RNA counts were log normalized, the top 2,000 variable features (highly variable genes) were identified, expression levels were scaled and PCA (npcs = 30) was performed. Next, integration of the data was performed using Harmony alone (see justification provided in the section ‘Selection of Harmony for downstream integration’). UMAP dimensionality reduction was performed (dims = 1:30, min.dist = 0.001), neighbours were found (dims = 1:30) and clusters were identified. Distinct cell types were annotated using the top 100 marker genes for each cluster, and contaminating non-endothelial clusters were removed. This computational pipeline was iterated four total times to generate the final human pan-cancer endothelial cell atlas and four total times to generate the final mouse pan-cancer endothelial cell atlas (Extended Data Fig. 1h,i). The specific details for the, as an example, human endothelial cell in silico ‘isolation’ are contained within Supplementary Fig. 3. Each subpopulation in the final human and mouse endothelial cell atlases were annotated in a semi-supervised manner using SingleR79, scATOMIC27 and canonical endothelial markers (PECAM1, VWF and CDH5).
The human and mouse pan-cancer fibroblast, mural, nerve, lymphoid and myeloid cell atlases were similarly generated by including cells identified to be the given cell type by any of the three algorithms. The computational pipeline was iterated six, five, four, five and three times to generate the human endothelial, mural, nerve, lymphoid and myeloid cell atlases, respectively. Similarly, the computational pipeline was iterated three, three, two, four and four times to generate the mouse endothelial, mural, nerve, lymphoid and myeloid cell atlases, respectively. The subpopulations in the cell-type atlases were annotated as above (Extended Data Fig. 1j). Downstream analyses were not performed on epithelial cells due to the challenges in distinguishing epithelial from tumour cells in cancers of epithelial origin. It is worth noting that our approach does not explicitly account for the potential presence of ambient RNA within the droplets used to extract transcriptional profiles83. Unfortunately, owing to the format of most publicly available scRNA-seq datasets (lacking ‘unfiltered’ count matrices), robust methods for ambient RNA correction such as CellBender84 or SoupX85 could not be applied.
Generation of the final pan-cancer, all-cells TME atlases
The human cell subpopulation annotations and mouse subpopulation annotations from the six separate cell-type atlases were subsequently mapped back onto the respective all-cells atlases. Cells labelled as epithelial cells in the initial broad categorization in (5) were annotated as epithelial cells. Cells that were filtered out through the iterative cleaning steps were removed. In total, the final human TME atlas had 45 cell populations, and the final mouse TME atlas had 44 cell populations (Fig. 2a and Extended Data Fig. 9a).
Cross-species integration
To evaluate the conservation of cell subpopulations within the TME between humans and mice, the human and mouse cell-type atlases were integrated for each of six primary TME cell types in Seurat (v4.9.9.9050). To perform this integration, orthologue transformation was performed using the convert_mouse_to_human_symbols function in the NicheNet R package (v2.0.4)86 to convert the mouse gene names in the mouse atlases into human orthologue gene names. The six human cell-type atlases were then merged separately with the corresponding mouse cell-type atlas. For each of the combined human–mouse atlases, Seurat (v4.9.9.9050) was used to split the object by dataset, normalize data, find variable features, scale expression levels, perform PCA (npcs = 30), integrate the data using Harmony and perform UMAP dimensionality reduction (dims = 1:30, min.dist = 0.001). To assess human–mouse conservation of cell types, the UMAP results were plotted such that each cell was coloured by the cell-type annotation from the respective human or mouse cell-type atlas (Fig. 5a–f). To assess the quality of this cross-species analysis, we used two approaches. First, we developed a correlation matrix based on co-incidence among underlying clusters (Fig. 5a–f, right); second, we applied anchor-based label transfer to map mouse annotations onto human cells. The latter was performed by separately applying SCTransform in Seurat to both mouse and human objects for each of the principal cell types used in Fig. 5a–f. Then, FindTransferAnchors was applied with dimensions of 1:30, reduction = ‘pca’, followed by TransferData with dimensions of 1:30. No changes to other default parameters were made. Heatmaps of overlap were generated using ggplot2 (Supplementary Fig. 24a–f).
Selection of Harmony for downstream integration
Harmony was selected as the approach for all subsequent downstream integration (beyond the initial first-pass using all three approaches) based on its performance in biological conservation and batch metrics using scIB35 (Supplementary Table 5). For this analysis, Seurat objects integrated by each of the three approaches (Harmony, scVI and FastMNN) were converted into SingleCellExperiment objects using the SingleCellExperiment library. The resulting objects were imported into Python using the anndata2ri package. Individual metrics were then calculated using the scib.metrics function set within scIB.
Downstream analyses using the human pan-cancer TME atlas
The human TME atlas was used to perform six downstream analyses: (1) cell subpopulation enrichment analysis, (2) SCENIC analysis, (3) scMetabolism analysis, (4) TCGA survival analysis, (5) CellChat analysis, and (6) NicheNet analysis. The methods for each of these six analyses are detailed below.
Cell subpopulation enrichment analysis
The relative enrichment of each cell subpopulation in the human scRNA-seq TME atlas was directly calculated for three clinically relevant meta-data categories: between samples from non-malignant tissue versus tumour; between early-stage (I and II) and late-stage (III and IV) tumours; and between treatment responsive and non-responsive tumours. The relative enrichment of each cell subpopulation in the mouse scRNA-seq TME atlas was directly calculated between non-malignant versus tumour tissue. These meta-data were annotated in a consistent manner for each scRNA-seq sample if available in the original article. To calculate relative enrichment for each cell subpopulation, the percentage of cells in each cell subpopulation (for example, ISG15+ iCAFs) out of all cells in the broader cell type (for example, fibroblast) was calculated for each sample. To avoid unstable proportion estimates from sparsely represented samples, any sample contributing 30 or fewer cells to a given parent cell type was excluded from the analysis of the subpopulations of that cell type. This criterion was applied independently for each parent lineage, so the number of samples contributing to a given comparison depends on that lineage and was substantially smaller than the total number of samples in the cohort; within a lineage, the same set of samples contributes to every constituent subpopulation. The exact n for every comparison is reported in the corresponding figure legends and in Supplementary Tables 8 and 13.
Statistical significance for cell subpopulation enrichment was determined using a two-sided weighted Welch t-test for two independent samples (wtd.t.test, weights R package (v1.0.4), with samedata = FALSE), in which the unit of replication was the individual scRNA-seq sample and the tested quantity was the per-sample subpopulation proportion. To account for highly variable single-cell capture rates, sample weights were assigned as the square root of the number of cells per sample. Degrees of freedom were obtained by the Welch–Satterthwaite approximation and are therefore non-integer. Separately, the weighted standard errors of the group means that define the plotted error bars were computed using the Kish effective sample size, neff = (Σw)2/Σw2, which downweights the contribution of samples with disproportionately large cell numbers. Because the cell subpopulations are nested within parent cell types, Benjamini–Hochberg adjustment was applied separately within each parent lineage, so that each family of tests corresponds to the set of subpopulations that partition a single parent cell type; Benjamini–Hochberg adjusted P values computed across all subpopulations simultaneously are additionally reported for completeness. Full statistical outputs for every comparison, including the exact n per group, weighted group means and standard errors, fold enrichment with its 95% confidence interval (obtained by the delta method on the log scale), the t-statistic, the degrees of freedom, and exact raw and adjusted P values, are provided in Supplementary Tables 8 and 13.
SCENIC analysis
SCENIC87 was used to calculate the area under the recovery curve (AUC) for the enrichment of regulons in human scRNA-seq. Seurat objects were generated with AUC scores and clustered by running the standard Seurat pipeline. Differentially expressed regulons were identified by running the FindAllMarkers function and plotted using the standard DimPlot function (Extended Data Fig. 5a–d).
scMetabolism analysis
To evaluate whether specific cell populations may be correlated with differences in metabolic programs, we used the scMetabolism package in R88. Seurat objects for all pooled stromal cell populations (Extended Data Fig. 5e) or individually separate Seurat objects (Extended Data Fig. 5f–h) were evaluated using the sc.metabolism.Seurat function with parameters: method = ‘AUCell’, imputation = F, ncores = 2 and metabolism.type = ‘KEGG’. Using default input pathways of ‘glycolysis/gluconeogenesis’, ‘oxidative phosphorylation’ and ‘citrate cycle (TCA cycle)’, metabolic plots in (Extended Data Fig. 5e–h) were generated using the DotPlot.metabolism function for each population grouping.
TCGA survival analysis
Bulk RNA-seq data from TCGA2 were used to orthogonally calculate the relative enrichment of each cell subpopulation in tumour-adjacent versus tumour samples and to assess the effect of each cell subpopulation on patient survival. TCGA dataset included 9,880 primary tumour and 740 tumour-adjacent samples across 31 solid tumour types, and the dataset was downloaded using TCGAbiolinks (v3.18)2. To deconvolve TCGA bulk RNA-seq data, we first generated a downsampled scRNA-seq reference that contained 1,000 randomly chosen cells for each of the cell subpopulations from the human TME atlas. Using this downsampled scRNA-seq reference, bulk deconvolution using CIBERSORTx with S-mode batch correction was performed for each of the 31 TCGA solid-organ cancer types. The output of bulk deconvolution is an estimate of the percentage of each cell subpopulation in each sample. For each cell subpopulation, the mean and standard error of the cell subpopulation proportions in tumour and tumour-adjacent samples were calculated. The relative enrichment in tumour-adjacent versus tumour samples was computed as the ratio between the two groups (Supplementary Fig. 6a).
The CIBERSORTx cell subpopulation proportion estimates from the tumour samples were additionally used to assess the effect of each cell subpopulation on patient survival. First, for each cell subpopulation, patient tumour samples for each cancer type were stratified into two groups based on the relative proportion of the cell subpopulation. For instance, patients whose tumour samples had a proportion greater than the mean estimated proportion for that subpopulation were considered high-abundance groups, and conversely, patients whose tumour samples had a proportion less than the mean estimated proportion were considered low-abundance groups. Cox regression analysis implemented with the survcomp R package was then used to estimate hazard ratios between high and low expressors for each cancer type by using survival time clinical meta-data from TCGA. A pan-cancer hazard ratio for each cell subpopulation was then estimated by calculating the inverse-variance weighted average of the hazard ratios from each of the 31 cancer types (Supplementary Fig. 6b).
To correct for multiple hypothesis testing, Benjamini–Hochberg adjusted P values were calculated for all comparisons. Full statistical outputs, including fold enrichment or hazard ratio, weighted standard errors and adjusted P values for all clinical group comparisons, are provided in Supplementary Table 9.
CellChat analysis
CellChat (v1.5.0)89 was used to analyse putative cell–cell communication networks among cell subpopulations in our human TME atlas. To perform CellChat, the associated TME Seurat object was first downsampled to only include 100,000 randomly chosen cells, with at least 100 cells per cell subpopulation. The raw counts corresponding to these downsampled data (and their associated meta-data) were extracted from the initial Seurat object and used to populate a new CellChat object. Labels for the non-nerve TME subpopulations were used as groupings. This object was processed through the standard CellChat pipeline, followed by network centrality analysis for pathways of interest (Fig. 4a, Extended Data Fig. 7a,c and Supplementary Fig. 15a).
NicheNet analysis
NicheNet (v2.0.4)86 was used to provide orthogonal support for cell–cell communication networks predicted by CellChat. Seurat objects were downsampled to 100,000 randomly chosen cells (at least 100 per subpopulation), and then fed into NicheNet using sender and receiver populations (as described below) to assess interactions. Regulatory potential heatmaps were generated to visualize these interactions, systematically displaying prioritized sender ligands on the y axis and their regulatory potential against predicted target genes on the x axis. Specifically, this framework was applied to evaluate signalling from: (1) T CD8+GZMB+ cells to ISG15+ iCAFs (IFNγ signalling, Fig. 4b); (2) dendritic cells to ISG15+ iCAFs (MIF signalling; Supplementary Fig. 15b–d); (3) macrophage–monocyte to ESM1+ tip cells (VEGF signalling; Extended Data Fig. 7b); and (4) mural cells to ESM1+ tip cells (Extended Data Fig. 7d).
Histology and immunofluorescence staining
Formalin-fixed, paraffin-embedded (FFPE) tumour and tumour-adjacent tissue blocks were acquired from the Stanford Department of Pathology for seven PDAC, three PTC and three CRC specimens. Immunofluorescence staining was performed on 8-µm histological sections. For immunofluorescence staining, slides were immersed for 10 min in pre-warmed sodium citrate buffer (10 mM, pH 6.0) for antigen retrieval, and slides were blocked for 1 h in Power Block (BioGenex). For PDGFRα–HLA-DR co-localization, slides were incubated overnight at 4 °C with the following primary antibodies: anti-human PDGFRα rabbit monoclonal antibody (3174, CST; clone D1E1E) and anti-human HLA-DR mouse monoclonal antibody (327002, BioLegend; clone LN3). Slides were then incubated for 1 h with the following secondary antibodies: Alexa Fluor 647-conjugated donkey anti-rabbit polyclonal antibody (A-31573, Invitrogen) and Alexa Fluor 555-conjugated donkey anti-mouse polyclonal antibody (A-31570, Invitrogen). Finally, slides were mounted using Fluoromount-G mounting medium with DAPI (00-4959-52, Invitrogen). Fluorescent images at ×20 magnification were acquired with a Leica SP8 inverted confocal microscope.
CODEX and matrix architecture analysis
CODEX/Phenocycler, a highly multiplexed immunofluorescence technique, was previously used to quantify the spatial expression of 30 proteins for 3 PDAC FFPE histological sections by our laboratory90. The CODEX panel assessed expression of several fibroblast markers (αSMA and COL1), an apCAF marker (HLA-DR), immune cell markers (CD11c, CD20, CD68, CD8 and CD4) and epithelial/tumour cell markers (E-cadherin and pan-cytokeratin (CK)). Separately, a fibre quantification algorithm developed by our laboratory was previously used to quantify the matrix architecture from 85 FFPE PDAC specimens91. In brief, 8-µm haematoxylin and eosin (H&E)-stained histological sections were imaged at ×40, and 354,838 200 × 200 µm image tiles were programmatically generated. Afterwards, the histological architecture was quantified for each tile by examining 147 fibre features, and UMAP dimensionality reduction and trajectory analysis using Monocle3 were performed to assign pseudotime values to individual H&E tiles, with high average matrix pseudotime for a given patient correlating with worse patient survival. To examine the matrix architecture in the CODEX sections, 8-µm histological sections consecutive to the CODEX sections were previously stained with H&E, and 200 × 200 µm image tiles were previously analysed using the fibre quantification algorithm. The H&E tiles were spatially aligned with the CODEX sections using GIMP to generate a spatial map of matrix pseudotime for each of the three CODEX sections. In this present study, the CODEX Multiplex Analysis Viewer was used to visualize the multiplex immunofluorescence staining for 11 protein markers in regions of high and low matrix pseudotime in three PDAC CODEX sections. Spindle-like HLA-DR+αSMA+COL1+CD68−CD11c−CD20−CD8−CD4−E-cadherin−pan-CK−CD31− cells were identified by inspection.
Analysis of publicly available Xenium data
To provide further validation for our immunofluorescence and CODEX observations above, we used a publicly Xenium dataset from the 10X Genomics website: Pancreatic Cancer with Xenium Human Multi-Tissue and Cancer Panel (https://www.10xgenomics.com/datasets/pancreatic-cancer-with-xenium-human-multi-tissue-and-cancer-panel-1-standard; dataset listing: https://www.10xgenomics.com/datasets?query=Xenium). The scRNA-seq reference was constructed by selecting cell populations from our initial global populations with our fibroblast subtyping. For deconvolution, the NiCo 1.1.0 pipeline63 was implemented as recommended by filtering and normalizing the reference dataset and Xenium ST datasets, finding commonly shared genes, performing SCTransform from Scanpy, and Leiden clustering the Xenium data at a resolution of 0.7. Then, the find_anchor_cells_between_ref_and_query and nico_based_annotation function was run to find anchors between the reference and Xenium ST datasets with a spatial dispersion cut-off of 0.15. Colocalization of genes (transcripts) and populations (labelled cells) were then used to generate the accompanying figures.
Stimulation of human primary PDAC CAFs and bulk RNA-seq
Primary CAFs were isolated using the Miltenyi Biotec Tumor Dissociation Kit (130-095-929) from one fresh pancreatic PDAC surgical specimen under an institutional review board (IRB)-approved protocol, with informed consent obtained preoperatively under Stanford’s IRB-65893 (ref. 92). The donor was one male patient. No established or immortalized cell lines were used in this study; fibroblast identity follows from the primary outgrowth isolation protocol of ref. 92 and was not separately confirmed by marker analysis. The cultures were not tested for mycoplasma contamination. Isolated CAFs were cultured for four passages in DMEM/F-12 with GlutaMAX (10565018, Gibco), 10% FBS (16000044, Gibco), 1% antibiotic–antimycotic (B22110, R&D) and 0.2% primocin (ant-pm-05, InvivoGen). Passage 4 cells (105 cells per replicate; n = 3 replicates per condition) were allowed to adhere for 12 h, after which cells were treated for 24 h with control media, recombinant human IFNγ (20 ng ml−1; 285-IF, R&D) or LPS (100 ng ml−1; tlrl-eblps, InvivoGen). Cells from a single passage-4 pool were split into nine plates, which were not further passaged, and each plate was then treated and sequenced independently (three plates per condition). RNA was then extracted using TRIzol (15596026, Invitrogen). Nine RNA-seq libraries were prepared with the NEBNext Ultra II Directional RNA Library Prep Kit for Illumina (E7760, NEB) following the manufacturer’s protocol for the NEBNext rRNA Depletion Kit v2 (human/mouse/rat) (E7400L, NEB).
For each library, 50 ng of each replicate was used as input. During the adaptor ligation step, Singular Genomics Universal Library Prep Adapter (#700110) was used to adapt libraries to be sequenced on the Singular Genomics G4 sequencer. PCR enrichment of adaptor-ligated DNA was performed for 12 cycles. No index reads were performed (read 1, 75 bp; read 2, 75 bp; no index cycles), as each library was sequenced in a dedicated lane. All RNA-seq libraries were sequenced on a G4 sequencer instrument for paired-end 2 × 75 bp sequencing, across three sequencing runs performed on the same day, with a single library sequenced per lane (nine lanes in total).
Bulk RNA-seq data were extracted from the sequencer as per-lane fastq files, one library per lane and transferred to the Stanford SCG server. Individual fastq files were aligned to the human GRCh37-hg19 reference genome using TopHat (v2.0.13), resulting in nine counts matrices (n = 3 biological replicates for each of the three experimental groups). These data were read into R using the base read.delimn function, were merged into a single matrix using cbind, and then were annotated according to sample name, replicate and condition. To compute the top differentially expressed genes between each pair of conditions, counts per million (CPM) normalization was first performed on the counts matrices using the cpm function. A gene threshold of at least 2 samples with at least 0.5 CPM was used, resulting in 26,363 genes being preserved for downstream analyses. PCA was performed using prcomp, and the log-transformed PCA data were plotted using autoplot. Differentially expressed genes between groups were determined using DESeq2 (v1.38.4), with its functions calcNormFactors, esimateCommonDisp, estimageGLMTrededDisp, estimatedTagwiseDisp, DESeq and lfcShrink. Volcano plots of the resulting resLFC objects were then generated using EnhancedVolcano (v1.13.2). The biological coefficient of variation was calculated using plotBCV (Supplementary Fig. 16a). EnrichR analyses were performed on the top 200 genes upregulated following treatment with either IFNγ or LPS (Supplementary Fig. 16b,c).
To generate a signature for ISG15+ and CXCL8+ iCAFs, the top 50 genes defining the ISG15+ iCAF and CXCL8+ iCAF subpopulations were first identified using the FindAllMarkers function. To calculate a signature score for each iCAF subpopulation, the expression values of the 50 marker genes in each sample was examined. First, to equally weight the 50 marker genes, row-wise normalization of the counts matrix was performed (for example, Vi,j = Vi,j/Σ(Vi)). Then, to calculate the signature score for each iCAF subpopulation, the normalized expression values for the 50 marker genes were summed for each sample. Standard deviation and standard error were then computed based on the dispersal of cluster signature scores for biological replicates in each condition.
Comparison of our human TME annotations to other large atlases
We examined four large, recent TME atlases published by Nofech-Mozes et al.27, Nieto et al.28, Kang et al.20 and Han et al.21. For each atlas, we downloaded the corresponding full atlas object from its respective repository and converted to SingleCellExperiment objects. Large datasets were downsampled to 50,000 cells. The scTME toolkit was then applied to blindly annotate each cell separately within the query dataset according to cell populations from our TME atlas. The resulting predictive scTME annotations were then compared against the annotations provided for that specific dataset, and heatmaps were generated based on co-incidence.
scTME
Using this large atlas, we developed a new R package, scTME, that utilizes population-level data to provide probability estimates for the annotation of cells within a given cluster in a candidate dataset. This package utilizes many of the classification functions within the SingleR toolkit79, which is a prerequisite for scTME. The program takes a single required input:
- (1) A query dataset (obj), supplied as either a Seurat object or a SingleCellExperiment object of genes (g) × cells (c) dimensions. Data that have not been log normalized are normalized automatically. All remaining inputs are optional.
A query dataset (obj), supplied as either a Seurat object or a SingleCellExperiment object of genes (g) × cells (c) dimensions. Data that have not been log normalized are normalized automatically.
All remaining inputs are optional.
- (2) An optional reference dataset (ref). When omitted, the integrated human TME atlas distributed with the package is used.
An optional reference dataset (ref). When omitted, the integrated human TME atlas distributed with the package is used.
- (3) An optional vector of cluster labels (clusters), of (1 × c) dimensions, or the name of a metadata column containing them, corresponding to the cell groupings over which the object will be evaluated. When supplied, annotation was performed at the level of these groupings and the assigned label was propagated to each constituent cell; when omitted, each cell was annotated individually.
An optional vector of cluster labels (clusters), of (1 × c) dimensions, or the name of a metadata column containing them, corresponding to the cell groupings over which the object will be evaluated. When supplied, annotation was performed at the level of these groupings and the assigned label was propagated to each constituent cell; when omitted, each cell was annotated individually.
- (4) An optional factor (level) that was set to 2 by default, corresponding to the 45 subpopulations defined in Fig. 2a,d–i. It can alternatively be switched to one, in which case the output will correspond to the seven broad cell types defined in Fig. 2a.
An optional factor (level) that was set to 2 by default, corresponding to the 45 subpopulations defined in Fig. 2a,d–i. It can alternatively be switched to one, in which case the output will correspond to the seven broad cell types defined in Fig. 2a.
- (5) An optional parameter, label.col, naming the column of reference metadata from which labels were drawn, for use when a custom reference is supplied.
An optional parameter, label.col, naming the column of reference metadata from which labels were drawn, for use when a custom reference is supplied.
- (6) An optional threshold, max.cells (default 50,000), above which the data will be randomly subsampled to a final object with the number of cells equal to max.cells
An optional threshold, max.cells (default 50,000), above which the data will be randomly subsampled to a final object with the number of cells equal to max.cells
- (7) An optional parameter, return.details (default = FALSE), which will output the scoring matrices in addition to the final cell annotations.
An optional parameter, return.details (default = FALSE), which will output the scoring matrices in addition to the final cell annotations.
The output of the program is:
- (1) A (1 × c dimensional) label vector corresponding to the annotations assigned to each cell, based on their original input grouping and the output annotated to each grouping.
A (1 × c dimensional) label vector corresponding to the annotations assigned to each cell, based on their original input grouping and the output annotated to each grouping.
- (2) A scoring matrix corresponding to the probabilities assessed to each group-level assignment. This is only returned if return.details = TRUE. If so, these two outputs are returned as a list.
A scoring matrix corresponding to the probabilities assessed to each group-level assignment. This is only returned if return.details = TRUE. If so, these two outputs are returned as a list.
Details of the code itself can be found within the GitHub documentation (https://github.com/michaeljanuszyk/scTME) and it can be installed using the devtools library in R with: install_github(‘michaeljanuszyk/scTME’).
Illustration
Original illustrations were drawn using an Apple iPad Pro and Apple Pencil 2.0 in Procreate (v5.2.7) software. Post-editing adjustments of parameters such as brightness, contrast and saturation were applied in Adobe Photoshop (v23.4.2). Finally, text and object overlays were added to the figures using Biorender (https://biorender.com; see relevant figure legends for licenses).
Statistics and reproducibility
No statistical method was used to predetermine sample size. For the meta-analysis, sample size was determined by the number of published scRNA-seq datasets meeting the inclusion criteria defined in Fig. 1a. No data were excluded from the analyses other than by the pre-specified dataset-level and cell-level quality control criteria described above. No randomization was used. For the meta-analysis, all published datasets meeting the inclusion criteria were included, so no allocation step arose. For the in vitro experiments, the replicate cultures were assigned to the control, IFNγ and LPS conditions without randomization and handled in parallel. Unless stated otherwise in the corresponding figure legend, all statistical tests were two-sided and all P values were adjusted for multiple comparisons using the Benjamini–Hochberg procedure. Exact adjusted P values are reported in Supplementary Tables 8–10 and 13.
Cell subpopulation enrichment analyses (Fig. 3a–c and Supplementary Fig. 21) were performed using a two-sided weighted Welch t-test for two independent samples, in which the unit of replication was the individual scRNA-seq sample and sample weights were equal to the square root of the number of cells per sample, with Welch–Satterthwaite degrees of freedom. Within each parent lineage, these analyses were restricted to samples contributing more than 30 cells to that lineage. Sample numbers therefore differ between lineages and are stated per lineage in the legend of Fig. 3 and for every individual comparison in Supplementary Table 8.
Across all lineages, the number of contribution samples are 859–1,777 (Fig. 3a), 311–658 (Fig. 3b) and 48–108 (Fig. 3c) samples per parent cell lineage. Exact values per lineage are given in Supplementary Table 8. No statistic reported in this study is derived from fewer than three biologically independent samples per group. Within a given lineage, the same set of samples contributes to every constituent subpopulation. Benjamini–Hochberg adjustment was applied separately within each parent lineage. No statistics were derived from any comparison with fewer than three biologically independent samples per group. TCGA deconvolution analyses (Supplementary Fig. 6) used n = 9,880 primary tumour and 740 normal samples across 31 solid tumour types, with hazard ratios estimated by Cox regression and pooled across cancer types by inverse-variance weighting.
Immunofluorescence co-staining for PDGFRα and HLA-DR (Fig. 3d) was performed on n = 7 biologically independent PDAC, n = 3 biologically independent CRC and n = 3 biologically independent PTC specimens from patients, together with matched tumour-adjacent tissue. Each specimen was stained and imaged once, and comparable staining patterns were observed across all specimens of a given tumour type; the images shown are representative. CODEX analyses (Fig. 3f–h) were performed on n = 3 biologically independent PDAC specimens, each analysed once within a single multiplexed imaging run, with comparable findings in each; the images shown are representative. Spindle-like HLA-DR+αSMA+COL1+ cells negative for tumour and other immune cell markers were identified by visual inspection. Investigators were not blinded to matrix pseudotime region assignment, which was determined programmatically by the fibre quantification algorithm before inspection.
The in vitro CAF stimulation experiment (Fig. 4d–h and Supplementary Fig. 16) was performed with n = 3 replicate cultures per condition, split from a single primary PDAC CAF isolate and treated and sequenced independently. Differential expression between conditions was assessed using DESeq2 (v1.38.4) with a two-sided Wald test and Benjamini–Hochberg adjustment across the 26,363 genes passing the expression threshold. iCAF signature scores (Fig. 4g,h) are presented as mean ± s.d. of the three replicate cultures, with individual replicate values overlaid, and were compared using two-sided unpaired Student’s t-tests (equal variances assumed). Investigators were not blinded during the in vitro experiments, as all readouts were quantitative and derived computationally from sequencing data.
Ethics statement
FFPE tumour and tumour-adjacent tissue specimens were obtained from the pathology repository of the Stanford University Department of Pathology. No human participants were recruited for the purpose of this study, and all sample collection was performed with the approval of the IRB of the Stanford University School of Medicine. All tissue specimens were coded and de-identified before further processing, in accordance with patient privacy regulations. No animal experiments were performed in this study; all mouse single-cell RNA-seq data analysed here are previously published and were generated under the approvals reported in their original publications. The fresh PDAC surgical specimen used for primary CAF isolation was collected under Stanford IRB protocol IRB-65893, with informed consent obtained preoperatively. All previously published single-cell RNA-seq datasets analysed in this study were obtained from public repositories and were generated under the approvals reported in their original publications.
Reporting summary
Further information on research design is available in the Nature Portfolio Reporting Summary linked to this article.