Release: datasette-maplibre 0.1a0 The first new Datasette geospatial plugin in quite a while! This one combines the excellent MapLibre GL library with OpenFreeMap , the free vector map server operated by Zsolt Ero (you should sponsor Zsolt on GitHub .) I built most of this with a single prompt to Claude Fable 5.2: Look at datasette-cluster-map and datasette-leaflet-geojson plugins, then look at ~/dev/tools/openfreemap-demo.html - then build a brand new Datasette plugin that uses maplibreGL and openfreemap and combines the features of those other two plugins - but be creative and think outside the box for other useful features the plugin might have "Be creative and think outside the box" resulted in a few neat ideas - my favorite is that it displays SVG previews of GeoJSON shapes, then loads a WebGL preview only when they scroll into view. I also had Claude build a comprehensive demo which works in the latest Datasette Lite, so you can visit this link to load the plugin and a demo datab…
Original text(via Simon Willison)
The first new Datasette geospatial plugin in quite a while! This one combines the excellent MapLibre GL library with OpenFreeMap, the free vector map server operated by Zsolt Ero (you should sponsor Zsolt on GitHub.)
I built most of this with a single prompt to Claude Fable 5.2:
Look at datasette-cluster-map and datasette-leaflet-geojson plugins, then look at ~/dev/tools/openfreemap-demo.html - then build a brand new Datasette plugin that uses maplibreGL and openfreemap and combines the features of those other two plugins - but be creative and think outside the box for other useful features the plugin might have
"Be creative and think outside the box" resulted in a few neat ideas - my favorite is that it displays SVG previews of GeoJSON shapes, then loads a WebGL preview only when they scroll into view.
I also had Claude build a comprehensive demo which works in the latest Datasette Lite, so you can visit this link to load the plugin and a demo database in your browser via Pyodide and WebAssembly.
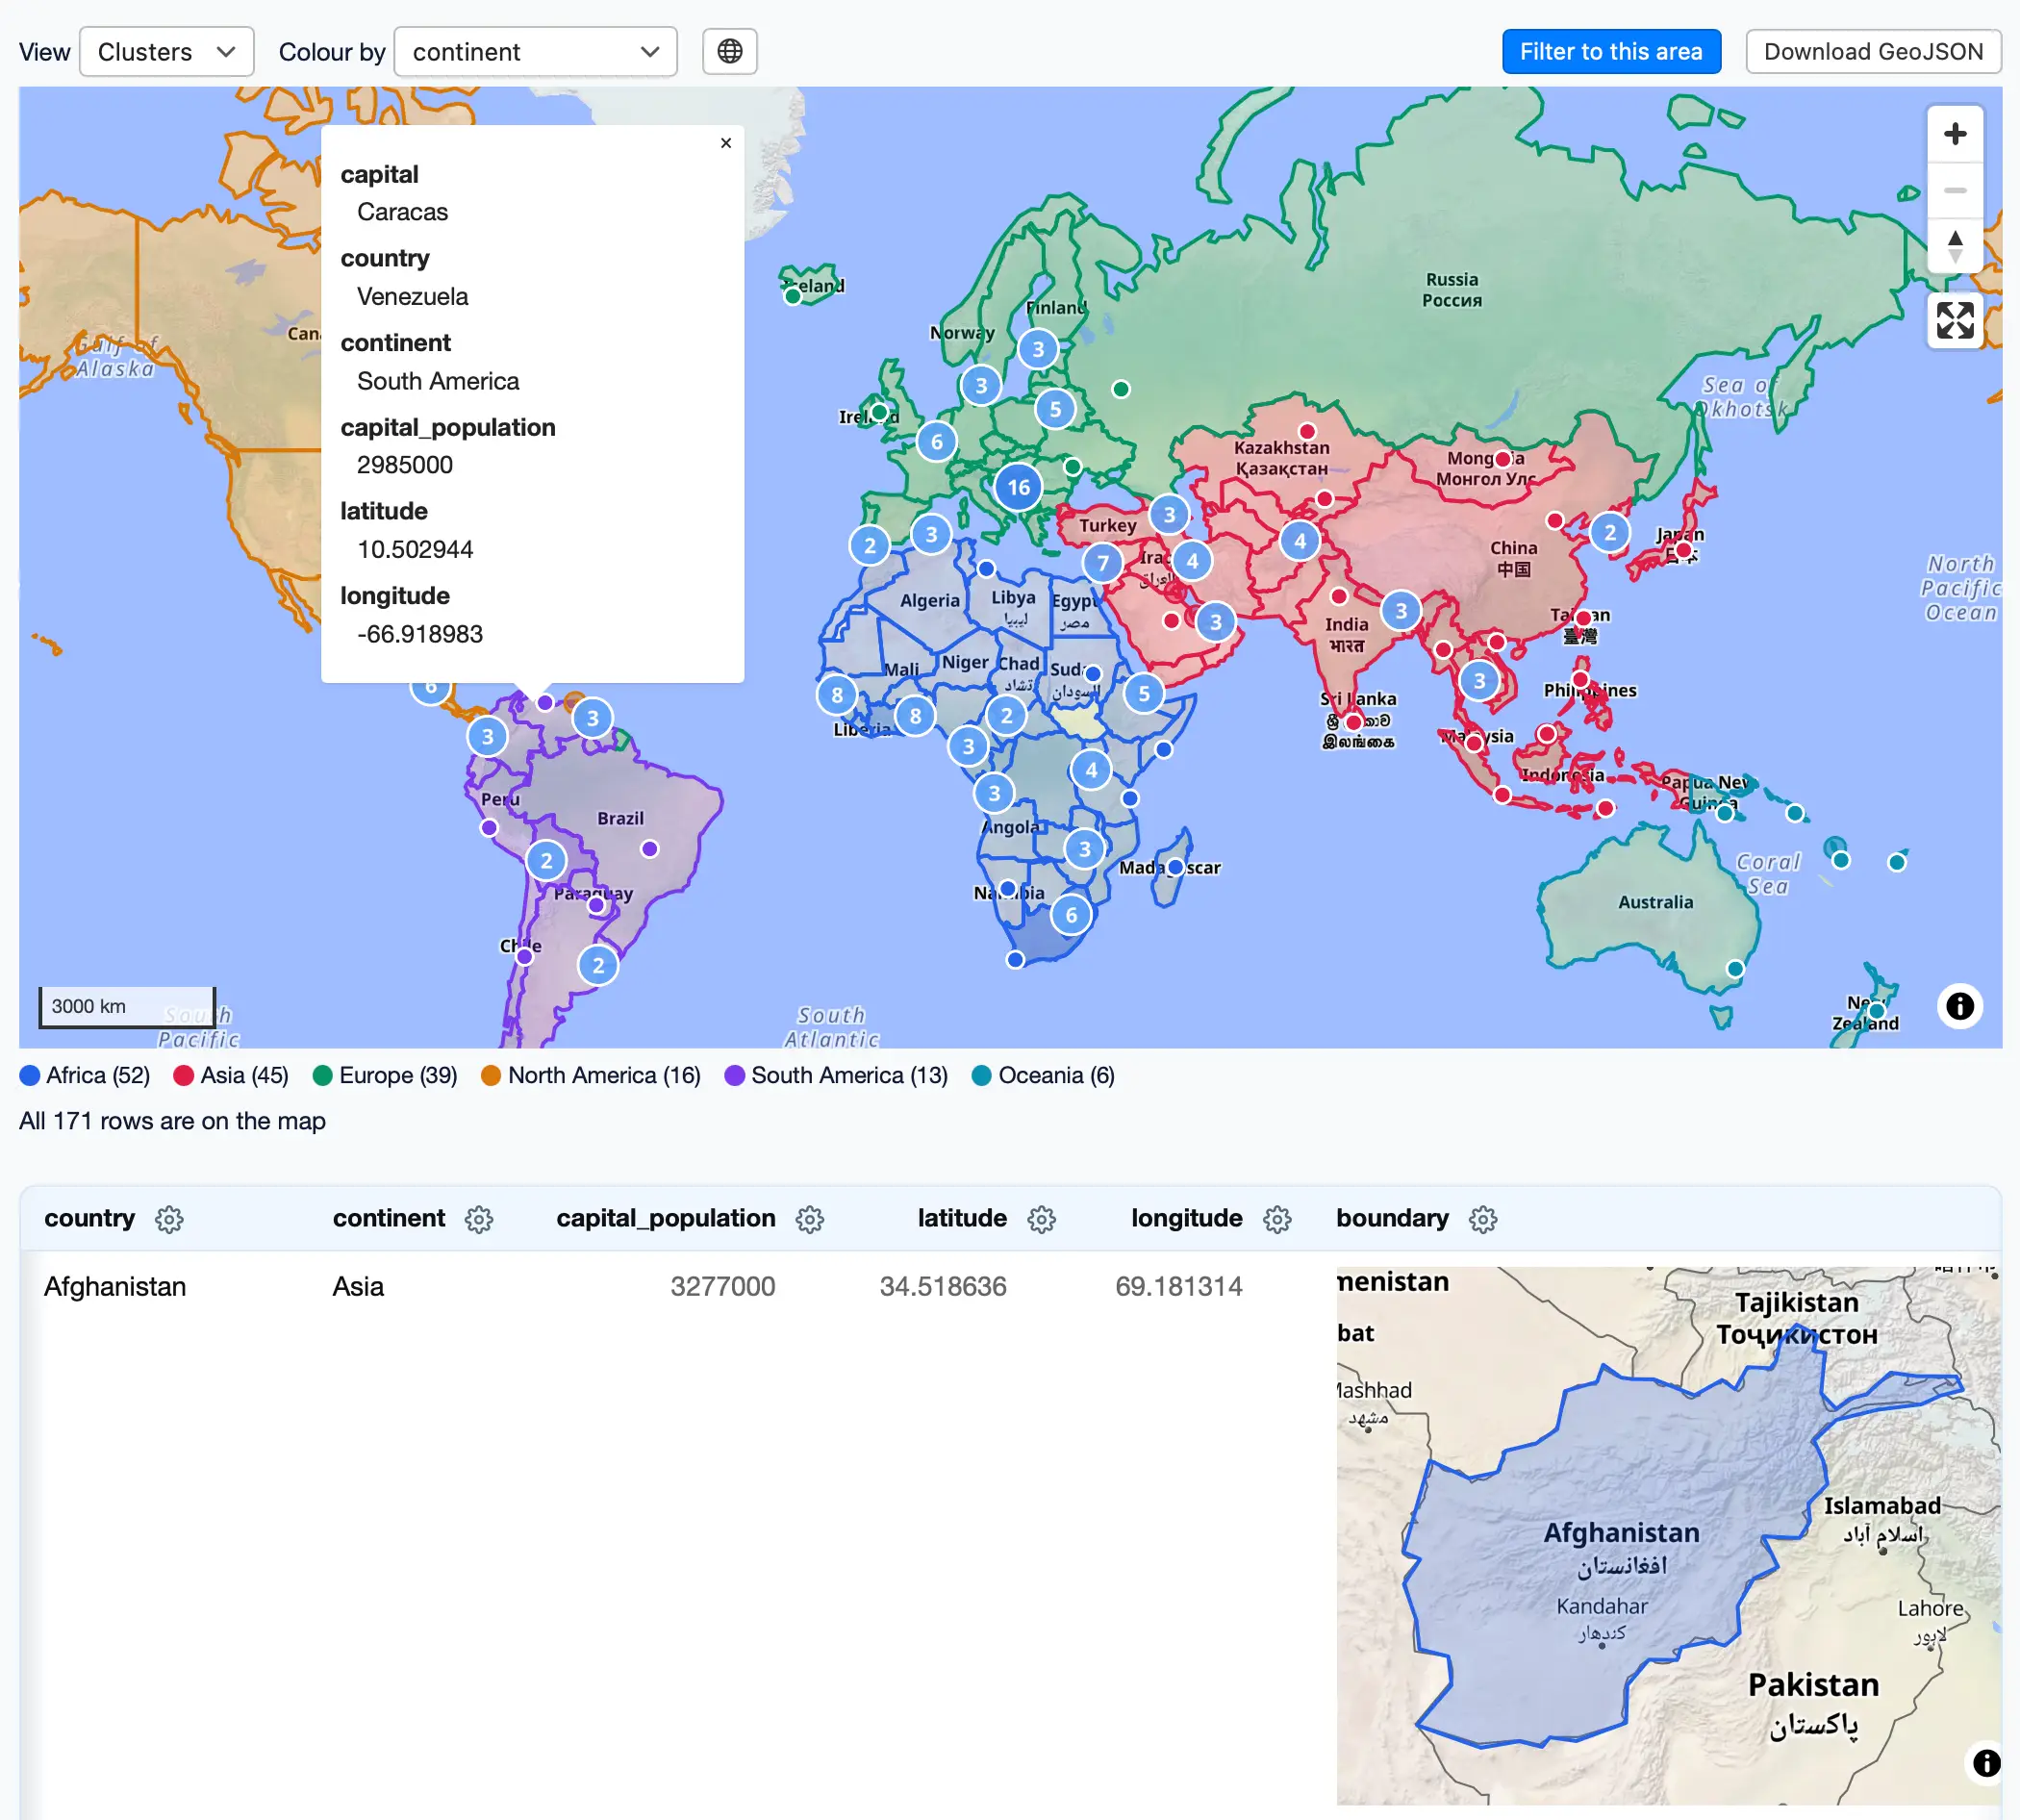
I like this demo page showing both GeoJSON shapes and lat/lon points on the same map:
Screenshot of a web map interface. Toolbar: "View" set to "Clusters", "Colour by" set to "continent", plus "Filter to this area" and "Download GeoJSON" buttons. A world map shows countries outlined and shaded by continent, with coloured dots and numbered cluster circles. A popup for a point in South America reads: capital Caracas, country Venezuela, continent South America, capital_population 2985000, latitude 10.502944, longitude -66.918983. Legend: Africa (52), Asia (45), Europe (39), North America (16), South America (13), Oceania (6). Text: "All 171 rows are on the map". Below, a table with columns country, continent, capital_population, latitude, longitude, boundary. First row: Afghanistan, Asia, 3277000, 34.518636, 69.181314, with a small map in the boundary column showing Afghanistan outlined and shaded in blue.
The text above was extracted automatically from the source page and may miss images, tables or code blocks. The original is authoritative.
Published by Simon Willison
This site only summarises and aggregates; copyright stays with the original author. Headlines and summaries follow the source — where they differ, the original wins.
 Newshot