 Newshot
Main
Modern silicon transistors continue to improve with technological advancement. However, as scaling progresses, power efficiency has emerged as a critical constraint, especially for ultra-low-energy applications such as wearable electronics, implantable medical devices, Internet of Things (IoT) nodes, edge AI processors and distributed sensor networks. To achieve substantial power reductions, device operation at reduced supply voltages has been explored extensively4,5. Nevertheless, silicon’s relatively small bandgap inherently increases leakage, while maintaining strong electrostatic control at scaled dimensions remains challenging6. A recent simulation study that compares silicon transistors with planar 2D field-effect transistors (FETs) from 16 nm to 1 nm technology nodes highlighted the low-power potential of 2D FET-based circuits7. These observations motivate the investigation of 2D semiconductors for low-power operation8,9,10,11,12.
The sizable bandgaps of 2D semiconductors suppress off-state current, while their atomically thin van der Waals (vdW) structure enables excellent gate control, making them well suited for energy-efficient operation. Proof-of-concept inverters assembled from n- and p-type 2D semiconductors—including MoS2-WSe2 (refs. 13,14,15), MoS2-MoTe2 (ref. 16) and pseudo-complementary metal–oxide–semiconductor (CMOS) based on single transition metal dichalcogenides (TMD)17—have demonstrated low-voltage and subthreshold operation with reduced static power consumption (Extended Data Table 1). However, these demonstrations rely on non-scalable approaches, such as mechanically exfoliated flakes or lateral assembly of dissimilar materials and devices. Their voltage gains are also limited (Extended Data Table 1), primarily because of asymmetric n-channel FET (n-FET) and p-channel FET (p-FET) transfer characteristics. One major source of this asymmetry is the gate stack: an imperfect 2D/high-κ interface degrades subthreshold swing, whereas unintentional dielectric-induced doping shifts the threshold voltage (Vth), impairing inverter performance. Most critically, WSe2-based p-FETs often have pronounced bipolar transfer characteristics, which are incompatible with robust CMOS operation and integration. High-permittivity, crystalline dielectric or buffer layers have been used to improve gate controllability by increasing gate capacitance and suppressing defect-induced degradation18,19,20. Clean vdW integration of gate dielectrics with 2D semiconductors also minimizes interfacial traps caused by direct deposition processes21,22,23,24. Despite these advances, a scalable method for achieving pristine 2D/high-κ interfaces in both n- and p-type transistors remains elusive.
Here we show that standard amorphous HfO2 grown by atomic layer deposition (ALD) contains prevalent charge traps that degrade WSe2 FETs by inducing unwanted bipolar transport, pronounced hysteresis, and compromised n- and p-type performance. Transitioning to a single-crystal dielectric mitigates these issues. Although crystalline dielectrics retain structural imperfections, their threading dislocations are spatially confined to one-dimensional defects with self-passivated cores, making them less detrimental to two-dimensional interfacial transport. We fabricated a -3-inch free-standing single-crystal anatase titanium dioxide (A-TiO2) membrane, a high-κ dielectric with κ ≈ 44–50 at a thickness of 18.2 nm. Patterned membranes are van-der-Waals-integrated with 2D semiconductors as top- or bottom-gate dielectrics, preserving pristine 2D/high-κ interfaces. The resulting MoS2 n-FETs and WSe2 p-FETs have ideal unipolar behaviour, well-matched enhancement-mode thresholds, near-ideal subthreshold swing and record-low hysteresis. Complementary inverters deliver high voltage gain, wide noise margins and record-low static power (subpicowatt) at low voltage. Furthermore, non-equilibrium Green’s function (NEGF) simulations show that this architecture is scalable to a gate length (Lg) of 10 nm, comparable with the 1 nm technology-node specifications in the IRDS 2031 roadmap while maintaining stable operation at 0.3 V.
Single-crystal A-TiO2 dielectric
We use a laser scanning-assisted pulsed-laser deposition technique to fabricate free-standing 3-inch A-TiO2 dielectric layers (Methods). In brief, a SrTiO3 layer was first epitaxially grown on a 3-inch single-crystalline LaAlO3 (001) substrate, followed by a water-soluble Sr3Al2O6 sacrificial layer that served as a template for the subsequent epitaxial growth of single-crystal A-TiO2 dielectric layers. The optical image of the as-grown 3-inch LaAlO3//SrTiO3//Sr3Al2O6//A-TiO2 heterostructure and its cross-sectional high-resolution transmission electron microscopy (HRTEM) image profile with energy-dispersive X-ray spectroscopy (EDS) elemental mappings are shown in Fig. 1a,b. To enable wafer-scale vdW integration with 2D semiconductors, we develop a transfer process as schematically illustrated in Fig. 1c. The grown heterostructure is patterned into 100 × 100 μm2 squares using inductively coupled plasma etching to expose the underlying Sr3Al2O6 layer surrounding the defined squares. The sacrificial Sr3Al2O6 layer is then selectively removed by immersion in deionized water, leaving the A-TiO2 layer in direct contact with the LaAlO3//SrTiO3 substrate. Owing to the vdW interaction between A-TiO2 and the substrate, the 3-inchpatterned A-TiO2 can be lifted off using a polymer support layer and transferred onto target substrates. Acetone washing followed by a mild O2 plasma treatment was used to remove polymer residues from the transferred A-TiO2. A photograph of the as-released 3-inch A-TiO2 layer on a Si//SiO2 substrate is shown in Fig. 1d.
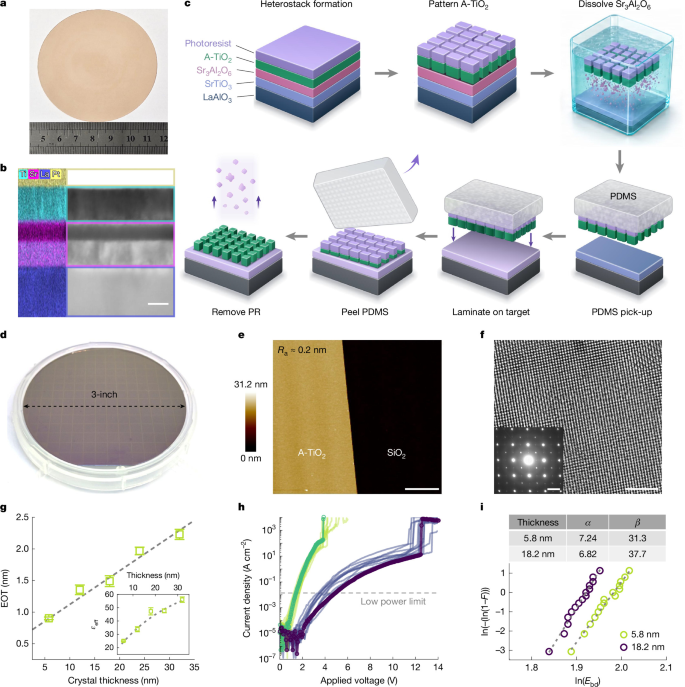
a, Photograph of the wafer-scale as-grown A-TiO2//Sr3Al2O6//SrTiO3//LaAlO3 heterostructure with a 3-inch diameter. b, A cross-sectional HRTEM image of A-TiO2/Sr3Al2O6/SrTiO3/LaAlO3 wafer together with corresponding STEM-EDS mapping of Ti/Sr/La/Pt. Scale bar, 20 nm. c, Schematic of the transfer mechanism and processing of wafer-scale A-TiO2 thin films onto the target substrate. PDMS, polydimethylsiloxane; PR, photoresist. d, Photograph of the wafer-scale A-TiO2 membrane patterned and transferred onto a 3-inch Si//SiO2 substrate. e, AFM topography image of A-TiO2 membranes transferred onto an Si//SiO2 substrate. Scale bar, 2 μm. f, Plan-view dark-field TEM images of 5.8-nm A-TiO2 membrane. The inset shows the corresponding SAED pattern. Scale bars, 2 nm and 5 nm−1 (inset). g, EOT as a function of A-TiO2 layer thickness, extracted from five MIM capacitors at each thickness. The inset illustrates the dependence of εeff on thickness. The dashed lines indicate the fitted curves based on the dead layer model. All of the error bars reflect the s.d. in the measurements. h, Current leakage and breakdown characteristics of the A-TiO2 film with thicknesses of 5.8 nm (green, sweep rate = 0.16 V s–1) and 18.2 nm (purple, sweep rate = 0.6 V s–1). The grey dashed lines mark the leakage limit (Jleak < 1.5 × 10⁻² A cm−2) for low-power logic applications. i, Weibull distribution of the Ebd extracted from h. The solid lines represent linear fit to the experimental data for the extraction of Weibull parameters. The scale parameter (α) denotes the characteristic breakdown field at which 63.2% of the devices fail, whereas the shape parameter (β) indicates the distribution uniformity.
Uniformity and flatness of the gate dielectric are critical for 2D semiconductor devices. The thickness mapping of the transferred 3-inch A-TiO2 film (Supplementary Fig. 1) indicates the exceptionally low coefficient of variation of 1.15%. The thickness of the transferred A-TiO2 membrane is further supported by atomic force microscopy (AFM; Supplementary Fig. 2) and X-ray reflectometry (Supplementary Fig. 3) measurements. Meanwhile, the AFM image of the A-TiO2 transferred onto SiO2 reveals an atomically flat surface, with a minimum average roughness (Ra) of approximately 0.12 nm and an average roughness of 0.13 nm across the 3-inch A-TiO2 platform (Fig. 1e and Supplementary Fig. 1d). Furthermore, AFM measurements support that the surface roughness for all thickness variants remains ≤0.2 nm (Supplementary Fig. 4). This roughness is comparable with that of atomically flat hexagonal boron nitride (around 0.19 nm), highlighting the exceptional smooth nature25,26. Reflection high-energy electron diffraction (RHEED) and X-ray diffraction (XRD) of the as-grown LaAlO3//SrTiO3//Sr3Al2O6//A-TiO2 heterostructure indicate coherent single-crystalline growth (Extended Data Fig. 1a,b). Azimuthal X-ray diffraction ϕ scanning along the (110) plane of free-standing A-TiO2 with different thicknesses further supported in-plane single-crystallinity without rotated domains (Extended Data Fig. 1c). The localized crystallinity is revealed by plan-view dark-field TEM imaging and selected-area electron diffraction (SAED) analysis (Fig. 1f), both of which support the local atomic-scale lattice registry and phase purity. X-ray diffraction characterization supports the single-crystalline quality of the A-TiO2 films. The symmetric (004) and asymmetric (107) rocking curves of the released A-TiO2 yield a screw dislocation density of 3.8 × 109 cm−2 and an edge dislocation density of 2 × 1010 cm−2, respectively (Methods). This dislocation density, which arises from the lattice mismatch inherent to the current sacrificial substrate, represents a lower bound for device performance that we expect to substantially improve by migrating to more closely lattice-matched systems. Moreover, asymmetric (107) reciprocal space mapping corroborates the structural homogeneity by tracking the strain state evolution post-release and verifying the absence of polycrystalline domains (Supplementary Fig. 5)27,28,29.
The metal–insulator–metal (MIM) capacitor structure is used to evaluate the capacitance of the as-prepared freestanding A-TiO2, where the A-TiO2 layer is transferred onto a gold-coated silicon substrate followed by the deposition of a top titanium/gold electrode (Extended Data Fig. 2). The inset of Fig. 1g demonstrates the dependence of the effective permittivity (εeff) on thickness, where each data point represents an average value obtained from multiple capacitors of the corresponding A-TiO2 thickness. Notably, the extracted εeff reflects the combined electrostatic contribution from both the single-crystal A-TiO2 layer and the interfacial vdW gap layer formed at the transferred interfaces. The effective value εeff is related to the measured capacitance (Ceff) through \({C}_{\mathrm{eff}}=A{\varepsilon }_{0}{\varepsilon }_{\mathrm{eff}}/t\), where \(A\) is the area of the top electrodes, t is the thickness of the A-TiO2 layer and ε0 is the vacuum permittivity. The εeff as a function of thickness can be well described by the typical dead layer model emerging in a high-κ nanocapacitor18. Figure 1g further summarizes the thickness dependence of equivalent oxide thickness (EOT), calculated as \(3.9t/{\varepsilon }_{\mathrm{eff}}\). The EOT scales nearly linearly with the A-TiO2 thickness, indicating that sub-1-nm EOT values can be achieved with films thinner than 7.7 nm. Meanwhile, the capacitance-equivalent thickness (CET) was determined using metal–oxide-semiconductor capacitors (Supplementary Fig. 6), demonstrating that an approximately 7.2-nm-thick A-TiO2 film achieves a CET of approximately 1 nm.
For practical device deployment, future high-κ dielectrics must simultaneously demonstrate minimal leakage current and high breakdown strength, for which single-crystal dielectrics represent a compelling high-κ solution for 2D electronics. Figure 1h shows the leakage current characteristics of the as-prepared A-TiO2 membranes with thicknesses of 5.8 nm and 18.2 nm. Both variants have excellent insulating behaviour, with leakage current densities (Jleak) remaining below the low-power limit (1.5 × 10⁻² A cm–2) up to operating voltages of 1.5 V (2.6 MV cm–1) and 4.6 V (2.5 MV cm–1) for 5.8-nm and 18.2-nm A-TiO2, respectively. The breakdown field (Ebd) characteristics of the 5.8-nm and 18.2-nm A-TiO2 layers are statistically analysed in Fig. 1i. Furthermore, time-dependent dielectric breakdown analysis of A-TiO2 with an EOT ≈ 1.5 nm under constant-voltage stress projects a ten-year device lifetime at operating voltages below 4 V (Supplementary Fig. 7). These results demonstrate the suitability of transferred A-TiO2 for low-power electronic applications.
High-performance FETs with A-TiO2
To examine the gate dielectric performance of A-TiO2 in 2D transistors, a 3-inch patterned A-TiO2 membrane is transferred onto an Si//SiO2 substrate incorporating patterned platinum back-gate electrodes (refer to Supplementary Fig. 8 for details on the fabrication process flow). A wafer-scale monolayer MoS2 (1L-MoS2) film grown by chemical vapour deposition (CVD) is subsequently transferred to the top of A-TiO2, where the quality of MoS2 is verified by Raman and photoluminescence spectroscopy (Supplementary Fig. 9). MoS2 channels are defined and contacted using antimony/gold metals to form local bottom-gate MoS2 FETs. Photographs of the 3-inch device array are shown in Fig. 2a,b, and a schematic of the device structure is presented in Fig. 2c. A cross-sectional HRTEM image at the contact area reveals two distinct vdW gaps at the 1L-MoS2/Sb and 1L-MoS2/A-TiO2 interfaces (Fig. 2d). At the latter interface, the well-defined single-crystalline dielectric surface provides a clean interface contact with MoS2, minimizing charge-impurity scattering and doping. The clean interface is also attributed to the optimized transfer and polymer removal process (Methods). Furthermore, the vdW gap at the interface of the 2D materials and A-TiO2 also plays a key role in effectively suppressing fringing-induced barrier lowering caused by using high-κ dielectric, which in turn helps to mitigate drain-induced barrier lowering in scaled devices18. At the MoS2/Sb interface, a pristine and intimate contact free of metal-induced defects is observed30, enabling a low contact resistance of about 120 Ω μm, as extracted using the transfer length method from devices with channel lengths ranging from 80 nm to 0.8 μm (Supplementary Fig. 10).
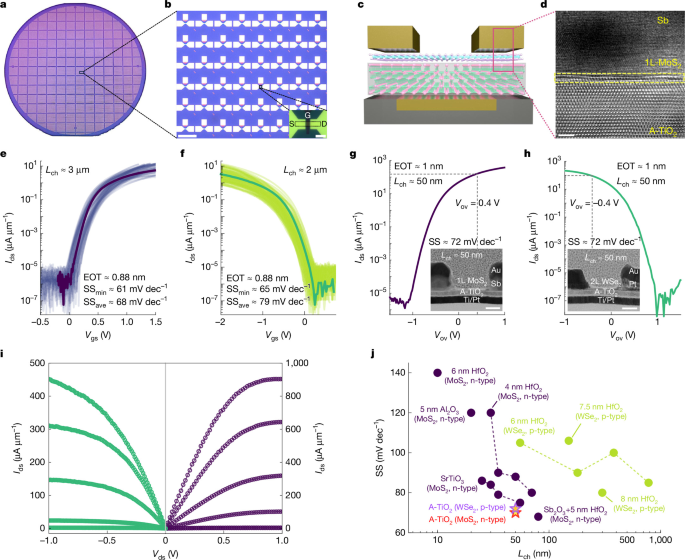
a, Photograph of the MoS2/A-TiO2 FET arrays over an entire 3-inch wafer. b, Optical micrograph of batch-fabricated FET arrays. The inset is a magnified image of the black square, where G, S and D represent the gate, source and drain, respectively. Scale bars, 200 μm and 5 μm (inset). c, Schematic of the fabricated local back-gate FET. d, Cross-sectional HRTEM image of fabricated FET in the contact region. Scale bar, 2 nm. e,f, Ids–Vgs curves of 80 1L-MoS2/A-TiO2 (e) and 84 2L-WSe2/A-TiO2 (f) FETs with Vds = 1 V and –1 V, respectively. SS, subthreshold swing. g,h, Ids–Vov curves of short-channel 1L-MoS2/A-TiO2 (g) and 2L-WSe2/A-TiO2 (h) FETs with Vds = 0.6 V and −0.6 V, respectively. The inset shows SEM images of the corresponding devices. Scale bar, 20 nm. i, Output characteristics (Ids–Vds) of the short-channel 1L-MoS2/A-TiO2 (Vov from 0.75 V to −1.25 V, step −0.5 V) and 2L-WSe2/A-TiO2 (Vov from −1.0 V to 1.5 V, step 0.5 V) FETs (Lch = 50 nm). j, Benchmark of the best-reported subthreshold swing values for short-channel 2D FETs integrated with various gate dielectrics. n- and p-FETs are marked in purple18,40,41,42,43,44,45 and green46,47,48, respectively. To ensure an equitable assessment, only CVD-grown channels with single-gate configurations are included.
To assess transistor performance with A-TiO2 gate oxide, we measured 100 p- and 100 n-type devices across the wafer, randomly sampled from five representative regions (Supplementary Fig. 11), where the majority of devices have consistent electrical characteristics across the wafer. Devices were qualified by excluding those with abnormal Vth shifts, Ion/Ioff outside 106–5 × 10⁷, or failed electrical characteristics. Figure 2e shows representative transfer characteristics (Ids – Vgs) of 80 qualified long-channel 1L-MoS2 FETs integrated with a 5.8-nm-thick A-TiO2 dielectric (EOT ≈ 0.88 nm; W/L = 2 μm/3 μm). The average subthreshold swing across the array is 68 mV dec–1, with the best device achieving 61 mV dec–1. Similarly, 84 qualified bilayer WSe2 (2L-WSe2) FETs (W/L = 2 μm/2 μm) with A-TiO2 dielectric show excellent performance (Fig. 2f), delivering average and minimum subthreshold swing values of 79 mV dec–1 and 65 mV dec–1, respectively. The subthreshold swing values as a function of Ids for selected 1L-MoS2/A-TiO2 and 2L-WSe2/A-TiO2 devices are presented in Supplementary Fig. 13. Statistical distributions of Ion/Ioff, subthreshold swing and Vth for the working p- and n-type transistors are summarized in Supplementary Fig. 12, with most n- and p-FETs (>98%) exhibiting over seven orders of magnitude in Ion/Ioff ratios, low gate leakage and minimal variation in Vth. Supplementary Fig. 14a and 14b further present representative transfer characteristics of 1L-MoS2 and 2L-WSe2 FETs integrated with thicker A-TiO2 gate dielectrics (18.2 nm; EOT ≈ 1.5 nm). Supplementary Fig. 14c–f show the corresponding gate leakage currents for 1L-MoS2 and 2L-WSe2 FETs with 18.2-nm and 5.8 nm A-TiO2 gate dielectrics, supporting that strong electrostatic control is maintained without increased leakage even under aggressive EOT scaling. Extended Data Fig. 3a compares the subthreshold swing versus EOT across various technologies using CVD-grown 2D channels. Extended Data Fig. 3b further compares Jleak at an applied gate voltage of 1 V for various gate-stack technologies with EOT or CET ≤ 1 nm. The A-TiO2 gate stack demonstrates low Jleak with sub-1-nm EOT, remaining well below the low-power limit (1.5 × 10⁻² A cm−2). Recent studies have highlighted the trade-off between leakage-current suppression and electrostatic scaling in vdW-integrated 2D transistor interfaces31, and readers are referred to these works for broader discussions on EOT benchmarking and scaling considerations.
We further fabricated short-channel bottom-gated 1L-MoS2 and 2L-WSe2 FETs with channel lengths of about 50 nm to evaluate gate controllability at scaled dimensions. Even at this reduced channel length, both 1L-MoS2/A-TiO2 and 2L-WSe2/A-TiO2 devices exhibit near-ideal subthreshold swing (around 72 mV dec–1) and a high Ion/Ioff ratio (>108) without an increase in off-state current (Fig. 2g,h). The short-channel devices also have high Ion at Vds = 0.6 V. For the 1L-MoS2/A-TiO2 configuration, Ion reaches 227 μA μm–1 at Vov = 0.6 V and 167 μA μm–1 at Vov = 0.4 V. Similarly, the 2L-WSe2/A-TiO2 device demonstrates Ion values of 136 μA μm–1 (Vov = –0.6 V) and 86 μA μm–1 (Vov = –0.4 V) at a drain bias of –0.6 V, where Vov = Vgs − Vth denotes the gate-overdrive voltage. The corresponding output characteristics are shown in Fig. 2i. These results can be attributed to the superior gate-to-channel electrostatic control enabled by the A-TiO2 high-κ gate stack (Extended Data Fig. 4). Figure 2j benchmarks the subthreshold swing versus channel length (Lch) for reported short-channel 2D FETs using different dielectric technologies, highlighting that the subthreshold swing values achieved with A-TiO2 gate dielectric are among the lowest reported for CVD-grown MoS2 and WSe2 devices with similar structures. Supplementary Table 1 benchmarks devices using amorphous or single-crystal gate dielectrics with CVD-grown 2D TMD channel materials. The proposed A-TiO2 integration achieves a sub-1-nm EOT, a subthreshold swing of below 65 mV dec–1 and a high Ion, metrics which align with the requirements for low-power, high-performance logic applications.
Clean A-TiO2/2D interfaces
Hysteresis in the transistor transfer characteristics is a critical metric of operational stability. Here we systematically compare 2D transistors integrated with single-crystalline A-TiO2 to those using amorphous HfO2 and Al2O3 gate dielectrics deposited by the ALD approach (Methods). Extended Data Fig. 5 displays the Ids – Vgs characteristics for different types of dielectrics under forward and reverse gate-voltage sweeps. The hysteresis width (ΔVH) of 1L-MoS2/A-TiO2 FETs reaches an exceptionally small value of around 1.5 mV at the sweeping frequency (f) of 0.028 Hz (f = 1/tsw, where tsw represents the total forward and backward sweeping time). The cyclostationary behavior of the 1L-MoS2/A-TiO2 FET is further detailed in Supplementary Fig. 15. The minimal variation observed between the initial and 100th measurement cycles supports the robustness of the gate stack and ensures that our hysteresis characterization is reliable for future device benchmarking32. For a fair comparison, ΔVH is normalized by EOT33,34. Figure 3a summarizes the statistical distribution of normalized ΔVH extracted from devices employing different dielectrics (Supplementary Fig. 16), where A-TiO2 has the smallest hysteresis value among all the tested devices. Supplementary Fig. 17 further shows normalized ΔVH as a function of sweep frequency for a representative 1L-MoS2/A-TiO2 FET measured under different gate sweeping ranges. The resulting hysteresis remains minimal across all measurement conditions, in sharp contrast to MoS2 transistors with conventional SiO2, Al2O3 or HfO2 gate dielectrics, which display pronounced hysteresis, particularly at low sweeping frequencies, due to slow charge trapping in oxide defect states35. Figure 3b benchmarks the normalized ΔVH of 1L-MoS2/A-TiO2 FETs against literature values reported for a range of dielectric technologies. Notably, our unencapsulated devices achieve a normalized ΔVH of 0.5 mV nm–1, which not only outperforms those of unencapsulated 2D transistors but also demonstrates superior stability compared with channel-encapsulated devices. Furthermore, bias-temperature instability (BTI) measurements reinforce the stability of the 1L-MoS2/A-TiO2 interface (Methods), revealing small threshold voltage shift (ΔVth) under both positive (ΔVth = 40 mV) and negative (ΔVth = 50 mV) gate bias stress (Supplementary Fig. 18). These results indicate the scarcity of border traps within the single-crystalline gate dielectric and a clean dielectric/2D semiconductor interface, even when integrated using conventional wet transfer technologies. Although the BTI of these 2D FETs currently exceeds that of established silicon technology3, further optimization of the interface and dielectric quality remains a clear path toward industrial parity.
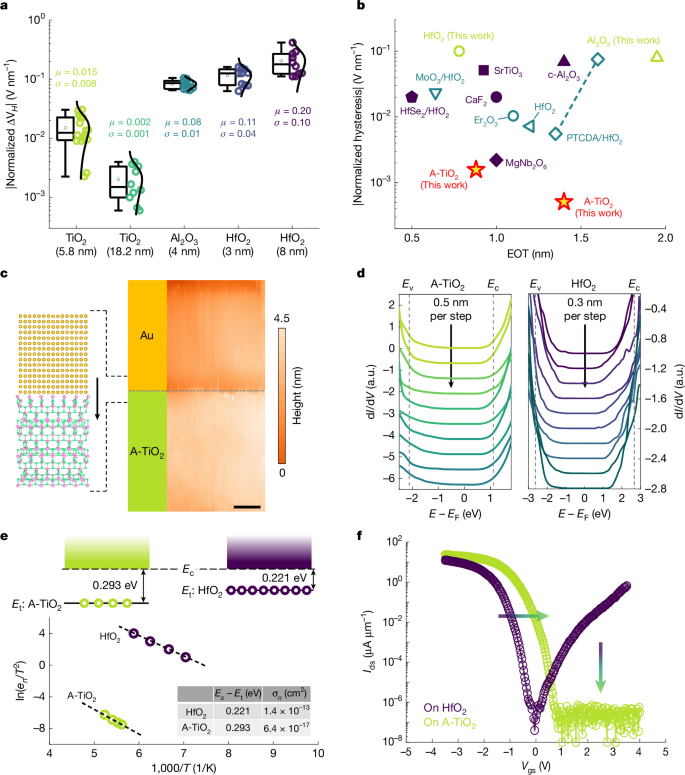
a, Normalized hysteresis widths ΔVH with average (μ) and standard deviation (σ) values extracted from the MoS2 FETs with different gate dielectrics and thicknesses. b, Comparison of normalized ΔVH across high-κ dielectric technologies in 2D FETs18,19,22,49,50,51,52,53. Open and solid symbols denote amorphous and crystalline gate dielectrics, respectively. All benchmark values were extracted for 2 V < ΔVgs < 3.5 V and tsw ≤ 100 s. c, Typical cross-sectional STM topography image of the Au/TiO2 interface. Scale bar, 10 nm. d, Atomic-scale evolution of electronic properties of the subsurface of A-TiO2 and HfO2. e, Arrhenius plot of I-DLTS results extracted from 1L-MoS2/A-TiO2 and 1L-MoS2/HfO2 devices, revealing two distinct trap states. The table in the inset lists the activation energy (Ec – Et) and the capture cross section (σn) of two trap states, obtained from the slope and intercept of the two Arrhenius curves. f, Transfer characteristics of 2L-WSe2/A-TiO2 (green) and 2L-WSe2/HfO2 (purple) p-FETs. Both devices share identical channel dimensions (Lch = 2 μm, Wch = 2 μm), highlighting the impact of dielectric choice on FET devices.
The record-low hysteresis can be attributed to the clean channel–dielectric interface and crystalline dielectric with low concentration of traps, which together drastically suppress charge trapping to enable low hysteresis. The estimated interface trap density (Dit) is determined as approximately 5.74 × 1011 cm−2 eV−1, substantially lower than the values typically reported for devices incorporating CVD-grown MoS2 channels (Supplementary Table 2), although CVD-synthesized MoS2 inevitably contains point defects (1011–1012 cm–2) due to thermodynamic and growth chemistry constraints36. To understand the origin of hysteresis, we perform cross-sectional scanning tunneling microscope/spectroscopy (XSTM/S) measurements to directly probe the in-gap states in dielectric oxides (Supplementary Note 1). A representative XSTM topography of the metal–dielectric interface is shown in Fig. 3c, whereas spatially resolved XSTM-STS measurements acquired at sub-0.5 nm intervals from the interface into the dielectric are presented in Fig. 3d. Amorphous HfO2 has pronounced in-gap states near the band edges, particularly close to the interface, indicating a high density of charge-trapping centres. By contrast, no discernible in-gap states are detected in A-TiO2, supporting its intrinsically low trap density.
Moreover, current-mode deep-level transient spectroscopy (I-DLTS) reveals distinct trap characteristics at 1L-MoS2/dielectric interfaces (Fig. 3e). 1L-MoS2/HfO2 has a shallow trap (0.221 eV below Ec) with a large capture cross-section (σn = 1.40 × 10⁻¹³ cm2). Conversely, 1L-MoS2/A-TiO2 shows a deeper trap at 0.293 eV below Ec with a capture cross-section that is three orders of magnitude smaller (σn = 6.40 × 10⁻¹⁷ cm2), substantially suppressing trapping (Supplementary Note 2). The close agreement between XSTM-STS and I-DLTS measurements indicates that shallow, Coulomb-attractive traps dominate the 1L-MoS2/HfO2 interface, whereas deeper, near-neutral traps in A-TiO2 exhibit substantially lower trapping probability. The influence of dielectric quality is further illustrated in Fig. 3f, which compares the transfer characteristics of WSe2 p-FETs fabricated with A-TiO2 and amorphous HfO2 gate dielectrics. The A-TiO2-gated device has clean unipolar p-type behaviour across the entire gate sweep; however, the HfO2-gated device shows pronounced bipolar transport, incompatible with robust CMOS operation. This contrast indicates that the bipolar response is linked to defect-induced Fermi-level modulation associated with in-gap states in the amorphous dielectric (Supplementary Note 3). These findings underscore the critical importance of using high-quality dielectrics with low-trap density to achieve stable, unipolar p-type operation in WSe2 FETs.
Integrated complementary field-effect transistors with A-TiO2
The stable and high-performance A-TiO2-gated 2D FETs motivate us to further demonstrate their scalable vertical integration into complementary field-effect transistors (CFETs) (Fig. 4a). Fabrication begins with MoS2 n-FET arrays, using buried gold electrodes as source and drain contacts and single-crystalline A-TiO2 as the top-gate dielectric. A vertical CMOS architecture is then constructed by stacking 2L-WSe2/A-TiO2 p-FET arrays directly above the n-type tier, sharing a common Pt gate electrode. After vertically interconnecting the drain electrodes of n- and p-FETs through the via-metal, where the output voltage (Vout) is measured, the CFET inverters are realized (the schematic structure is shown in Fig. 4b; refer to Extended Data Fig. 6 for detailed fabrication steps). Figure 4c shows the cross-sectional HRTEM images acquired at the channel region of a representative CFET inverter, revealing uniformly flat layers with atomically sharp vdW interfaces between the 2D semiconductors and the A-TiO2 gate dielectrics. An overview cross-sectional HRTEM image of the complete CFET stack, illustrating the vertical alignment of the top p-FET and bottom n-FET tiers, is provided in Extended Data Fig. 7.
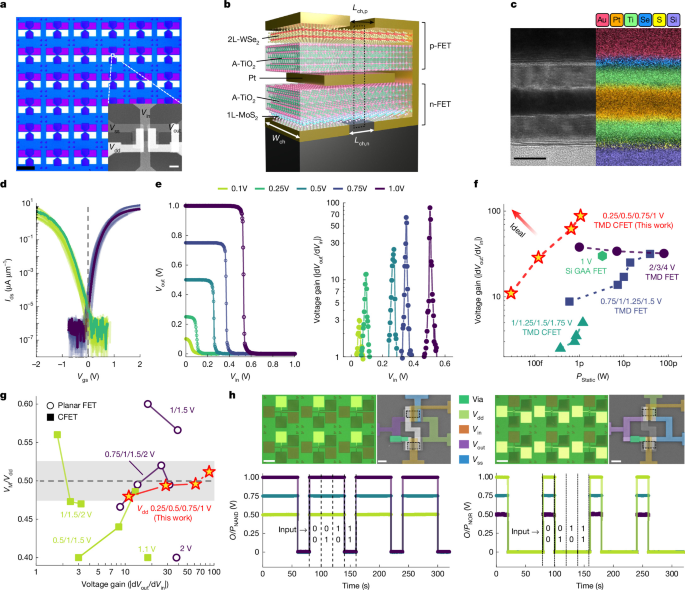
a, Optical micrograph of batch-fabricated CFET inverter arrays. Scale bar, 200 μm. Inset: a magnified SEM image of the white square. Scale bar, 2 μm. b, Schematic of the fabricated CFET inverter. c, Cross-sectional HRTEM image and corresponding EDS mapping of the fabricated CFET at channel region. Scale bar, 10 nm. d, The transfer characteristics of the CFET array, with the green/yellow and purple/blue curves representing the p-FETs and n-FETs with Lch = 1 μm, respectively. e, The voltage transfer characteristics and gains of the CFET inverter under Vdd = 0.1–1.0 V. f, Comparison of the static power consumption for hero devices from advanced silicon-based and CVD 2D material-based CMOS inverter technologies, across various supply voltages, based on past studies14,54,55,56. g, Benchmarking the voltage gain and normalized mid-point voltage \({V}_{{\rm{M}}}/{V}_{{\rm{d}}{\rm{d}}}\) for representative reported CVD 2D-material-based CMOS inverters across a range of Vdd. Note that VM = Vdd/2 occurs when n-FET and p-FET are well matched—a condition essential for maximizing noise margins and minimizing static power consumption14,15,56,57,58,59. h, The optical micrograph of CFET-based NAND (left) and NOR (right) gates. Scale bar, 100 μm. Inset: magnified SEM images of the NAND (left) and NOR (right) gates. Scale bar, 2 μm. The corresponding output characteristics are shown for supply voltages ranging from 0.5 V to 1.0 V.
The transfer curves of the bottom n-FETs and top p-FETs (Lch = 1 μm) measured from 16 CFETs are shown in Fig. 4d, exhibiting nearly symmetric behavior and limited device-to-device variation. Note that the voltage transfer characteristic (VTC) curves shown for the CFET inverters exclude abnormal devices (Supplementary Note 4). The yield of the CFET inverters is approximately 50% (25 functional devices out of 50 fabricated devices) and requires further engineering improvement. The standard deviations of normalized Ion are 21.8% for the n-FETs and 23.9% for the p-FETs. The average Vth is 0.9 V for the n-FETs and −1.1 V for the p-FETs, confirming enhancement-mode operation for both device types, which is essential for low-power logic applications. Both n- and p-FETs have steep subthreshold slopes, indicating high transconductance ( gm, defined as the change in drain current with respect to gate voltage, ∆Ids/∆Vgs) and transconductance efficiency (gm/Ids), which are essential for achieving large voltage gain in CFET inverters. Consistently, both device types maintain Ion/Ioff ratios exceeding 107 over a range of Vds while preserving a minimum subthreshold swing of about 75 mV dec–1 (Supplementary Fig. 19), enabling efficient inverter operation at reduced supply voltage (Vdd) with low power consumption. Figure 4e displays representative VTCs of the CFET inverters, demonstrating excellent full-rail logic swing across a range of Vdd from 0.1 V to 1 V. The voltage gain increases progressively with Vdd, from 12 V/V at 0.25 V to a peak value of 89 V/V at 1 V. Remarkably, even at the minimum Vdd of 0.1 V, the inverter maintains a gain value exceeding the minimum threshold (1 V/V) for functional logic operation37, highlighting the potential of this CFET architecture for ultra-low-voltage, energy-efficient circuits. Supplementary Fig. 20 summarizes the voltage gain, static power consumption (Pstatic) and estimated noise margins (NML, low-level noise margin; NMH, high-level noise margin) as functions of Vdd, extracted from 16 individual CFET inverters. Owing to the crystalline nature of the high-κ dielectric and well-matched characteristics of n/p-FETs, the CFET inverters had ultralow gate and channel leakage currents during operation, resulting in exceptionally low Pstatic. At Vdd = 0.25 V, Pstatic is measured to be 38 fW, and even at Vdd = 1 V it remains as low as 1 pW. As summarized in Fig. 4f, the achieved Pstatic is the lowest reported among 2D material-based CMOS inverters, while simultaneously maintaining high gain.
Figure 4g compares the voltage gain values versus switch point (VM/Vdd), where VM denotes the input voltage at which Vout equals Vin. A switching point near 0.5 is critical for maximizing noise margins and ensuring symmetric logic operation. The CFET inverters demonstrated here not only achieve high voltage gains but also maintain VM/Vdd values close to the ideal 0.5. To further evaluate the noise tolerance of our CFET inverters, we estimated the noise margin (NM% = NML% + NMH%) values from the VTCs for 16 individual devices. The average NM% values are 67.5%, 82.5%, 87.5% and 89.2% at Vdd values of 0.25 V, 0.5 V, 0.75 V and 1 V, respectively (Supplementary Fig. 20), exceeding previously reported CFET implementations (Extended Data Table 1).
Beyond inverter operation, logic gate networks, including NAND and NOR gates, were implemented using CFET-based pull-up and pull-down configurations comprising two p-FETs and two n-FETs (Fig. 4h and Supplementary Fig. 21). Both logic gates operate reliably at a low Vdd of 0.5 V, demonstrating the feasibility of CFET-based logic beyond single-inverter circuits. The thermal stability of A-TiO2-integrated CFETs was evaluated at both material and device levels (Supplementary Note 5). The results support that the A-TiO2 dielectric and its interfaces with TMD channels retain electrical and crystallographic integrity under back-end-of-line (BEOL) thermal conditions (up to 400 °C). However, extended high-temperature exposure beyond conventional limits causes noticeable device degradation.
Furthermore, the electrical performance of short-channel CFET inverters with about 50 nm channel lengths in both the bottom- and top-tier FETs was also evaluated (Extended Data Fig. 8a). The transfer characteristics of the p-FET and n-FET show well-matched threshold voltages and on-currents (Extended Data Fig. 8b). This electrical symmetry enables a high inverter voltage gain (gain = 97 V/V at Vdd = 1 V). The improvement is attributed to the higher switching current enabled by the short channels, as illustrated in the VTC and corresponding gain curve in Extended Data Fig. 8c,d. As expected, the static power consumption of these short-channel devices is higher than that of long-channel (Lch = 1 μm) CFETs, as a result of increased short-circuit current and Ioff during switching (Extended Data Fig. 8e). Further work on integrating Vth-tuning techniques is needed to achieve the critical balance of high gain and low power consumption in our CFET technology. Furthermore, we estimate dynamic power (Pdyn) (Supplementary Note 6), where the analysis indicates that the scaled CFET achieves a 39% reduction in dynamic power (Pdyn ≈ 230.3 nW, Vdd = 0.5 V), compared with the long-channel counterpart (Pdyn ≈ 378.3 nW, Vdd = 0.5 V). This improvement arises from reduced intrinsic and Miller capacitances associated with the scaled geometry, which outweighs the additional parasitic coupling introduced by the vertical stacking38,39.
In summary, this work demonstrates a 3-inch freestanding A-TiO2 membrane as a gate dielectric that delivers exceptional thickness uniformity and favourable dielectric metrics. The atomically clean interface formed between A-TiO2 and 2D materials enables low subthreshold swing, record-low hysteresis and well-balanced enhancement-mode operation for both n- and p-type transistors. Building on this gate-stack platform, vertically stacked CFET inverter arrays have high voltage gain, wide noise margins and ultralow static power consumption. Density functional theory (DFT) combined with NEGF (NEGF-DFT) simulations further project that the proposed 2D CFET architecture can be scaled to the 1-nm node while sustaining stable operation (Supplementary Note 7). Together, these results establish wafer-scale single-crystal high-κ dielectrics integrated with 2D semiconductors as viable and promising platforms for energy-efficient logic technologies, positioning them as compelling candidates for the post-silicon electronics roadmap.
Methods
Freestanding A-TiO2 membrane fabrication
The AlO2-terminated surface of single-crystalline 3-inch LaAlO3 (001) substrates was prepared by wet etching of LaAlO3 (001) for 30 s with dilute HCl (pH ≈ 4.5), followed by 1,000 °C annealing in a pure oxygen atmosphere. The atomically sharp step and terraces of substrates were examined by AFM. The SrTiO3, Sr3Al2O6 and A-TiO2 films were grown by pulsed laser deposition using a 248-nm krypton fluoride excimer laser with a laser fluence of 48 mJ cm–2. A laser-scanning system capable of depositing films on wafers up to 4-inch in diameter was used, in which a linear translation stage, rather than a galvanometer, was used to scan the laser beam across a rotating target. This configuration eliminates optical distortions and maintains consistent ablation conditions, thereby ensuring uniform film growth. The SrTiO3 buffer layer and water-soluble Sr3Al2O6 layers were deposited at 850 °C with an oxygen partial pressure (\({p}_{{{\rm{O}}}_{2}}\)) of 1 × 10⁻⁶ torr. The in situ RHEED patterns indicated the highly crystalline nature for the as-grown A-TiO2 layer, respectively (Extended Data Fig. 1a). The epitaxial growth of the A-TiO2 layer on the Sr3Al2O6 thin film was then conducted at 800 °C and \({p}_{{{\rm{O}}}_{2}}\) = 1 × 10⁻⁴ torr. On the completion of film deposition, the sample was cooled down to room temperature under \({p}_{{{\rm{O}}}_{2}}\) = 1 × 10⁻¹ torr to prevent non-stoichiometry in A-TiO2 film.
Growth and transfer of MoS2 and WSe2
The 1L-MoS2 film was synthesized via a CVD method on C/M sapphire substrates (supplied by Crystal-wise Technology), which had undergone surface reconstruction. Molybdenum trioxide (MoO3, 99.5%) and sulfur (S, 99.5%) powders (both from Sigma-Aldrich) were positioned in separate zones of a quartz tube furnace. A heating belt regulated the sulfur evaporation at 160–180 °C, whereas the substrate and MoO3 were heated to 700 °C. An argon gas flow facilitated the transport of vapourized precursors. The growth process lasted 15 min, after which the system was allowed to cool naturally to room temperature. The 2L-WSe2 film was provided by Nexstrom, where the samples were grown by CVD methods. The transfer procedures of 1L-MoS2 and 2L-WSe2 follow the common polymethyl-methacrylate-assisted wet transfer method.
Characterization
X-ray diffraction measurements were conducted using a Rigaku SmartLab thin-film XRD system with a rotating copper anode X-ray source. The dislocation density (\(\rho \)) is evaluated using the Vannas (Halliwell–Hirsch) model:
where \(\beta \) is the FWHM in radians and \(b\) is the Burgers vector. The surface morphologies were examined by AFM (Bruker Dimension Icon SPM). The film thickness uniformity was measured by an ellipsometer (J.A. Woollam RC2). Raman and Photoluminescence spectra of MoS2 and WSe2 were collected in a confocal Raman microscopy system (WITec alpha 300 R) with a 532-nm laser. The cross-sectional STM measurement was conducted under ultrahigh vacuum (5 × 10⁻¹¹ torr) at room temperature. Plan-view dark-field TEM image and SAED pattern of A-TiO2 membrane were captured using a Thermo Scientific Talos F200X STEM at 200 kV from a top-view sample suspended on a holey carbon grid. Cross-section lamellas for LaAlO3//SrTiO3//Sr3Al2O6//A-TiO2 heterostructure, single FET and CFET devices were prepared with a focused-ion-beam system (Thermo Scientific Helios 5 CX). Cross-section STEM images and EDS mapping were conducted by the same STEM system at 200 kV. The surface topography and structure of CFET logic gates were examined by SEM (Zeiss Sigma 300 VP).
Device fabrication
For MIM capacitors, the A-TiO2 membranes were transferred onto Au-coated Si substrates; subsequently, 10 nm Ti and 80 nm Au electrodes were fabricated through the shadow mask by electron-beam evaporation. For ALD-grown amorphous dielectric oxides, we used trimethylaluminum and water as the precursors for Al2O3 deposition, whereas tetrakis (dimethylamido) hafnium and water served as the precursors for HfO2, with the growth temperature of 150 °C. For FET fabrication (Supplementary Fig. 8), the A-TiO2 membranes and 1L-MoS2/2L-WSe2 layers were sequentially transferred onto a Ti/Pt (1 nm/8 nm) local back-gate array. The channel area was defined using electron-beam lithography followed by O2 reactive-ion etching (10 mTorr, 100 W). After patterning the source/drain regions using electron-beam lithography, Sb/Au (20 nm/40 nm) and Pt/Au (5 nm/15 nm) contacts were deposited to form n-type 1L-MoS2 and p-type 2L-WSe2 FETs, respectively. The metals were deposited using thermal and e-beam evaporation, and the chamber pressure was maintained at around 10−8 Torr throughout the metal deposition process. For CFET devices (Extended Data Fig. 6), a 12-nm Au layer was first deposited on the substrate to serve as the bottom contact for the n-FET. A 1L-MoS2 film was transferred and patterned, followed by the transfer of an A-TiO2 membrane as the gate dielectric. A 10-nm Pt mid-gate was then defined on A-TiO2 to serve as the shared gate for both bottom n-FET and top p-FET. The top device was then completed by sequential transfer of a second A-TiO2 membrane and a 2L-WSe2 film, which was intentionally adopted to improve device-to-device uniformity and process tolerance during multilayer CFET fabrication, supported by independent statistical comparison of 1L-WSe2 and 2L-WSe2 devices (Supplementary Note 8). To remove surface polymer residue, a mild O2 plasma treatment (15 W, 20 s) and hot-acetone vapour (80 °C, 30 min) were applied after transferring the A-TiO2 and 2D material layers, respectively. After electron-beam lithography alignment of the active regions, 5 nm Pt/20 nm Au were deposited to form the p-FET contacts. Finally, the CFET inverter was formed by interconnecting the two pads respectively from n- and p-FETs through a via opening defined by O2/SF6 inductively coupled plasma etching, followed by Au metallization. The same via process was used for NAND and NOR logic demonstrations.
Electrical measurements
Electrical characterization of the devices was performed using a Keysight B1500A semiconductor parameter analyser mounted in a closed-cycle cryogenic probe station (at a base pressure of about 10−6 Torr). Capacitance measurements were conducted with the Keysight E5288A C-V Measurement System integrated into the B1500A platform. All devices were measured under vacuum conditions within a probe station featuring a shielded enclosure to reduce electromagnetic interference. The \(|\Delta {V}_{H}|\) extracted from Supplementary Figs. 16 and 17 is calculated via
Where \({V}_{\mathrm{th},\mathrm{forward}}\) and \({V}_{\mathrm{th},\mathrm{reverse}}\) denote the Vth extracted from the forward and backward transfer sweeps, respectively. \({D}_{\mathrm{it}}\) at the channel-dielectric interface is calculated using the expression:
where \({C}_{\mathrm{ox}}\) is the gate dielectric capacitance obtained from MIM capacitance measurements (Extended Data Fig. 2), \(q\) is the elementary charge, \({k}_{{\rm{B}}}\) is the Boltzmann constant and \(T\) is the absolute temperature. Pstatic is calculated as \({{V}}_{{\rm{dd}}}\times ({I}_{{{\rm{Static}}}_{{\rm{low}}}}+{I}_{{{\rm{Static}}}_{{\rm{high}}}})/2\) in the static regime (Vin = 0 V or Vin = Vdd).
Bias-temperature instability measurements were performed at room temperature by applying gate biases of –1 V and +2 V, respectively, for 1,000 s. After removal of the stress bias, Vth recovery was monitored through transfer measurements at Vds = 1 V. The same extraction criterion was used throughout, and the Vth shift was calculated relative to the initial value as ΔVth = Vth,t – Vth,0.
Simulation
The transport properties of the 1L-MoS2 and 2L-WSe2 FETs were investigated using DFT combined with the NEGF formalism, as implemented in the QuantumATK package60. Here, \({V}_{\mathrm{gs}}\) and \({V}_{\mathrm{dd}}\) were set to be 0.6 V. All calculations were performed using linear combination of atomic orbitals (LCAO) basis set with high accuracy and PseudoDojo pseudopotential61. The exchange-correlation functional was treated at the GGA-PBE level. For the MoS2 DG-FET, a 15 × 1 × 173 Monkhorst–Pack k-point grid is used. For the 2L-WSe2 DG-FET, a 33 × 1 × 165 grid is adopted and vdW-D3 correction is used for vdW interaction62. The gate length of both devices is set to 10 nm. Two gate dielectrics are examined for electrostatic control: SiO2 with a permittivity of 3.9 and thickness of 0.9 nm, and TiO2 with a high-κ value of 25 and thickness of 5.8 nm. The atomic compensation-charge method is used to control the doping distribution in the source and drain extensions.