 Newshot
Main
Cancers develop through a process of Darwinian evolution within tissues1,4,5,6. Mutation, drift and selection in the large cell populations making up our tissues can result in the emergence of a clone that has acquired multiple genetic and epigenetic ‘driver’ alterations that disrupt tissue homeostasis and promote uncontrolled proliferation7,8,9,10. Although large-scale sequencing efforts over the last 20 years have provided comprehensive catalogues of the driver genes responsible for cancer development11,12,13, a complete quantitative understanding of the evolutionary dynamics governing how these drivers arise, expand and compete is lacking. Why are cancer driver mutations widespread across many healthy human tissues2,14,15,16,17, yet cancers of many of these tissues are comparatively rare? Why in some people do initial clonal expansions progress to lethal cancers whereas in others they remain benign? What are the relative roles of chance and determinism in the evolution of cancer? Answers to these questions could guide more rational approaches to early cancer detection18, risk prediction19,20,21,22,23 and personalized intervention24,25.
Theories of oncogenesis on the basis of somatic evolution have existed since the 1950s and were used to explain the nonlinear increases in cancer incidence with age26. These multi-stage models highlighted important roles for mutation26,27, selection28,29 and stem-cell population sizes30. However, these models have proven difficult to falsify with age-incidence data alone. The dynamics of molecular evolution, read-out using deep sequencing of serial samples, provide a more direct measure of the evolutionary dynamics and have transformed our understanding of microbial evolution31,32,33,34,35. Applying similar approaches to cancer development, however, has proven challenging as serial samples of pre-cancerous tissue from asymptomatic individuals are difficult to obtain. Even when these tissues are available, they typically provide only a static snapshot of the somatic diversity present. To better understand the dynamics of pre-cancerous evolution requires serial samples collected with high temporal resolution.
The haematopoietic system provides a unique opportunity to understand and quantify pre-cancerous evolution because serial blood samples in asymptomatic individuals can be collected antecedent to cancer development. Healthy blood displays ubiquitous and pronounced age-related changes driven by positive selection for genetic alterations that are recurrently mutated in acute myeloid leukaemia (AML) (for example, DNMT3A, TET2 and ASXL1)19,20,21,22,23,36,37. This phenomenon, termed clonal haematopoiesis, increases the risk of future blood malignancies such as AML19,20,21,22,23. Although some aspects of clonal haematopoiesis evolution have begun to be understood quantitatively38,39,40,41,42,43, our understanding of how these age-related changes evolve into AML is incomplete. We reasoned that serial blood samples collected regularly over decade-long timescales in people who subsequently develop AML could be used to better understand the evolutionary origins of AML. By leveraging developments in error-correctable sequencing44,45 and insights from evolutionary theory32,46,47, we sought to characterize when in life the key driving events of AML occur and to gain insights into the rules governing their establishment, growth and competition.
Longitudinal sequencing of blood pre-AML
The United Kingdom Collaborative Trial of Ovarian Cancer Screening (UKCTOCS) study enrolled 202,638 cancer-free post-menopausal women, aged 50–74 years, between 2001 and 2005, of whom 50,640 were randomized into a ‘multimodal arm’ involving annual blood serum samples for up to 11 years (refs. 3,48). We identified all the women who subsequently developed AML during more than 12 years of follow-up, of whom 47 had sufficient blood sample available from at least two timepoints before AML diagnosis. These 47 women were diagnosed with AML at a median age of 72 years (range 53–83 years) and had up to 10 serial blood samples (median 5) available before diagnosis (Fig. 1a, Extended Data Fig. 1 and Supplementary Note 1). We obtained 249 pre-AML blood serum samples from these 47 women, as well as 249 timepoint-matched samples from 47 age-matched controls who remained cancer free. One control was subsequently excluded owing to development of myelodysplastic syndrome (MDS). To precisely track the evolutionary dynamics in these longitudinal samples, we designed a highly sensitive sequencing strategy called TETRIS-seq. This approach incorporates duplex error-corrected sequencing44 of a panel that comprehensively covers clonal haematopoiesis- and AML-associated genomic alterations, including gene mutations, chromosomal rearrangements and mosaic chromosomal alterations (mCAs), in combination with a custom in silico de-noising algorithm (Fig. 1b, Methods and Supplementary Note 2). Using TETRIS-seq we reliably achieved a duplex consensus depth of greater than 1,500×, enabling robust detection of single nucleotide variants (SNVs) and indels at variant allele frequencies (VAFs) ≥0.1% (Supplementary Note 2f). Using the longitudinal nature of our samples, we phased single nucleotide polymorphisms (SNPs) on sections of chromosomes affected by mCAs, enabling detection of chromosomal gains, losses and copy-neutral loss of heterozygosity (CN-LOH) events ≥5 Mb down to approximately 1% cell fraction (Supplementary Note 2k,l).
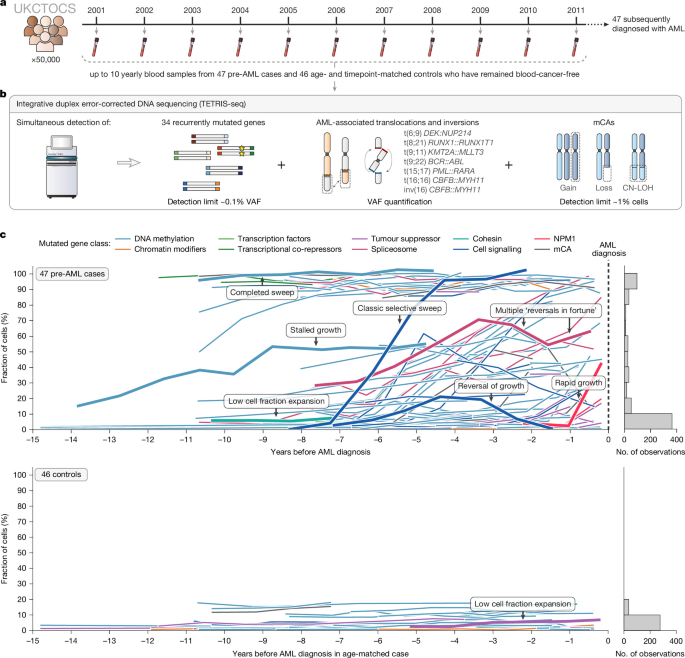
a, Longitudinal blood samples collected annually from 47 future AML cases and 46 age-matched controls from the UKCTOCS cohort, up to ten samples per individual (one per timepoint). No technical replicates were performed. b, TETRIS-seq workflow for deep duplex targeted sequencing of AML-associated genetic alterations combined with an in silico de-noising algorithm. c, Cell fraction trajectories of all variants detected at more than one timepoint in the pre-AML cases (above; n = 132 variants) and controls (below; n = 59 variants), coloured by mutation gene class (see key). Characteristic dynamic behaviours are labelled and highlighted. Histograms (right) show the distribution of cell fraction measurements across all sampled timepoints (that is, one count per variant per timepoint).
Mutation dynamics in the decade pre-AML
Applying TETRIS-seq revealed strikingly different somatic evolutionary dynamics between the pre-AML cases and the controls (Fig. 1c). In controls, we detected clonal haematopoiesis in 72% (33 of 46) of people, consistent with previous studies37,39. Variants observed in controls were typically at cell fractions less than 20% and trajectories seemed relatively stable over time (Fig. 1c). These variants were mostly in well-known clonal haematopoiesis driver genes, including DNMT3A and TET2 (Extended Data Fig. 2). In pre-AML cases, we detected clonal haematopoiesis in 89% (42 of 47) of people. Compared with controls, variants observed in pre-AML cases were substantially more abundant and exhibited large cell fraction changes over the sampling period (Fig. 1c). These variants occurred in a broader range of AML-associated genes, including spliceosome, cell signalling and tumour suppressor genes (Extended Data Fig. 2).
The cell fraction trajectories observed in pre-AML samples exhibit a broad range of qualitative behaviours, which are distinct from the controls (highlighted trajectories, Fig. 1c). We observed many examples of classic selective sweeps whereby a single variant expanded to dominate the blood. Most of these somatic sweeps had already reached fixation before the sampling period (‘completed sweeps’). We did not detect any selective or completed sweeps in the controls. We also observed examples of clonal expansions whose growth stalled, reversed or experienced multiple reversals in fortune (Fig. 1c) suggestive of frequent and strong clonal interference between parallel lineages within the same individual. These behaviours were almost exclusively observed in the pre-AML cases. Clones expanding at low cell fraction were a common feature of both pre-AML cases and controls, but were more common in pre-AML cases (histograms, Fig. 1c) and seemed to expand at faster rates pre-AML.
Clonal evolutionary histories
The highly quantitative time-series data generated by TETRIS-seq enabled us to unambiguously infer the order of driver mutation acquisition and patterns of co-occurrence in many of the 47 pre-AML cases (Fig. 2, Supplementary Note 3, ‘Inferring clonal architecture’ in the Methods and Supplementary Table 8). In 55% (26 of 47) of pre-AML cases, we observed ‘linear evolution’, characterized by the sequential acquisition and expansion of driver mutations along a single dominant ‘trunk’, with minimal evidence of side-branching (Fig. 2a–d and Supplementary Fig. 40). Within this class, however, there was substantial variation in the clonal composition of the blood in the decade before diagnosis. In 23% (11 of 47) of cases, we observed clear evidence of clonal interference, characterized by the acquisition and expansion of multiple driver clones on parallel evolutionary branches, which grew to high cell fractions (more than 10%) and interfered with each other’s growth, causing complex evolutionary trajectories (Fig. 2e–h and Supplementary Fig. 41). There was substantial variation in the dynamics observed within this class too, with examples of competition between quadruple-mutant clones (Fig. 2e), triple-mutant clones (Fig. 2h) and double-mutant clones (Fig. 2g). In both the linear and clonal interference patterns, most of the blood already derived from clones harbouring at least one pathogenic mutation in the decade pre-AML diagnosis. The remaining 21% (10 of 47) of cases are characterized by ‘late evolution’, for which the pre-leukaemic clone was detectable only 1–2 years pre-AML, if at all (Fig. 2i,j and Supplementary Fig. 42). This suggests that in some cases AML may evolve through the acquisition of uncommon driver mutations not covered by our targeted sequencing panel, that the pre-leukaemic evolution may play out while clones are below our detection limit or that the acquisition of the key drivers in these cases occurs without a long pre-leukaemic phase.
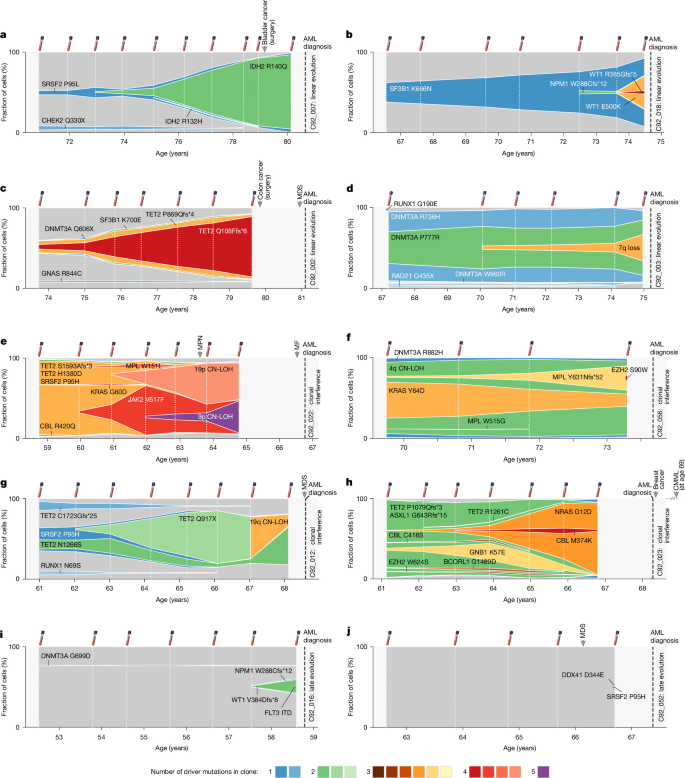
Muller plots showing inferred clonal dynamics in ten pre-AML cases, demonstrating ‘linear evolution’, ‘clonal interference’ or ‘late evolution’. Each panel is one pre-AML case. In each plot the vertical extent of a band is the fraction of cells belonging to that clone, with nested bands showing daughter clones arising within their parent, across age (x axis). Colour denotes the number of observed driver mutations in each clone (see legend); dark grey denotes the wild-type (non-driver) cell fraction. White vertical dashed lines indicate timing of UKCTOCS blood samples. Thick grey vertical dashed lines indicate time of AML diagnosis. The timing of any diagnosis of MDS, chronic myelomonocytic leukaemia (CMML) or myeloproliferative neoplasm (MPN), or pre-AML chemotherapy exposure, is indicated by labelled grey arrows (see Supplementary Table 10 for more details). a, Linear evolution: a double-mutant clone sweeps through the blood in the ~5 years before diagnosis. b, Linear evolution: a large single-mutant clone acquires further drivers in the final years before diagnosis. c, Linear evolution: a quadruple-mutant clone expands to dominate the blood. d, Linear evolution: the founding clone has already swept through the blood before sampling began, with a triple-mutant subclone expanding before diagnosis. e, Clonal interference between quadruple-mutant clones. f, Clonal interference between triple-mutant clones. g, Clonal interference between double-mutant clones. h, Clonal interference between triple-mutant clones. i, Late evolution: a putative pre-leukaemic clone first detected in the final year before diagnosis. j, Late evolution: a germline DDX41 carrier, with a small somatic DDX41/SRSF2-mutant clone detected only at the final sample. MF, myelofibrosis.
Quantitative driver mutation dynamics
We reasoned that the high sensitivity and temporal resolution of our data could be used to gain a quantitative understanding of how driver mutations expand and compete in the decades preceding AML diagnosis (Fig. 3). We developed a mathematical framework for predicting how clones expand and compete through time inspired by models of microbial evolution32,46. In this framework the dynamics of a given clone are determined by its occurrence time, fitness effect and the simplest interaction term: an increasing ‘mean fitness’ of all other clones in the population that ensures the population frequencies of all clones sum to 1. The dynamics of a specific variant are determined by summing the frequency of the original parental clone (that is, the first clone to acquire the variant) and all daughter clones that inherited the variant (Fig. 3a–c).
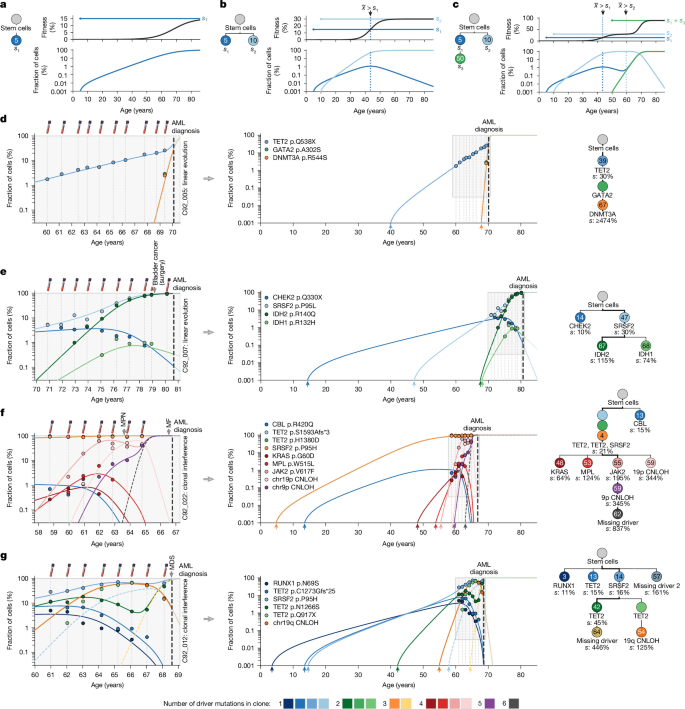
a–c, Schematics demonstrating how clonal composition (left, phylogenetic trees) and the fitness and occurrence time of each clone (top plot) interact via the population mean fitness (black line, top plot) to produce different variant frequency trajectories (bottom plot). Annotations (for example, \(\bar{x}\) > s1) mark where the population mean fitness overtakes a clone’s fitness, driving the reversals seen in the trajectory. a, A single clone expands exponentially, slowing as the mean fitness rises and it sweeps to fixation. b, Competition between two independent clones: the less fit clone declines once its fitness is overtaken by the mean fitness. c, Competition within and between branches produces multiple reversals of fortune. d–g, Measured cell fractions (data points) compared with variant frequency trajectories (coloured lines) predicted from maximum likelihood estimates of each clone’s fitness and occurrence time, during UKCTOCS blood sampling (left plots) and since birth (right plots). Uncertainties (95% optimizer range and standard deviation) are provided in Supplementary Table 9. Grey shading indicates the UKCTOCS sampling window. Grey and thick black vertical dashed lines indicate blood samples and AML diagnosis, respectively. Labelled grey arrows indicate any other haematological malignancy, pre-AML cancer diagnosis or pre-AML chemotherapy exposure (Supplementary Table 10). Phylogenetic trees (right) show each clone’s inferred occurrence time (number in circles, years), fitness effect (% per year) and number of driver mutations (colour; see key). d, Linear evolution: a TET2-mutant clone acquired at ~39 years expands slowly until two further drivers are acquired 3 years before diagnosis. e, Linear evolution: an SRSF2/IDH2 double-mutant clone sweeps the blood, while low-frequency CHEK2 and IDH1 variants decline. f, Clonal interference on the background of a triple-mutant clone that had already swept the blood, resolved by an inferred missing driver (dashed line). g, Clonal interference with two inferred missing drivers (dashed lines).
After surviving an initial stochastic drift phase, a single clone carrying a driver mutation expands exponentially at a rate determined by its fitness (where ‘fitness’ is the growth rate relative to wild-type haematopoietic stem cells (HSCs) assuming a constant effective population size). This clonal expansion causes the population mean fitness (\(\bar{x}\)) to increase, eventually causing the clonal expansion to slow down as it sweeps to fixation (Fig. 3a). Competition between two independent clones with different fitnesses can lead to the variant frequency trajectory of the less fit clone decreasing once its fitness is overtaken by the population mean fitness (Fig. 3b). Competition between clones within a branch and between branches can drive more complex variant frequency dynamics involving multiple reversals of fortune due to clones jumping ahead of, or falling behind, the population mean fitness (Fig. 3c). Using this framework, we developed a maximum likelihood approach (Methods) to infer fitness and occurrence time estimates for each clone and compare the predicted variant frequency trajectories (lines) with the measured trajectories (data points) in pre-AML cases (Fig. 3d–g, Extended Data Figs. 3–9 and Supplementary Fig. 47) and controls (Supplementary Figs. 48–55).
We observe a remarkably close agreement between the variant frequency trajectories predicted by this simple framework and the observed data. We first consider a case of linear evolution with no evidence of clonal competition (C92_005, Fig. 3d). Here we infer that a TET2 variant was acquired at around 39 years of age and expanded exponentially with a doubling time of about 2.4 years (fitness of 30% per year). Approximately 30 years later (at age approximately 67) this lineage acquires two further driver mutations that cause rapid clonal expansion, with a doubling time of about 8 weeks (fitness of ≥474% per year). Diagnosis occurs 3 years later at 70 years of age. Case C92_007 also exhibits a predominantly linear pattern of evolution (Fig. 3e). Here we infer that the first pre-leukaemic clone (SRSF2 p.P95L) is acquired at approximately 47 years of age and expands with a doubling time of about 2.5 years (fitness of 30% per year). Approximately 20 years later (at age around 67), this lineage acquires an IDH2 p.R140Q mutation, which creates a double-mutant clone that expands rapidly, with a doubling time of around 7 months (fitness effect of 115% per year). This double-mutant clone sweeps the blood when the person is in their late 70s and they are diagnosed with AML at age 80, 13 years after acquisition of the IDH2 mutation. The sweep of the double-mutant clone harbouring SRSF2 and IDH2 variants causes two low-frequency variants (in CHEK2 and IDH1) to be outcompeted, highlighting that high-frequency clones provide important information about the behaviour of low-frequency clones and vice versa.
We next considered cases with clear evidence of clonal interference (Fig. 3f,g). In C92_022 there has already been a full sweep of the blood by a clone harbouring three driver mutations (SRSF2 p.P95H and bi-allelic loss of TET2) by the time of the first sample, 8 years before diagnosis (Fig. 3f). On the background of this triple-mutant clone there is rapid evolution involving the acquisition of multiple further driver events. First, two independent clones caused by the acquisition of JAK2 V617F and MPL W515L arise at age approximately 55 and expand with doubling times of 4.3 and 6.7 months, respectively (fitness effects of about 195% and about 124% per year). These are soon outcompeted by a substantially fitter clone carrying 19p CN-LOH that is acquired at around 59 years of age and expands with a doubling time of just 2.4 months (fitness effect of about 345% per year). Remarkably, however, this lineage does not sweep. Instead, the JAK2 V617F lineage acquires two further events: a 9p CN-LOH and a subsequent event of unknown origin (‘missing driver’) that grows with a doubling time of about 1 month and sweeps the entire blood in under 2 years. Without invoking a highly fit missing driver (dashed trajectory, Fig. 3f), the variant frequencies measured at age 65 would be inconsistent with the behaviour of the observed clones. Thus, the internal consistency between the variant frequency trajectories can be used to detect events missed by our sequencing panel (Methods). C92_012 (Fig. 3g) highlights another example of clonal interference in which the observed VAF trajectories suggest the presence of two missing drivers. Despite these driver events being missed, the dynamics of the other observed driver events enable us to estimate their occurrence times and fitness effects.
Overall, these findings demonstrate that, once established in the HSC pool, the dynamics of pre-leukaemic clones are surprisingly predictable. Although we cannot exclude extrinsic effects altering some clones, one does not need to invoke more complex scenarios to explain the data: one can achieve remarkably close fits to variant trajectories by assuming clones have an intrinsic fitness and compete globally for one resource with minimal spatial structure.
Acquisition age and fitness of mutations
Applying our framework to all pre-AML cases enabled us to estimate the fitness and occurrence time of many of the key events driving AML development in these 47 cases (Fig. 4) and 46 controls (Supplementary Figs. 48–56). In approximately 80% of pre-AML cases, our data suggest that the acquisition of the key driver events plays out over decades. In two-thirds of individuals who develop AML, the first driver mutation has already been acquired by age 20 (Fig. 4b). On average, these first driver events occur more than 50 years before AML diagnosis, but expand with relatively modest fitness advantages of around 10% to 30% per year (doubling times of about 2–7 years, Fig. 4c). A third of individuals have acquired their second driver mutation by age 50 (Fig. 4b). On average, these second ‘hits’ occur around 30 years before AML diagnosis and confer a substantially larger fitness advantage to cells, causing them to expand at rates of between about 20% and 100% per year (doubling times of about 1–3 years, Fig. 4c). Remarkably, this pattern continues as the pre-AML clone acquires further driver mutations. Clones with three driver mutations grow with fitness advantages of between around 50% and 200% per year, and quadruple-mutants range from around 100% to 1,000% per year, doubling in weeks to months (Fig. 4c). This remarkable increase in fitness with the number of driver mutations acquired is close to geometric: each driver mutation acquired confers a 2–3-fold increase in the growth rate. This finding strongly suggests that pre-leukaemic mutations combine synergistically.
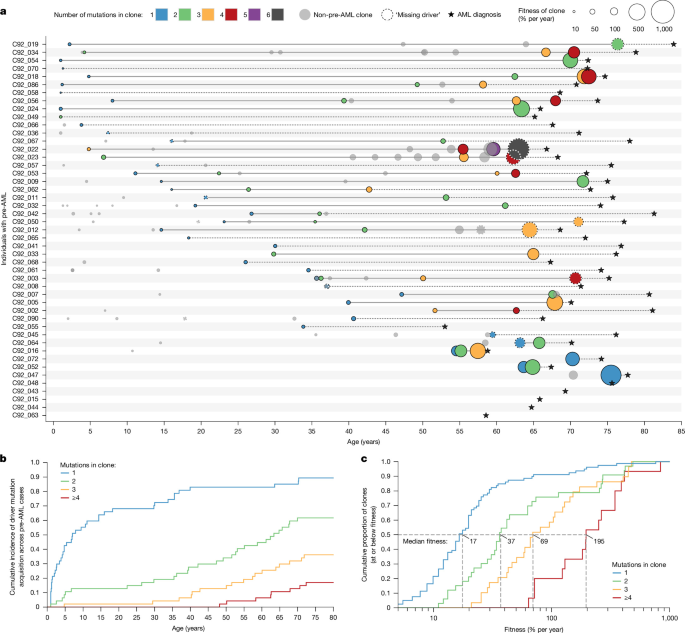
a, Occurrence time (x axis) and fitness effect (circle size) estimates for clones arising in the 47 pre-AML cases. AML diagnosis is denoted by a black star. Solid lines connect the first driver event ancestral to the AML to the last detected driver event ancestral to the AML (an estimate for the detectable pre-leukaemic window). Grey data points are clones on side branches (not ancestral to the AML). Dashed circle outlines denote a missing driver. Colour denotes the number of somatic driver mutations detected in the clone. Cases are ordered by time from first inferred driver to AML diagnosis. b, Cumulative incidence of a clone carrying one (blue), two (green), three (orange) and four or more (red) driver mutation acquisitions across all 47 pre-AML cases (n = 42, 29, 17 and 8 cases, respectively; for each case, the earliest clone harbouring at least that number of driver mutations was used). c, Cumulative distributions of fitness effects for driver mutations occurring in clones harbouring one (blue), two (green), three (orange) and four or more (red) driver mutations (n = 79, 33, 29 and 15 clones, respectively). The x axis is on a log scale demonstrating the geometric progression of fitness with driver mutation number; dashed lines indicate the median fitness for each group. Fitness and occurrence time estimates across the 46 controls are presented in Supplementary Fig. 56. Uncertainties in fitness and occurrence time estimates (95% optimizer range and standard deviation) are provided in Supplementary Table 9.
A model of blood evolutionary dynamics
The quantitative picture of the evolutionary dynamics afforded by our data highlights several important features. First, transformation usually involves the acquisition of multiple driver mutations in the same clone (range, 2–6), with considerable inter-patient variation in when these driver events are acquired. Second, pre-leukaemic clones are subject to strong positive selection, with fitness advantages that vary by two orders of magnitude: ranging from 10% per year for the least fit single-mutant clones to 1,000% per year for the fittest quadruple-mutant clones. Third, the variant frequency trajectories exhibit diverse qualitative behaviours, suggesting strong clonal competition in some cases (for example, C92_012 and C92_022) but a complete absence of competition in other cases (for example, C92_005 and C92_007).
We hypothesized that many of these features may be emergent properties of a stochastic evolutionary model governed by a simple set of rules. To test this, we developed a model of the clonal dynamics inspired by previous models of microbial evolution32,46,47, which we modified to incorporate key experimental observations (Methods). In this model, blood is maintained by a population of N cycling HSCs that divide symmetrically every \(\tau \) years (Fig. 5a). HSCs acquire driver mutations at a rate of U per year. Driver mutations vary in the fitness effects they confer to HSCs. A driver mutation arising in a wild-type HSC, creating a single-mutant clone, confers fitness advantages drawn from a distribution with a median and range controlled by a single parameter, s ≈ 16% per year (Methods). A driver mutation arising in a single-mutant clone confers a median fitness effect that is r = 2.5-fold larger (s ≈ 40% per year), creating a double-mutant clone. Triple-mutant and quadruple-mutant clones follow the same geometric pattern (with median fitness effects of s ≈ 100% and s ≈ 250% per year, respectively). In this framework, transformation to frank AML is defined by the acquisition of four driver mutations within the same clone that reaches greater than 50% of the cell fraction before the age of 85. Using established estimates for \(N\tau \) = 105 (refs. 38,39,41), U ≈ 10−5 per year (ref. 40) and s ≈ 16% per year for single-mutant fitness effects39,42,43, we simulated the clonal dynamics in 200,200 simulations and considered the evolutionary dynamics observed in the decades preceding the around 900 virtual incidental AMLs (Fig. 5b–d).
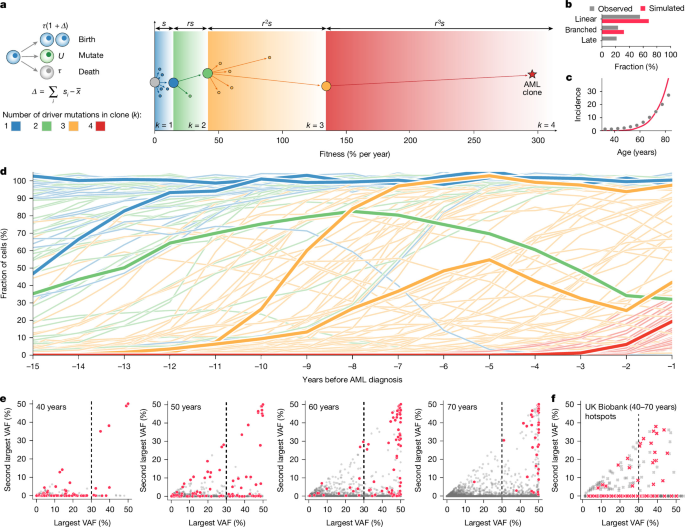
a, A stochastic branching model (right) and schematic (left) of how clones (circles) acquire driver mutations to give rise to daughter clones. Driver mutations confer increasingly large ‘jumps’ in fitness (x axis) from wild-type HSCs (grey), to single- (blue), double- (green), triple- (orange) and quadruple-mutant clones (red). Simulated AMLs are defined by clones that acquire four driver mutations (red star). Clone growth rates are determined by relative fitness (Δ) between the clone and the mean fitness of all other clones in the population (\(\bar{x}\)). b, Fraction of observed pre-AML cases (grey, n = 47) and simulated AMLs (red, n = 943; from 200,200 simulations) assigned to linear, branched or late evolutionary patterns (classified as in the Methods). Observed: 26 of 47 linear, 11 of 47 branched, 10 of 47 late. Simulated: 642 of 943 linear, 301 of 943 branched, 0 of 943 late. c, Age-incidence (per 100,000 per year) of simulated AMLs (red, 200,200 simulations; cumulative risk to age 85, 0.47%) and clinically detected AMLs (grey, data from Cancer Research UK50; 0.48%). d, Variant allele trajectories for the first 50 of the 943 incidental simulated AMLs, coloured by the number of driver mutations in the clone. e, Joint frequency plots of the VAFs of the largest and second largest variants in simulated individuals, at ages 40, 50, 60 and 70. For legibility, a sample of 100 of the 943 future AML cases (red) and up to 4,000 of 199,257 controls per panel (grey) are plotted. The vertical line marks largest VAF = 30%; points to its right have undergone at least one somatic sweep (VAF > 30%). f, As in e, for variants at one of 27 clonal haematopoiesis hotspot positions (Methods) detected in the UK Biobank (age approximately 40–70). Future myeloid leukaemia cases (red; n = 114) and controls (grey, n = 4,920). Individuals with a somatic sweep had an increased risk of future myeloid leukaemia (odds ratio = 107, 95% confidence interval 75–150; P = 2.7 × 10–67, two-sided Fisher’s exact test). Vertical line as in e.
Despite its simplicity, this model reproduces many of the qualitative and quantitative features observed in our data. Both linear and branched patterns of evolution emerge under this model, with the linear pattern predicted to be more common (Fig. 5b). The model predicts a strongly increasing incidence of AML with age, in close quantitative agreement with the observed real-world incidence of AML (Fig. 5c). The variant frequency trajectories in the decades preceding virtual AMLs in this model also exhibit a similar spectrum of qualitative behaviours to the observed pre-AML cases, including examples of selective sweeps, reversals of growth, multiple reversals of fortunes and late rapid expansions (Fig. 5d). Despite the simulated controls being governed by an identical evolutionary process, these behaviours are almost entirely absent from controls (Extended Data Fig. 10a–d), demonstrating the profound effect that conditioning on a rare outcome can have on the observed dynamics.
We next explored whether this model could provide insights into features of the evolutionary dynamics that identify future AML cases. Simulated variant frequency trajectories plotted over a 50-year period revealed that most future AMLs in this model derive from instances in which a single-mutant or double-mutant variant has already completely swept the blood more than a decade before virtual AML (Extended Data Fig. 10e). To check how predictive these somatic sweeps are of future AML, we considered all simulated individuals that acquired at least one driver variant that could have been filtered out as ‘germline’ in low-depth sequencing data (VAF > 30%), broken down by age (Fig. 5e). In our evolutionary model, around 99% of virtual AML cases have had at least one full somatic sweep more than 5 years before diagnosis and about 98% have had at least one sweep more than 10 years before diagnosis. The presence of a second somatic driver (VAF > 10%) in addition to the first sweep identifies a group at high risk of future AML, with a positive predictive value about 88% (44 of 50) at age 40, about 75% (214 of 292) at age 50, about 50% (564 of 1,152) at age 60 and about 22% (719 of 3,313) at age 70.
The presence of somatic sweeps could be used to identify groups at high risk of future AML that have previously been missed owing to the inability to distinguish somatic sweeps from germline variants21,22. To demonstrate this, we considered individuals in the UK Biobank whose baseline blood sample contained somatic variants at VAFs high enough to be hard to distinguish from germline variants in low-depth whole-exome sequencing or whole-genome sequencing data (VAF > 30%, Fig. 5f). Considering variants at well-known somatic hotspot positions (Methods), in which the likelihood of germline variation is substantially lower, we find that individuals with at least one somatic sweep are at considerably increased risk of a future myeloid leukaemia relative to those without (odds ratio 107, 95% confidence interval 75–150, P = 2.7 × 10–67, Fisher’s exact test). This finding suggests filters imposed for removing germline variants from somatic variant calls may be removing complete somatic sweeps that are strongly associated with future AML risk.
Discussion
These data have produced a quantitative picture of how AML evolves from precursor clones in the decades preceding diagnosis. Estimates for the acquisition ages and fitness effects for the key driving events highlight that in most cases the first steps of the multi-step path to AML occur early in life. In these early stages the blood is usually polyclonal with multiple single-mutant clones expanding in parallel from low cell fraction, as observed in clonal haematopoiesis41. The fitnesses of these early pre-leukaemic clones are similar to those observed in clonal haematopoiesis39,42,43 and in our age-matched healthy controls. The dynamics of early driver variants are still dominated by positive selection rather than drift, but they expand slowly: taking years to double in size and decades to become detectable.
The acquisition of further drivers on the background of these initial slow-growing clones seems to be a defining difference between controls and future AML cases. In most pre-AML cases the initial slow-growing clone produces daughter clones carrying two, and later three or four, driver mutations that grow far more rapidly than the single-mutant clones. In controls such multiple-mutant clones are rare: a double-mutant clone expanding to high VAF is expected to occur in fewer than 1 in 3,000 60-year-olds (Fig. 5e). At these later stages, the blood is often oligoclonal: multiple double- and triple-mutant clones arise on independent lineages and, because of their larger fitness effects, expand and compete with each other, producing classic patterns of clonal interference31,46,49. These patterns emerge when the population size is large enough that fitness-increasing mutations are not rare, but not so large that they are very common (\(\theta =N\tau \mu \,\approx 1\)). Given existing estimates for \(N\tau \) ≈ 105 years in humans38,39,41, our data indicate that, at every point in the multi-stage path to AML, the rate at which driver mutations are acquired is around 10−5 per cell per year, consistent with thousands of sites in the genome offering mutational paths to increasing fitness. Although fitness-increasing mutations are common at every stage, the probability that the full complement of drivers required for transformation are acquired in a given person is a small, albeit strongly increasing, function of age. This conceptual framework may therefore partially reconcile the fact that cancer drivers are common in healthy tissues2,14,15,16,17, while still predicting that cancer itself would be relatively rare50. This evolutionary framework may also provide a natural way of incorporating recent findings on environmental risk factors51. Exposures that increase the fitness of mutant clones would potentially promote oncogenesis, whereas exposures that suppress it would be protective.
Stochasticity plays a crucial role in these dynamics. The acquisition of highly fit double- and triple-mutant clones early in life seems to be a key determinant of future AML risk. This is exemplified by early complete sweeps of the blood in which all blood cells derive from a single HSC ancestor. We observe this in at least a third of the 47 pre-AML cases—a conservative estimate as our panel misses some driver events. Identifying early somatic sweeps in large-scale cohorts such as the UK Biobank is challenging owing to filtering of germline variants at high VAF. We speculate that risk prediction for future AML may be substantially improved by identifying somatic sweeps, for example, by removing germline contaminants using a second tissue sample such as buccal swabs.
The fact that the second and third ‘hits’ typically occur more than a decade before diagnosis provides a long window of opportunity for intervention. The IDH2 R140Q double-mutant in C92_007 is a case in point. It expands exponentially for 14 years with a fitness effect of approximately 115% before diagnosis (Fig. 3e). Were the growth of this clone to be reduced (for example, using an IDH inhibitor24 or a neoantigen vaccine25), it is tempting to speculate whether AML could have been prevented. Owing to the exponential nature of the clonal growth, even modest reductions in growth rate, compounded over decades, can have a profound effect on the size of pre-leukaemic clones and thus on the probability of them acquiring further transforming mutations. We therefore speculate that low-toxicity interventions producing such reductions in high-risk clones may substantially reduce the risk of transformation.
A limitation of our study is that we do not have direct access to diagnostic material, meaning we cannot be certain that the clones detectable in the pre-AML samples actually gave rise to the AML. Furthermore, in some cases it is likely that the final transforming event occurs after our last blood sample. Indeed, there are interesting differences between the spectrum of mutations we find in pre-AML and those typically seen at AML diagnosis, for example, in patients aged 60 years or over, NPM1 and FLT3 mutations are found in 25–35% of cases52, and the chromosomal rearrangements targeted in our study are found in about 10% (ref. 53), yet both are rare in our cohort. Their absence in our samples strongly suggests they are late-occurring events. Approximately 20% of pre-AML cases in our cohort display either no clonal expansions or only rapid expansions limited to the 1–2 years before diagnosis. Evidence from deep targeted methylation sequencing54 strongly suggests 50% (5 of 10) of these cases do contain a pre-existing clonal expansion (for example, C92_048, C92_052, C92_072), whereas others do not (for example, C92_055, C92_063). Two of these expansion-positive cases (C92_048 and C92_052) carried germline DDX41 variants. A clinical limitation of this study is that information on antecedent myeloid disease and previous chemotherapy was derived from registry linkage rather than direct clinical record review. Registry-based ascertainment may not capture all diagnoses or treatments. These factors limit the completeness and certainty of ontogeny classification (for example, de novo versus secondary AML), although a subset of cases had clearly documented antecedent myeloid disease or previous cytotoxic therapy allowing confident classification (Supplementary Note 5). Importantly, incomplete ontogeny classification reflects not only limitations of clinical data capture but also the fact that early myeloid disease may remain clinically silent, particularly in older adults in whom age-related clonal haematopoiesis is common. Accordingly, our cohort reflects the spectrum of biological and clinical backgrounds typical of AML arising in older adults, and the evolutionary dynamics identified represent processes operating across this real-world population rather than a single ontogeny-defined subgroup.
Our model assumes a constant effective HSC population size, and biological factors such as pre-leukaemic stem-cell expansion or differentiation blocks could influence the relationship between VAF and true clonal burden. Consequently, our fitness estimates should be interpreted as the effective competitive advantage relative to the background population.
A surprising finding in our data was how predictable and deterministic the dynamics of established clones are. Variant trajectories are remarkably consistent with the simplest model of clonal competition: that is, that clones compete only via a global interaction term requiring that their frequencies sum to 1. This suggests that, by the time clones have grown to be greater than 0.2% cell fraction in the blood, the effects of spatial structure in the bone marrow are averaged out owing to mixing and re-seeding of multiple niches55,56.
One aspect of the simple evolutionary model that does not agree with the observed data is the 20% of cases exhibiting late evolution. Our multi-stage model generally predicts such cases to be very rare. We believe there are two possible explanations. First, the model does not account for AML driven by a single ultra-rare event, for example, an AML-defining translocation such as t(15;17); PML::RARA. Second, it is possible that a pre-leukaemic clonal expansion has occurred outside of our sequencing panel. Although we do target the vast majority of known AML drivers, it is likely there remain rare AML drivers to be discovered, as suggested by clonal expansions of unknown genetic origin seen in clonal haematopoiesis41. This probably explains some of the cases, such as C92_052, for which our analysis of methylation54 strongly suggests the presence of a fully swept clone.
Our ability to measure how somatic evolution shapes, and is shaped by, disease risk is a new frontier of human genetics57. The haematopoietic system is an ideal model for developing a quantitative understanding of somatic evolution owing to its ease of sampling, its relative lack of spatial structure and the existing quantity of large datasets. Our work is a step towards a complete quantitative understanding of AML development. Further work is needed to understand whether and to what extent these principles translate to other cancers.
Methods
Longitudinal peripheral blood DNA samples
Longitudinal peripheral blood DNA samples were obtained from blood serum samples biobanked as part of UKCTOCS (ISRCTN22488978; ClinicalTrials.gov identifier: NCT00058032). UKCTOCS is a multi-centre randomized controlled trial that recruited 202,638 post-menopausal women aged 50–74 years, from England, Wales and Northern Ireland between 2001 and 2005, to assess the impact of screening on ovarian cancer mortality3. UKCTOCS eligibility criteria and trial details have been described previously58. UKCTOCS was reviewed and approved by the North West Multi-centre Research Ethics Committee (REC reference 00/8/34) and participants provided written, informed consent for use of their samples and data in ethically approved secondary studies. Our study, using UKCTOCS samples and data, was reviewed and approved by the South Central Berkshire B Research Ethics Committee (REC reference 18/SC/0481). This study was performed in accordance with all relevant guidelines and regulations.
At UKCTOCS enrolment, 50,640 participants were randomized to a ‘multimodal screening arm’, which involved annual blood serum samples for up to 11 years, until 31 December 2011. All samples were collected using a standardized protocol. Blood was collected in gel tubes (8-ml gel separation serum tubes; Greiner Bio-One 455071) at the trial centres and transported daily at room temperature to a central laboratory, where the samples were centrifuged (1,500g for 10 min) and the separated serum aliquoted into 10 × 500-µl straws using a semi-automated MAPI platform (IMV). The straws were stored in liquid nitrogen tanks at the central laboratory, which, when full, were transported to an HTA licensed commercial cryofacility (Fisher Bioservices, UK, until March 2018, NIHR Biocentre April 2018 to July 2023 and BioDock since then). The median time from sample collection to centrifugation (about 22.1 h) resulted in leukocyte DNA leaking into the serum59. UKCTOCS participants’ health outcomes were followed via linkage to national cancer, death and administrative registries. By 2017, there were 47 women in the ‘multimodal screening arm’ that had incidentally developed AML (ICD-10 C92.0) and had sufficient serum sample available from at least two timepoints before AML diagnosis. These 47 women were diagnosed with AML at a median age of 72 (range 53–83 years, interquartile range 8 years) and had serum samples biobanked from a median of 5 timepoints (range 2–10, interquartile range 3.5) before AML diagnosis (Extended Data Fig. 1a,b). We obtained 1 ml of serum from each of the yearly timepoints available (249 samples) from these 47 women (‘pre-AML cases’), as well as from timepoint-matched serial samples from 47 age-matched UKCTOCS participants who remained blood cancer free (‘controls’). One control was subsequently excluded owing to development of MDS. No statistical methods were used to predetermine sample size; all eligible pre-AML cases were included. Randomization was not applicable as this was an observational study, and investigators were not blinded to case–control status during sequencing and analysis. DNA was extracted by LGC Genomics, using an adapted Kleargene method with mag beads on KingFisher 96, and eluted in 10 mM Tris-Cl, pH 8.0. The DNA was quantified using PicoGreen, yielding an average of 279 ng ml−1 DNA (range 11–814 ng ml−1 serum) in the pre-AML samples and 270 ng ml−1 DNA (range 11–1,313 ng ml−1 serum) in the control samples (Extended Data Fig. 1c).
Information on any diagnosis of MDS (ICD-10 code D46 or C94.6), CMML (ICD-10 code C93.1) or MPN (ICD-10 codes D45, D47.1, D47.3, D47.4, C92.1, C92.2, C94.4), or other haematological malignancy (for example, lymphoma or myeloma), was obtained for all pre-AML cases and controls via record linkage to the National Cancer Registry (England/Wales), Hospital Episodes Statistics (HES) databases or the Patient Episode Database for Wales (PEDW), the Office for National Statistics mortality records and, for participants in Northern Ireland, the Central Services Agency and Northern Ireland Cancer Registry. Information on diagnoses of non-haematological malignancies was also obtained via linkage to national cancer registries and HES/PEDW databases and Office for National Statistics mortality records. These clinical diagnoses were extracted to characterize antecedent myeloid disease, previous malignancies and treatment exposures that provide clinical context relevant to secondary and therapy-related AML frameworks (see Supplementary Note 5 for detailed case annotations). Where a diagnosis appeared in more than one data source, the earliest recorded entry was taken as the date of diagnosis. Recorded diagnosis dates therefore reflect the first appearance of a diagnosis in national records and may not correspond to biological disease onset. Potential miscoding was assessed by triangulating across available sources: diagnostic entries that appeared only once in HES/PEDW and were discordant with other HES/PEDW episodes, cancer-registry data or death certificate information were treated as probably miscoded and excluded. Information on receipt of chemotherapy (ICD-10 codes Z51.1, Z51.2, Z92.6) or radiotherapy (ICD-10 codes Z51.0, Z92.3) before AML diagnosis (or, for controls, before the matched case’s age at AML diagnosis) was obtained from the HES databases and PEDW. For participants with a record of chemotherapy, the indication was determined by cross-refereeing diagnostic codes in HES/PEDW and/or cancer registry data. Chemotherapy codes temporally associated with AML diagnosis and lacking evidence of a prior malignancy were considered AML-directed and were not classified as pre-AML exposure. No pre-AML case or control was recorded as having received previous radiotherapy. Smoking information, where available, was obtained from UKCTOCS participant questionnaires and HES databases (ICD-10 code Z72.0). The last updates from all linkage sources were received in 2020. As HES and PEDW cover only NHS-funded care in England and Wales, it is possible that diagnoses or treatments delivered privately, abroad or elsewhere in the United Kingdom may not have been captured. Supplementary Table 10 summarizes the timing of any recorded diagnosis of MDS, CMML, MPN or other haematological or non-haematological malignancy, as well as previous chemotherapy exposure and smoking history, for all pre-AML cases and controls, with mortality outcomes (cause of death and survival interval) summarized for pre-AML cases only.
Cell-type deconvolution
To estimate the proportions of different blood cell types (B cells, natural killer cells, CD4+ T cells, CD8+ T cells, monocytes, neutrophils and eosinophils) present in the samples, we used the R package EpiDISH with the reference dataset ‘centDHSbloodDMC.m’60. Whole-genome bisulphite libraries were prepared for 94 UKCTOCS samples from 23 pre-AML cases and 23 controls, some of whom contributed more than one longitudinal timepoint. Of these 94 samples, 88 met the minimum coverage criterion (at least 286 of 333 CpGs covered) and were included in the deconvolution analysis (average depth 7×). Each sample was deconvoluted individually, using the reference CpGs covered in that sample (Supplementary Note 1 and Supplementary Fig. 1).
TETRIS-seq custom panel design
To ensure we could track the evolution of a comprehensive array of clonal haematopoiesis- and AML-associated genomic changes in the longitudinal pre-AML samples and control samples, we developed two separate targeted panels, to be used on the same input DNA sample, in an integrated library preparation approach: a small panel (around 58 kilobases (kb)) specifically for SNVs and indels and a large panel (around 1.6 (megabases (Mb)) for mCA, chromosomal rearrangement and KMT2A partial tandem duplication (KMT2A-PTD) detection (Supplementary Note 2).
For the SNV and indel panel, we designed a custom set of 120-nucleotide (nt) oligonucleotide probes (TWIST Biosciences) targeting commonly mutated exons within 34 genes commonly mutated in clonal haematopoiesis and AML (Supplementary Figs. 2–5 and Supplementary Table 1): ASXL1, BCOR, BCORL1, CBL, CEBPA, CHEK2, CSF3R, DDX41, DNMT3A, EZH2, FLT3, GATA2, GNAS, GNB1, IDH1, IDH2, JAK2, KIT, KRAS, MPL, NPM1, NRAS, PPM1D, PTPN11, RAD21, RUNX1, SF3B1, SRSF2, STAG2, TET2, TP53, U2AF1, WT1 and ZRSR2.
For the mCA, chromosomal rearrangement and KMT2A-PTD panel, we designed a custom set of 120-nt oligonucleotide probes (TWIST Biosciences) targeting a total of 10,326 common SNPs (minor allele frequency > 0.01) spaced every approximately 280 kb across the genome to allow the detection of mCAs (Supplementary Table 2). Using this approach, deviations in heterozygous SNP B-allele frequencies (BAFs) can be detected, which, when combined with read depth information, enable detection of a gain, loss or CN-LOH event. For detection of chromosomal rearrangements, a custom set of 120-nt oligonucleotide baits (TWIST Biosciences) was designed to target the known breakpoint regions of each of the rearranged partner chromosomes61,62,63,64 of seven chromosomal rearrangements that define specific subcategories of AML in the World Health Organization AML classification65: t(6;9) DEK::NUP214, t(8;21) RUNX1::RUNX1T1, t(9;11) KMT2A::MLLT3, t(9;22) BCR::ABL, t(15;17) PML::RARA, t(16;16) CBFB::MYH11 and inv(16) CBFB::MYH11 (Supplementary Fig. 6 and Supplementary Table 3). KMT2A is renowned for having numerous possible breakpoint partners and so further common breakpoint regions in KMT2A were also targeted66. KMT2A-PTDs most commonly involve exon 2 or 3 and span through exons 9 to 11 (ref. 67). They can be detected by observing a relative increase in read depth, starting from exon 2 or 3, compared with an exon that is never involved in KMT3A-PTD (for example, exon 27)68. A custom set of 120-nt oligonucleotide baits (TWIST Biosciences) was therefore designed to target KMT2A exons 2–27 (Supplementary Table 3).
TETRIS-seq error-corrected library preparation and sequencing
TETRIS-seq library preparation was performed as per the ‘TWIST custom panel enrichment workflow’ (TWIST Biosciences), but with adaptations to allow for incorporation of duplex unique molecular identifiers (UMIs), for error-corrected sequencing, and to allow for the use of two targeted panels on the same input DNA. DNA yield varied between UKCTOCS samples (Extended Data Fig. 1), but for each timepoint the same amount of input DNA was used for both the pre-AML sample and matched control (mean 43 ng, median 50 ng, range 4.5–80 ng).
Briefly, DNA was enzymatically fragmented (using the Twist Biosciences proprietary enzyme mix), end-repaired and dA-tailed at 32 °C for 21–24 min (Supplementary Table 4). IDT xGen CS adaptors (5.5 µl of 10 µM), containing 3-bp duplex UMI sequences, were then ligated to each end of the DNA fragments at 20 °C for 15 min, followed by bead purification using 0.8× DNA Purification beads (Twist Biosciences). The duplex UMI-tagged fragments were PCR amplified in a 50-µl reaction volume (25 µl of KAPA HiFi HotStart ReadyMix (Roche Diagnostics), 10 µl of IDT xGen unique dual index primers (10 µM), 15 µl of duplex UMI-tagged fragments). The following conditions were used for PCR amplification: 98 °C for 45 s; 11–12 cycles of 98 °C for 15 s (Supplementary Table 5), 60 °C for 30 s, 72 °C for 30 s; 72 °C for 1 min. Following bead purification, using 1× DNA Purification beads (Twist Biosciences), the amplified UMI-tagged dual index-labelled fragments were eluted into 22 µl of ddH2O and then visualized and quantified using the Agilent 2200 TapeStation.
Following quantification, each sample was divided in two: one half for the SNV/indel panel and the other half for the mCA/chromosomal rearrangement panel. Samples were pooled together in groups of eight (187.5 ng of each indexed sample), with separate pools for each of the two panels. The pooled samples were concentrated, using 1.5× Agencourt AMPure XP beads (Beckman Coulter), and then hybridized to the custom panel probes (SNV/indel panel probes or mCA/chromosomal rearrangement panel probes) in a thermocycler at 95 °C for 5 min followed by 70 °C for 16 h. Following Streptavidin bead capture (30 min at room temperature), the captured DNA was PCR amplified in a 50-µl reaction volume (25 µl of KAPA HiFi HotStart ReadyMix (Roche Diagnostics), 2.5 µl of TWIST amplification primers, 22.5 µl of captured DNA) under the following conditions: 98 °C for 45 s; 12 cycles (mCA/chromosomal rearrangement panel) or 17 cycles (SNV/indel panel) of 98 °C for 15 s, 60 °C for 30 s, 72 °C for 30 s; 72 °C for 1 min. Following bead purification, using 1× DNA purification beads (Twist Biosciences), samples were eluted into 32 µl of ddH2O and then visualized and quantified using the Agilent 2200 TapeStation. Samples were then diluted to 10 nM and submitted for sequencing. Libraries were sequenced on the Illumina NovaSeq 6000 S4 (Cancer Research UK Cambridge Institute Genomics Core Facility) using the XP workflow, with 150-bp paired ends reads, 8-bp reads in index 1 and 8-bp reads in index 2. Forty samples were sequenced per lane, with 10% PhiX control DNA spiked into each lane. SNV/indel and mCA/chromosomal rearrangement panels were sequenced in different lanes and, with only a few exceptions, timepoints from the same individual were sequenced on different lanes. Each sequencing run contained around 3 billion reads per lane (around 68 million reads per sample). For the SNV/indel panel (around 58 kb, 589 probes), this equated to a raw depth (pre-consensus calling) of approximately 50,000×. For the mCA/chromosomal rearrangement panel (around 1.6 Mb, 13,114 probes), this equated to a raw depth of approximately 1,000×.
A custom computational workflow was written for the processing of the sequencing data. This workflow used a number of software packages, including Picard69, Fulcrum Genomics fgio package70, Burrows–Wheeler Aligner (BWA)71, the Genome Analysis Toolkit (GATK)72, SAMtools73, VarDictJava74, Pindel75 and ANNOVAR76, as well as several custom Python scripts. The workflow consisted of four main steps (Supplementary Note 2c): (1) UMI extraction and initial alignment; (2) single strand consensus sequence (SSCS) calling; (3) duplex consensus sequence (DCS) calling; and (4) putative variant detection. For the SNV/indel panel, variants were called from DCS files. The same depth accuracy was not required for the mCA, KMT2A-PTD and chromosomal rearrangement panel and so only the SSCSs were used for these.
TETRIS-seq in silico noise correction model for SNV calling
The theoretical error rate of duplex sequencing is less than 10−9 errors per bp, which is simply the probability of two complementary errors occurring at the same nucleotide position on both DNA strands, either spontaneously or during the first PCR cycle44. In reality, however, library preparation artefacts, for example, due to sonication, end-repair and mapping errors45, have all been shown to slip through the duplex error correction. Therefore, to be able to reliably call variants at ultra-low frequency, we developed an in silico noise correction method for SNV calling (Supplementary Note 2). Our noise correction model is based on the null hypothesis that each base-change at a position in the panel has a specific error rate (\(\varepsilon \)) and the number of variant reads (k) observed in a sample at that position would be consistent with beta-binomial sampling at that specific error rate. A custom Python script was written to infer the error rate (\(\varepsilon \)) and dispersion (\(\delta \)) values for each possible single nucleotide base-change at each position in the panel (hereafter referred to as simply ‘position’) and samples were called as ‘real’ variants if their variant read count was inconsistent with this distribution of errors. First, samples with a VAF > 10% at the position were automatically called as real and excluded from the subsequent analysis. Then, the remaining samples at the position were used to fit a beta-binomial distribution (or a binomial distribution if there were ≤3 samples with ≥1 variant reads). The beta-binomial (or binomial) P values for all the samples with ≥1 variant reads were calculated and a sample was called as a real variant if it’s P value was less than a P value threshold (6 × 10⁻⁶) that gave a false discovery rate of less than 5% (Supplementary Note 2). When fitting a binomial or beta-binomial error distribution to a position only once, a problem arises if more than one sample at the position has a ‘real variant’. The problem is that the lower VAF variants will not be called as they will be fitted as ‘errors’ within a falsely over-dispersed beta-binomial distribution or a binomial distribution with a falsely elevated error rate. We therefore chose to use an iterative approach for positions observed in haematopoietic and lymphoid tissues in COSMIC v.92 (ref. 61) (around 2% of sites across our custom panel), where we might expect to see more than one sample with a real variant in our pre-AML cohort. Similarly, if more than one timepoint sample from the same individual was sequenced on the same sequencing lane, an iterative approach was used for positions at which one of those samples had been called as a real variant. The iterative approach at the position was continued until no further samples from the individual with multi-timepoint samples were called as real. Our in silico noise correction model was applied to all the samples sequenced on the same sequencing lane (around 40 samples) and then further post-processing filters were applied as detailed in Supplementary Note 2g. Somatic variant calls can be found in Supplementary Table 6. On individual trajectory plots, germline variants were annotated where they were rare (absent from ExAC, or with a population allele frequency less than 1%) and not classified as benign or probably benign in ClinVar; genotype (heterozygous or homozygous) was inferred from the mean VAF across timepoints.
TETRIS-seq indels, FLT3 internal tandem duplications and chromosomal rearrangements
Indels were called from DCS files using VarDictJava74 and post-processing filters were applied as detailed in Supplementary Note 2. FLT3 internal tandem duplications (FLT3-ITDs) were identified using Pindel75 and were called as real if detected in both the SSCS and DCS files. A custom chromosomal rearrangement caller was written in Python and validated using serial dilutions of samples with known chromosomal rearrangements (Supplementary Note 2i). The caller used a step-wise algorithm to identify four classes of chromosomal rearrangement. Calling was restricted to the common breakpoint regions of AML-associated rearrangements that were specifically targeted by our sequencing panel (Supplementary Fig. 6). Discordant read pairs and their supplementary alignments were first extracted from these targeted regions to identify candidate breakpoints. Depending on the read configuration, one or both breakpoint partners could be inferred. For discordant reads for which only one partner was identified, soft-clipped regions ≥10 bp were ‘remapped’ by comparing them with breakpoint partner sequences already identified from at least three read pairs; a match was assigned if there was more than 95% sequence match. Concordant soft-clipped reads without discordant alignments were similarly ‘remapped’ by comparing them with breakpoint partner sequences that had been identified by at least five read pairs. VAFs were calculated for each breakpoint as the ratio of supporting reads to local read depth, and the higher of the two breakpoint VAFs was reported. Breakpoint coordinates were annotated using ANNOVAR76 and all calls were subsequently post-processed to refine breakpoint coordinates, remove artifacts and collapse multiple read-based events corresponding to the same underlying rearrangement (Supplementary Note 2i). Chromosomal rearrangement calling was initially performed on the pre-consensus BAM files, but any rearrangements that remained after post-processing were recalled on the SSCS BAM file to enable more accurate VAF quantification.
TETRIS-seq mCA and KMT2A-PTD calling
To detect KMT2A-PTD events, a custom Python script was written (using pysam77 pileup) to calculate the mean read depth across each targeted KMT2A exon. These mean depths were then normalized to the mean read depth across KMT2A exon 27 and the exon 3:27 ratio (R) calculated. The fraction of cells harbouring the KMT2A-PTD is calculated as follows: cell fraction = 2(R − 1) (Supplementary Note 2j).
mCAs were detected from SSCS reads using a custom Python-based caller, developed to exploit both deviations in heterozygous SNP BAFs and read depths (log2R ratios; LRR) in the mCA/chromosomal rearrangement panel, as well as longitudinal haplotype phasing information derived from timepoints at which the same mCA was present at higher cell fraction (Supplementary Note 2k). Loss and gain events result in deviations in both LRR and BAF whereas CN-LOH events result in BAF deviations without a change in LRR (because there is no change in the amount of genetic material) (Supplementary Fig. 25). LRR values were computed from read depths normalized to a panel of normals constructed from 36 control samples, using a leave-one-out strategy for samples within the panel of normals. Five complementary detectors were run independently per chromosome, targeting different signatures of allelic imbalance and copy-number change: a BAF sliding-window detector (run at three window sizes to capture events across a range of sizes), an LRR-first detector, a homozygous-region detector for high cell fraction CN-LOH and loss events, a small-gains detector targeting trisomy-pattern BAF splits and an arm-level detector for subtle whole-arm events. Candidate events were classified as gain, loss or CN-LOH by selecting the event type whose expected LRR best matched the observed LRR, given the BAF-derived cell fraction estimate. Cell fraction was estimated from the heterozygous BAF peak separation using the formulae in Supplementary Table 16. Calls from all five detectors were merged and deduplicated, and CN-LOH events detected at 100% cell fraction at both the earliest and latest available timepoints were classified as likely to be germline and excluded. On the basis of evaluation against an independent simulated test set, which demonstrated substantially reduced sensitivity for events less than 5 Mb, only events greater than or equal to 5 Mb were retained for all downstream analyses (Supplementary Figs. 26–29).
For individuals in whom a somatic mCA was detected, all available longitudinal samples were sequenced and a custom phased longitudinal caller was applied. Haplotype phase was derived from the ‘index sample’, defined as the timepoint closest to AML diagnosis for cases (or the matched timepoint for controls), with the exception of one case (C92_012) in whom the mCA was below the detection of the unphased caller at this timepoint, and so their preceding timepoint was used as the ‘index sample’ instead. Phase was assigned in the ‘index sample’ by comparing each heterozygous SNP’s BAF relative to 0.5. These phase assignments were then applied to all other available timepoints from the same individual, and a one-sided one-sample t-test was used to assess whether the mean phased BAF deviation significantly exceeded zero (P < 0.05). Cell fraction was estimated from the mean phased deviation using event-type-specific formulae (Supplementary Table 16). On simulated test data, the phased caller achieved a 50% sensitivity detection threshold of approximately 1% cell fraction, compared with 20–25% cell fraction for the unphased caller (Supplementary Figs. 26–29). Somatic mCA calls detected in the UKCTOCS pre-AML cases and controls can be found in Supplementary Table 7.
Inferring clonal architecture
A hierarchical step-wise process was used to infer whether a variant was likely to be the only driver mutation in a clone (that is, a ‘single-mutant clone’) or whether it was more likely to be in a clone with one or more of the other variants detected in that individual (Supplementary Table 8). First, we looked at the largest cell fractions for each of the variants detected in an individual: using the pigeon-hole principle, if the sum of the cell fractions for two variants was more than 100% at any timepoint then these two variants were inferred to be in the same clone. Second, we looked at the cell fraction dynamics of the variant trajectories: if the cell fraction trajectories crossed over at any timepoint (that is, one variant’s cell fraction increased to above the cell fraction of another), then these two variants were inferred to be in separate clones. Third, we looked at the correlation in cell fraction dynamics between variants: if the trajectories of two variants showed similar growth dynamics (for example, increasing or decreasing in cell fraction at the same timepoints), then these variants were inferred to be in the same clone. Next, if a larger clone was already present when a new variant was acquired, we inferred that this new variant was more likely to have arisen within the existing larger clone if the larger clone’s cell fraction was more than 50% when the new variant was acquired. Finally, in particular when considering variants that were detected only at timepoints closest to time of AML diagnosis, but that were still present at low cell fraction, we looked at the growth rate of the variant and it’s timing relative to AML diagnosis: the higher the growth rate, and the closer to AML diagnosis the variant was first detected, the more likely we were to infer that the variant was associated with a multiple-mutant clone.
Evolution pattern classification
The evolution pattern for each pre-AML case and control was classified as ‘clonal interference’, ‘late evolution’ or ‘linear evolution’. ‘Clonal interference’ was defined as the presence of multiple driver clones on parallel evolutionary branches, with at least one of these clones expanding to a substantial proportion of the haematopoietic pool (operationally defined as more than 10% cell fraction), thereby influencing the trajectories of other co-existing clones. ‘Late evolution’ was defined as cases in which the putative pre-leukaemic clone was detectable only within 1–2 years before AML diagnosis (or, for controls, before the matched case’s age at AML diagnosis), or where no pathogenic driver mutations (covered by our panel) were detected at all. ‘Linear evolution’ encompassed cases not fitting the above two categories, typically showing sequential acquisition and expansion of driver mutations along a single dominant trunk, with minimal evidence of high-frequency side-branching or competition from parallel high-frequency lineages.
Inferring mutation acquisition age and fitness effect
We developed a mathematical framework for inferring the acquisition age and fitness effects of clones. In this framework each clone (defined by its most recently acquired mutation) has an ‘establishment time’ (\({t}_{0}\)) and fitness effect (s), which determine the clone’s size over time, such that at a particular time (\({t}_{1}\)), the clone size is given by the equation
The frequencies of all clones in the population (including non-mutated HSCs) sums to 1, such that at a particular time (\({t}_{1}\)), the clone frequency is given by the equation
The dynamics of a specific variant, directly measured via the variant’s VAF, are determined by summing the frequency of the original parental clone (that is, the first clone to acquire the variant) and all daughter clones that inherited the variant. Using this framework, together with inferences for the clonal architecture of each sample (as described above), we developed a maximum likelihood approach to infer fitness and establishment time estimates for each clone in the population by comparing the predicted VAF trajectories with the observed VAF trajectories in all pre-AML cases and controls. To assign a likelihood to the observed data, given the predicted trajectories, we developed a likelihood function as follows: for each variant at each timepoint, we assigned a likelihood to the observed number of variant reads using a binomial probability with mean given by the predicted frequency and sample size given by the total depth at that position in the sample. The log(likelihoods) were summed across all the variant timepoints for all trajectories and our maximum likelihood approach minimized the sum of all the total log(likelihoods).
Our maximum likelihood optimization approach started with an ‘initial estimate’ for the establishment time and fitness of each clone. Depending on the number of VAF timepoints, this was typically estimated from the gradient of a straight line drawn through the log(VAF) trajectory (with or without ‘bounded VAFs’ for undetectable VAF timepoints) or was on the basis of the number of mutations in the clone (Supplementary Note 4). Once the ‘initial estimate’ for the establishment time and fitness of each clone had been set, a three-stage maximum likelihood process was applied. Within each stage, approximately 1,000–5,000 optimizations were performed, with adjustment of the establishment time and fitness with each optimization to find the lowest total log(likelihood) across all trajectories in that sample. Each of the three stages involved progressively finer adjustments in the predicted establishment time and fitness of the clone with each optimization (similar to simulated annealing). Penalties were applied to the log(likelihoods) in certain situations, for example, to account for timepoints at which a variant was undetectable (Supplementary Note 4). For each sample, the three-stage maximum likelihood process was repeated for 25 ‘seeds’ and the results of the seed that produced the lowest total log(likelihood) were taken as the most likely establishment times and fitnesses for the variants in that sample.
To quantify the uncertainty around our fitness and establishment time estimates, we considered all ‘seeds’ whose likelihood scores were within ±20% of the best (lowest) log(likelihood). From these, we calculated two measures of uncertainty: (1) the 95% range of the parameter estimates across these seeds (‘95% optimizer range’), defined as the central interval containing 95% of the values, and (2) the standard deviation of these parameter values (Supplementary Note 4, Supplementary Fig. 46 and Supplementary Table 9).
A simulated model of evolutionary dynamics in blood
In this model, blood is maintained by a population of N cycling HSCs that divide symmetrically every \(\tau \) years, modelled as a continuous-time, birth-death process39. Asymmetric divisions can occur in this framework, but they do not affect clone sizes and therefore are not explicitly modelled. HSCs acquire driver mutations at a rate U per year. Driver mutations vary in the fitness effects they confer to HSCs. The fitness effects are drawn from a probability density distribution that is modelled using a stretched exponential as described previously40:
where \({\mathscr{N}}\) is a normalization constant and k is the number of driver mutations in the clone, and where we have set p = 3, r = 2.5. A driver mutation arising in a wild-type HSC, creating a single-mutant clone, confers fitness advantages drawn from a distribution with a median and range controlled by a single parameter \({s}_{0}\) = 16% per year. A driver mutation arising in a single-mutant clone confers a median fitness effect that is r = 2.5-fold larger (typical fitness effects s = 40% per year), creating a double-mutant clone. Triple- and quadruple-mutant clones follow the same geometric pattern (with median fitness effects of s ≈ 100% and s ≈ 250% per year, respectively). Fitness advantages of driver mutations combine additively in this model, such that the growth rate of a clone carrying k driver mutations is given by
where \(\bar{x}\) is the mean fitness of all clones in the population weighted by their clone size and where \({s}_{i}\) represents the fitness advantages of each of the driver mutations in the clone. Transformation to frank AML is defined by the acquisition of four driver mutations within the same clone that reaches more than 50% cell fraction before the age of 85. Using established estimates of \(N\tau \) = 105, U ≈ 10−5 per year and s ≈ 16% per year for single-mutant fitness effects, we simulated clonal dynamics in 200,200 simulations and considered the evolutionary dynamics observed in the decades preceding the 943 virtual incidental AMLs.
High VAF variants in the UK Biobank
Clonal haematopoiesis variants were called in UK Biobank participants with exome sequencing data. Individuals with a history of cancer before the UK Biobank baseline assessment (including self-reported cancer, excluding basal cell carcinoma, pre-cancer of the cervix and rodent ulcer) were excluded, leaving 424,089 individuals. Individuals who developed other haematological malignancies after baseline were also excluded (n = 4,035), leaving 420,054 individuals for analysis. The North West Multi-centre Research Ethics Committee reviewed and approved the UK Biobank scientific protocol and operational procedures (REC 21/NW/0157) and all participants provided signed, informed consent at enrolment. Variants were called at 27 genomic positions previously identified as the locations of clonal haematopoiesis driver variants39 from the UK Biobank exome CRAM files using samtools mpileup on the DNANexus Research Analysis Platform (UK Biobank Application Number 58387): DNMT3A R320, R326C/G/S, R598, R729G/W, Y735C/F, R736C/G/H/L/S, R771*, R882H/C/S/L/P, W860R, P904L/Q/R; GNB1 K57E; IDH1 R132H; IDH2 R140Q, R172K; JAK2 V617F; KIT D816F/H/V/Y; KRAS G12C/D/V; MPL W515L; NRAS G12C/D/V; SF3B1 K666N, K700E; SRSF2 P95H/L/R. Variants with less than three supporting reads were discarded. A total of 516 individuals were identified who were diagnosed with myeloid leukaemia (ICD-10 C92) after the UK Biobank baseline assessment (‘prospective cases’). In total, 5,034 individuals carried at least one of the clonal haematopoiesis variants analysed, of whom 114 represented prospective cases. A total of 106 individuals carried two clonal haematopoiesis driver variants, of whom 23 represented prospective cases. Somatic sweeps were defined as at least one variant at VAF > 30%; 388 individuals had a somatic sweep, of whom 42 represented prospective cases. Associations with prospective myeloid leukaemia were assessed using a two-sided Fisher’s exact test against all other participants.
Statistics and reproducibility
No statistical methods were used to predetermine sample size: all individuals in the ‘multimodal arm’ of UKCTOCS who had been diagnosed with AML by 2017, and who had sufficient serum sample available from at least two timepoints before AML diagnosis, were included.
Reporting summary
Further information on research design is available in the Nature Portfolio Reporting Summary linked to this article.