 Newshot
Main
Functional cellular heterogeneity is well documented in hepatocytes, driven by liver zonation7, and in muscle fibres, shaped by local environmental cues, particularly motor neuron activity8. Single-cell technologies have revealed extensive new patterns of heterogeneity of specific cell types within the same tissue9, yet their biological importance remains largely undetermined.
Thermogenic adipose tissue undergoes adaptive thermogenesis and is crucial for energy expenditure and thermoregulation1,2. Its specialized metabolism and precise responses to environmental and physiological stimuli make it an ideal model for studying functional cellular heterogeneity. Thermogenic capacity declines substantially with age in rodents and humans, leading to age-related cold sensitivity and metabolic disorders3,4,5, yet the underlying mechanisms remain unclear.
BAs and beige adipocytes mediate UCP1-dependent non-shivering thermogenesis10. Although substantial progress has been made in identifying the key pathways that activate thermogenesis, most studies have been conducted at the whole-tissue level, leaving the mechanisms governing its activation, maintenance and deactivation incompletely understood.
The heterogeneity of BAs within the same brown adipose tissue (BAT) and beige adipocyte cluster within inguinal white adipose tissue (iWAT) has been characterized by our group6 and others5,11,12,13,14. We found that BAs heterogeneously express UCP1 and classified those with low expression as BA-L cells and those with high expression as BA-H cells6. At room temperature, BA-H cells constitute 30–50% of all BAs; BA-H cells predominate after cold exposure, whereas BA-L cells predominate under thermoneutral conditions6. This raises questions of why BA heterogeneity exists, and whether it reflects random variation along a thermogenic continuum or spatially organized, tightly regulated states within the tissue.
Here we identify dynamic bistable regulation of BA heterogeneity controlled by the spatial proximity of BAs to IL-1β puncta through a neuronal–immune regulatory mechanism. This regulation becomes dysfunctional during ageing, leading to cold intolerance in older adults. These findings highlight how different cell types collectively control cellular heterogeneity in a spatiotemporal manner, integrating environmental and internal cues to regulate tissue metabolism and function.
H6PD is a functional marker of BA-L
Reanalysis of our previous single-cell RNA-sequencing (scRNA-seq) dataset6 revealed enrichment of glucocorticoid signalling and GR-target genes in BA-L cells (Extended Data Fig. 1a–c). Top BA-L-cell-enriched genes include H6pd, Rgs2 and thioredoxin-interacting protein (Txnip), whereas BA-H cells were enriched for thermogenesis-related genes, including Ucp1 and cytochrome c oxidase 6B1 (Cox6b1) (Extended Data Fig. 1a,b,d–f). Nr3c1 was similarly expressed in BA-H and BA-L cells (Extended Data Fig. 1e,f).
We generated Ucp1-Chaser-mT/mG mice for inducible labelling of Ucp1+ cells by crossing the Ucp1-rtTA, TRE-cre and Rosa-stop-mT/mG mouse lines (Extended Data Fig. 2a). After 1 week of feeding on a doxycycline diet at room temperature (24 °C), GFP+ and GFP− BAs showed a patchy distribution (Fig. 1a), consistent with BA heterogeneity in AdipoChaser mice6. The Ucp1-rtTA mice used a relatively weak 5 kb Ucp1 promoter15 so GFP is only expressed in UCP1high-expressing BAs (BA-H cells), while Ucp1-cre mice have a strong bacterial artificial chromosome-based Ucp1 promoter that drives Cre expression in all BAs16. Immunofluorescence (IF) staining confirmed selective H6PD expression in BA-L cells (Fig. 1a); 50% of BAs were UCP1+(GFP+)H6PD−, 45% were UCP1−(GFP−)H6PD+ and 5% were UCP1+(GFP+)H6PD+ (Fig. 1b). Similar heterogeneity was observed in iWAT after 1 week of cold exposure (6 °C) (Fig. 1c), with 45% of these beige adipocytes being UCP1+H6PD−, 49% UCP1−H6PD+ and 6% UCP1+H6PD+ (Fig. 1d). Human BAT showed a similar reciprocal UCP1 and H6PD pattern in multilocular brown–beige adipocytes (Fig. 1e), 45% of BAs were UCP1+H6PD−, 47% were UCP1−H6PD+ and 8% were UCP1+H6PD+ (Fig. 1f). Western blotting confirmed more than twofold higher H6PD in BA-L cells than in BA-H cells and more than fourfold higher UCP1 in BA-H cells than in BA-L cells, while H6PD was enriched in mature BAs relative to in the stromal vascular fractions (SVFs) (Extended Data Fig. 2b,c). Together, these data identify H6PD as a BA-L marker.
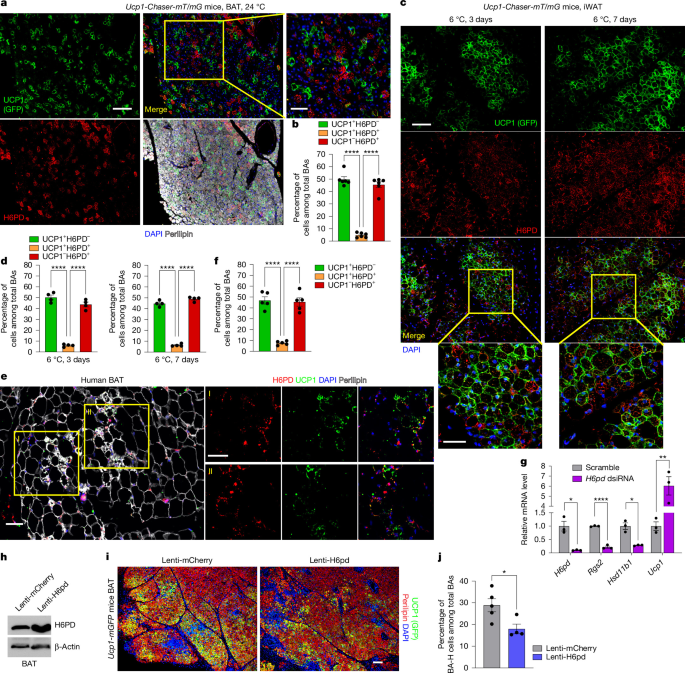
a,b, Male Ucp1-Chaser-mT/mG mice (aged 10 weeks) were fed a doxycycline chow diet for 1 week at 24 °C. Representative images of BAT IF staining for GFP (green), H6PD (red), perilipin (white) and DAPI (blue) (a), and quantification of the relative percentage of BAs positive for GFP+(UCP1+) only, H6PD+ only or both (b). n = 6 per group. c,d, Male Ucp1-Chaser-mT/mG mice aged 10 weeks were fed a doxycycline chow diet for 3 days or 1 week at 6 °C. c, Representative images of IF staining for GFP (green), H6PD (red) and DAPI (blue) in iWAT. d, Quantification of the relative percentage of BAs positive for GFP+(UCP1+) only, H6PD+ only or both. n = 4 per group. e, Representative IF staining for UCP1 (green), H6PD (red), perilipin (white) and DAPI (blue) in human supraclavicular BAT. f, Quantification of the relative percentage of BAs that are positive for UCP1+ only, H6PD+ only or both. n = 5 per group. g, BAs differentiated from primary BAT SVFs from WT mice were reverse-transfected with H6pd Dicer-substrate small interfering RNAs (dsiRNAs) or control dsiRNAs and collected after 2 days. RT–qPCR analysis of H6pd, Rgs2, Hsd11b1 and Ucp1 mRNA levels. n = 3 per group. h–j, 10-week-old male Ucp1-mGFP mice were injected with lentivirus overexpressing H6PD or mCherry as a control into BAT. h, After 2 weeks, H6PD and β-actin protein levels were analysed using western blotting (WB). i, Representative IF staining of BAT for GFP (green), perilipin (red) and DAPI (blue). j, Quantification of the BA-H cell percentage. For j, n = 5 (mCherry) and n = 4 (H6PD). Statistics were computed using one-way analysis of variance (ANOVA) with Tukey’s multiple-comparison test (b, d and f), unpaired two-tailed Welch’s t-tests (g (H6pd and Hsd11b1)) or unpaired two-tailed Student’s t-tests (g (Rgs2 and Ucp1) and j); P < 0.05, P < 0.01, *P < 0.0001. For b, d, f, g and j, data are mean ± s.e.m. Scale bars, 25 μm (a (right), c (bottom)), 50 μm (a (left), c (top) and e) and 100 μm (i).
To enable real-time labelling of BA-H cells, we generated Ucp1-mGFP knock-in mice by inserting a P2A-mGFP cassette after Ucp1 exon 6, immediately upstream of the stop codon (Extended Data Fig. 2d). These mice displayed robust BAT GFP fluorescence without altered UCP1 expression (Extended Data Fig. 2e,f). GFP IF staining revealed a heterogeneous distribution of GFP+ and GFP− BAs (Extended Data Fig. 2g). In vitro-cultured BAs and beige adipocytes showed selective H6PD expression in GFP− BA-L cells (Extended Data Fig. 2h), validating our in vivo findings.
We next investigated UCP1-independent thermogenesis through the futile creatine cycle17,18,19,20,21. Tissue-non-specific alkaline phosphatase (TNAP) and creatine kinase B (CKB) protein levels increased 4.8-fold and 2.5-fold, respectively, in BAT during cold exposure and were enriched 2.9-fold and 2.0-fold in BA-L cells versus in BA-H cells (Extended Data Fig. 3a,b), consistent with higher Ckb mRNA in BA-L cells6. IF staining further showed TNAP enrichment in BA-L cells (H6PDhigh BAs) in BAT and H6PDhigh beige adipocytes in cold-exposed iWAT (Extended Data Fig. 3c,d). In vitro-differentiated BAs also displayed selective TNAP expression in BA-L cells (GFP− BAs) (Extended Data Fig. 3e), indicating that the futile creatine cycle is more active in BA-L cells.
Regarding the metabolic differences between BA-L cells and BA-H cells, BA-L cells have half the basal respiration, but similar maximal respiration compared to BA-H cells, indicating similarly high mitochondrial potential6. Using in vivo [U-13C]glucose tracing22, we recently showed that BAT has the most active glucose oxidation among metabolically active tissues, while in vitro tracing confirmed active glucose oxidation in differentiated BAs23. To characterize BA-L metabolism, we performed [U-13C] glucose and [U-13C] palmitate tracing in freshly isolated BA-H cells and BA-L cells, followed by gas chromatography–mass spectrometry (GC–MS) analysis (Extended Data Fig. 4a). Fully labelled (m+16) free palmitate (C16:0) was about twofold higher in BA-L cells, indicating greater fatty acid uptake (Extended Data Fig. 4b), while fully labelled total palmitate was sixfold higher, suggesting preferential fatty acids storage in BA-L cells (Extended Data Fig. 4c). BA-L cells also showed lower citrate enrichment from both tracers, indicating lower glucose and fatty acid oxidation (Extended Data Fig. 4d). Thus, BA-L cells exhibit greater fatty acid uptake and accumulation but lower fatty acid and glucose oxidation, consistent with their lower basal respiration6.
We next examined whether H6PD is a functional marker of BA-L cells. H6PD depletion in BAs differentiated from BAT SVFs of Ucp1-mGFP mice increased Ucp1 expression sixfold (Fig. 1g), indicating that H6PD negatively regulates Ucp1. Conversely, H6pd overexpression by lentiviral injection into BAT of Ucp1-mGFP mice (Fig. 1h and Extended Data Fig. 4e,f) significantly reduced the proportion of BA-H cells (Fig. 1i,j). Thus, H6PD is a functional marker of BA-L that regulates UCP1 expression and BA heterogeneity.
GR stabilizes low-thermogenic BA-L cells
H6PD localizes to the endoplasmic reticulum lumen and generates endoplasmic reticulum-resident NADPH, distinct from cytosolic glucose-6-phosphate dehydrogenase (G6PD)24. H6PD primarily determines the reductase activity of endoplasmic reticulum-localized 11β-hydroxysteroid dehydrogenase (HSD11B1), which converts inactive cortisone to active cortisol25. GR protein levels were similar between BA-H cells and BA-L cells, indicating that GR signalling is not regulated by receptor abundance (Extended Data Fig. 3b). We next investigated whether GR signalling regulates UCP1 expression. Simultaneous treatment of BAs differentiated from the SVFs of wild-type (WT) mice with 11-dehydrocorticosterone (11-DHC), a natural substrate for active glucocorticoid biosynthesis25, and noradrenaline (NA) substantially increased UCP1 protein (Fig. 2a). However, 24 h 11-DHC pretreatment blunted NA-induced UCP1 expression (Fig. 2b). Thus, prolonged activation of GR signalling suppresses BA responsiveness to NA, maintaining BA-L cells in a stable, low-thermogenic status.
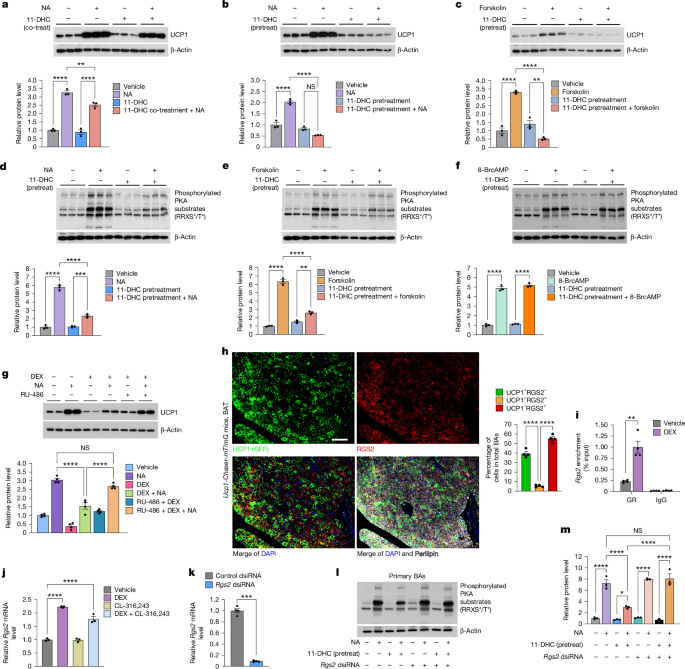
a–c, BAs differentiated from primary BAT SVFs of WT mice were treated with NA ± 11-DHC for 24 h (a) or pretreated with vehicle or 11-DHC for 24 h, followed by NA (b) or forskolin (c) treatment for 24 h. UCP1 and β-actin immunoblots and quantification. n = 3 independent cultures. Co-treat, co-treatment; pretreat, pretreatment. d–f, BAs were pretreated with vehicle or 11-DHC for 48 h, followed by NA (d), forskolin (e) or 8-BrcAMP (f) treatment for 30 min. Immunoblots and quantification of phosphorylated PKA substrates and β-actin are shown. n = 3 independent cultures. g, BAs were pretreated with vehicle or RU-486 for 1 h, followed by NA with or without DEX treatment for 24 h. Immunoblots and quantification of UCP1 and β-actin are shown. n = 4 independent cultures. h, Male Ucp1-Chaser-mT/mG mice (aged 10 weeks) were on a doxycycline chow diet for 1 week at 24 °C. BAT IF staining for GFP (green), RGS2 (red), perilipin (white) and DAPI (blue), and quantification of single- or double-positive BAs are shown. n = 4 per group. i, BAs were treated with vehicle or DEX for 2 h and subjected to ChIP using anti-GR antibody or control IgG. ChIP–qPCR analysis of Rgs2 promoter (−92 bp to +53 bp), presented as the percentage of input DNA. n = 4 per group. j, RT–qPCR analysis of Rgs2 in three-dimensionally cultured primary BAs, treated with vehicle, DEX, CL-316,243 or DEX + CL-316,243 for 24 h. n = 3 per group. k–m, BAs were reverse-transfected with Rgs2 or control dsiRNAs. k, Rgs2 mRNA was analysed 2 days after. Cells were then pretreated with 11-DHC for 24 h and stimulated with NA for 30 min. l,m, Immunoblots (l) and quantification (m) of phosphorylated PKA substrates and β-actin. n = 3 per group (k) and n = 4 per group (m). Statistical analysis was performed using one-way ANOVA with Tukey’s multiple-comparison test (a–h, j and m), unpaired two-tailed Welch’s t-tests (i (GR) and k) and unpaired two-tailed Student’s t-tests (i (IgG)); ***P < 0.001. NS, not significant. For a–g, i–k and m, data are mean ± s.e.m. Scale bar, 50 μm (h).
Forskolin activates adenylyl cyclase (AC) to generate cAMP26. 11-DHC pretreatment also blocked forskolin-induced UCP1 expression (Fig. 2c), suggesting inhibition of AC activity or downstream cAMP signalling. To determine where GR signalling acts within the canonical β-adrenergic receptor–cAMP–PKA pathway that controls UCP1 expression27, we measured PKA activity in in vitro-differentiated BAs after 24 h of 11-DHC pretreatment, followed by NA, forskolin or 8-BrcAMP (a cAMP derivative). 11-DHC pretreatment markedly reduced NA- or forskolin-induced PKA activity (Fig. 2d,e), but not the response to 8-BrcAMP (Fig. 2f), indicating that downstream cAMP signalling is not affected by GR activation. Thus, GR signalling potentially suppresses UCP1 expression by inhibiting AC-mediated cAMP production.
Whereas 11-DHC requires conversion to active glucocorticoids, dexamethasone (DEX) directly activates GR. In contrast to the delayed effect of 11-DHC, DEX suppressed NA-induced UCP1 expression after co-treatment (Fig. 2g), an effect that was abrogated by the GR antagonist mifepristone (RU-486) (Fig. 2g). Similarly, in the in vitro-differentiated BAs, CL-316,243 increased Ucp1 expression about 3-fold, whereas DEX pretreatment reduced this induction to about 1.6-fold (Extended Data Fig. 5a). Together, these data support the conclusion that GR activation maintains BA-L cells in a low-UCP1-expressing state by suppressing cAMP production.
GR–RGS2–AC signalling maintains BA-L cells
We next investigated how GR signalling regulates BA heterogeneity. DEX is commonly used in adipogenic differentiation cocktails; its withdrawal increased the BA-H/BA-L ratio by 2.8-fold in BAs differentiated from BAT SVF of Ucp1-mGFP mice (Extended Data Fig. 5b,c). Conversely, 11-DHC and the active glucocorticoid corticosterone decreased the BA-H/BA-L ratio compared with in the DEX-free control, independent of differentiation efficiency (Extended Data Fig. 5b–d). In WT mice, DEX induced BAT whitening and reduced the BA-H/BA-L ratio by 74% (Extended Data Fig. 5e,f). Thus, manipulating GR signalling alters BA heterogeneity both in vitro and in vivo.
To determine how GR signalling inhibits cAMP production, we examined other BA-L-enriched genes. Rgs2 was highly expressed in BA-L cells (Extended Data Fig. 1a,b,e,f). RGS2 binds to the C1 domain of AC III, V and VI, attenuating Gαs-dependent cAMP accumulation28. IF staining confirmed selective RGS2 expression in BA-L cells, with 40% of BAs being UCP1+(GFP+)RGS2−, 55% UCP1−(GFP−)RGS2+ and 5% UCP1+(GFP+)RGS2+ (Fig. 2h). RGS2 was also selectively expressed in GFP− BA-L cells in in vitro-differentiated BAs (brown and beige) (Extended Data Fig. 5g,h). Analysis of published GR chromatin immunoprecipitation (ChIP) followed by sequencing datasets29 identified GR occupancy within the promoter and intronic regions of Rgs2 (Extended Data Fig. 5i). ChIP–quantitative PCR (qPCR) in in vitro-differentiated BAs confirmed GR binding at the Rgs2 promoter, which was enhanced by DEX (Fig. 2i). Lastly, DEX increased Rgs2 mRNA 2.2-fold in freshly isolated BAs (Fig. 2j), supporting Rgs2 as a GR target. Thus, RGS2 is a GR target in the BAs that inhibits cAMP production. Knocking down Rgs2 in in vitro-differentiated BAs (Fig. 2k) did not affect PKA activity in response to NA alone (Extended Data Fig. 5j,k). However, Rgs2 knockdown abrogated the inhibitory effect of 11-DHC pretreatment on NA-induced PKA substrate phosphorylation (Fig. 2l,m). Rgs2 is therefore a GR target in BAs that suppresses Ucp1 expression by inhibiting AC activity, and BA-L cells are stabilized in the low-thermogenic state through the GR–RGS2–AC signalling axis.
Sympathetic regulation of H6PD in BAs
H6PD protein levels in BAT changed inversely with UCP1 across environmental temperatures, while GR protein was only slightly elevated at thermoneutrality (30 °C) (Extended Data Fig. 6a). Cold exposure reduced H6PD protein by 1.8-fold in iWAT, but not in gonadal white adipose tissue (gWAT) (Extended Data Fig. 6b,c), suggesting thermogenic-depot-specific regulation. CL-316,243 similarly decreased H6PD and increased UCP1 protein levels in BAT (Extended Data Fig. 6d). H6pd mRNA decreased rather than increased with rising temperature in BAT (Extended Data Fig. 6e), indicating post-transcriptional regulation. Thus, H6PD protein levels, but not mRNA levels, change dynamically in BAT in response to fluctuating environmental temperatures, which may be essential for altering the BA-H/BA-L ratio in response to thermogenic demand.
Sympathetic neurons secrete NA to activate BA thermogenesis. We next tested whether sympathetic innervation mediates cold-induced H6PD protein reduction using unilateral BAT denervation, validated by reduced tyrosine hydroxylase (TH) protein (Fig. 3a). Cold exposure increased BA-H cells from 31.1% to 85.6% (Fig. 3b), as previously reported6. Denervation prevented the cold-induced reduction of H6PD (Fig. 3a), and although there was an increase in the BA-H/BA-L ratio, the proportion of BA-H cells was 66% lower than the sham group during cold exposure (29.1% versus 85.6%) (Fig. 3b). The low BA-H/BA-L ratio was accompanied by BA whitening (Extended Data Fig. 6f), a feature associated with impaired thermogenesis30. Notably, H6PD consistently labelled BA-L cells regardless of the variable BA-H/BA-L ratio at different environmental temperatures (Fig. 3b). Thus, sympathetic innervation is required to reduce H6PD protein and raise the BA-H/BA-L ratio after cold exposure.
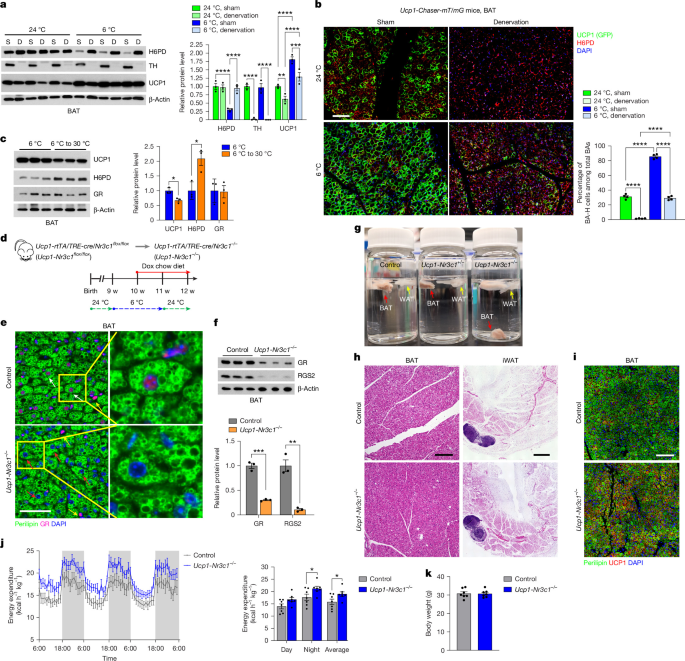
a,b, Male WT (a) or Ucp1-Chaser-mT/mG (b) mice (aged 8 weeks) underwent sham (S) or unilateral BAT denervation (D). After 2 weeks of recovery, the mice were housed at 24 °C or 6 °C for 1 week (Ucp1-Chaser-mT/mG mice received a doxycycline diet). a, Immunoblots and quantification of H6PD, TH, UCP1 and β-actin in BAT. b, BAT IF staining for GFP (green), H6PD (red) and DAPI (blue), and BA-H quantification. n = 3 per group (a) and n = 4 per group (b). c, Male WT mice (aged 10 weeks) were housed at 6 °C for 1 week, with or without subsequent housing at 30 °C for 1 week. Immunoblots and quantification of UCP1, H6PD, GR and β-actin are shown. n = 3 per group. d–k, After doxycycline (dox) diet feeding, Ucp1-Nr3c1flox/flox (Ucp1-rtTA;TRE-cre;Nr3c1flox/flox) mice become Ucp1-Nr3c1−/− (Ucp1-rtTA;TRE-cre;Nr3c1−/−), with Nr3c1 deleted in BA-H cells. TRE-Cre-negative littermates were used as controls. d, Male mice (aged 9 weeks (w)) were housed at 6 °C for 1 week, then fed a doxycycline diet at 6 °C for 1 week and then returned to 24 °C with continued feeding on a doxycycline diet. e, BAT IF staining for perilipin (green), GR (red) and DAPI (blue). The white, red and yellow arrows indicate representative GR+ BAs, GR− BAs and non-adipocytes, respectively. f, GR, RGS2 and β-actin immunoblots and quantification. g, BAT and WATs (iWAT and gWAT) in PBS buffer. Ucp1-Nr3c1−/− BAT exhibits a higher density and sinks. h, Haematoxylin and eosin (H&E) staining of BAT and iWAT. i, BAT IF staining for perilipin (green), UCP1 (red) and DAPI (blue). j,k, Energy expenditure (j) and body weight (k). n = 3 per group (f) and n = 7 per group (j and k). Statistics were computed using two-way ANOVA with Tukey’s multiple-comparison test (a and b), unpaired two-tailed Student’s t-tests (c, f, j (average) and k) and two-way ANOVA with Šídák’s multiple-comparison test (j (time-course curves and day–night)). For a–c, f, j and k, data are mean ± s.e.m. Scale bars, 50 μm (b, e, h (left) and i) and 1.2 mm (h (right)).
Cold exposure also downregulated GR target genes, including Rasd1, Fkbp5, Pik3r1, Tsc22d3 and Rgs2 in BAT, whereas denervation blunted these effects (Extended Data Fig. 6g), supporting the involvement of GR signalling in raising the BA-H/BA-L ratio. We next tested whether the opposite occurred when shifting mice from cold to thermoneutrality. H6PD protein increased 2.1-fold in BAT, while GR protein remained unchanged (Fig. 3c). Transitioning cold-exposed mice to 30 °C also restored GR target gene expression in BAT (Extended Data Fig. 6h), indicating that H6PD and GR signalling dynamically respond to temperature fluctuations to regulate BA heterogeneity.
GR inhibition locks BAs in BA-H states
We next tested whether blocking GR during the transition from cold to warmer temperatures prevents BA-H cells from switching to BA-L cells. We generated a BA-H-specific, inducible Nr3c1-knockout model by crossing Ucp1-rtTA, TRE-cre and Nr3c1flox/flox mice (Fig. 3d). Mice were first exposed to 6 °C for 1 week to raise the BA-H/BA-L ratio, followed by 1 week of doxycycline diet under cold conditions to induce Nr3c1 deletion in BA-H cells (Ucp1-Nr3c1flox/flox turning into Ucp1-Nr3c1−/−), and were then returned to room temperature with the doxycycline diet for another week. One week is long enough for the mice to reduce thermogenesis according to the rise in environmental temperature. IF staining confirmed Nr3c1 deletion in most BAs (Fig. 3e), consistent with 86% of BAs being BA-H cells during cold exposure (Fig. 3b), and western blotting showed reduced GR and RGS2 in isolated BAs (Fig. 3f). We previously showed that BA-H cells contain smaller lipid droplets and therefore have higher density, whereas BA-L cells have larger lipid droplets, lower density and float after mild centrifugation (like white adipocytes)6. Notably, BAT from Ucp1-Nr3c1−/− mice sank in PBS, whereas control BAT floated (Fig. 3g), suggesting a higher density and a higher BA-H/BA-L ratio. Consistently, Ucp1-Nr3c1−/− mice showed browner BAT with smaller lipid droplets, increased iWAT beiging (Fig. 3h) and a higher proportion of BA-H cells (Fig. 3i). Metabolic cage studies further showed increased energy expenditure and oxygen consumption in Ucp1-Nr3c1−/− mice, without changes in body weight (Fig. 3j,k and Extended Data Fig. 6i), body composition, food intake, respiratory exchange ratio or locomotor activity (Extended Data Fig. 6j–n). As the controls were metabolically healthy young adults, Ucp1-Nr3c1−/− mice showed no further improvements in glucose tolerance or insulin sensitivity (Extended Data Fig. 6o,p). These data highlight stage- and cell-subtype-specific requirements for GR signalling to regulate bistable BA states and thermogenesis. Inhibition of GR reactivation during the transition from cold to room temperature preserved a high BA-H/BA-L ratio and persistent thermogenesis despite reduced environmental thermogenic demand. These data not only confirm that we can block the BA-H-to-BA-L switch by inhibiting GR signalling, but also indicate that manipulating BA heterogeneity can increase thermogenesis and significantly boost whole-body energy expenditure.
IL-1β stabilizes nearby BAs at BA-L state
To elucidate the sympathetic regulation of H6PD protein, we treated in vitro-differentiated BAs with NA but observed no change in H6PD protein (Fig. 4a), suggesting that other cell types and factors are involved in sympathetic regulation of H6PD. We next assessed cytokine expression in BAT and found that Il1b exhibited the greatest reduction (by 53%) after cold exposure (Fig. 4b and Extended Data Fig. 7a), and the greatest induction (by 3.3-fold) when mice were shifted from cold to thermoneutrality (Fig. 4c and Extended Data Fig. 7b). Cold-induced Il1b suppression was blunted by BAT sympathetic denervation (Fig. 4b), while NA reduced Il1b expression in BAT explants (Extended Data Fig. 7c). Il1b was predominantly expressed in SVFs rather than in mature adipocytes (Fig. 4d) and its expression changed with environmental temperature (Fig. 4d). qPCR with reverse transcription (RT–qPCR) analysis further confirmed the predominant expression of Il1b in CD45+ SVFs (Fig. 4e), indicating an immune cell source. By contrast, systemic IL-1β levels remained unchanged across environmental temperatures, suggesting local regulation of IL-1β levels in BAT (Extended Data Fig. 7d).
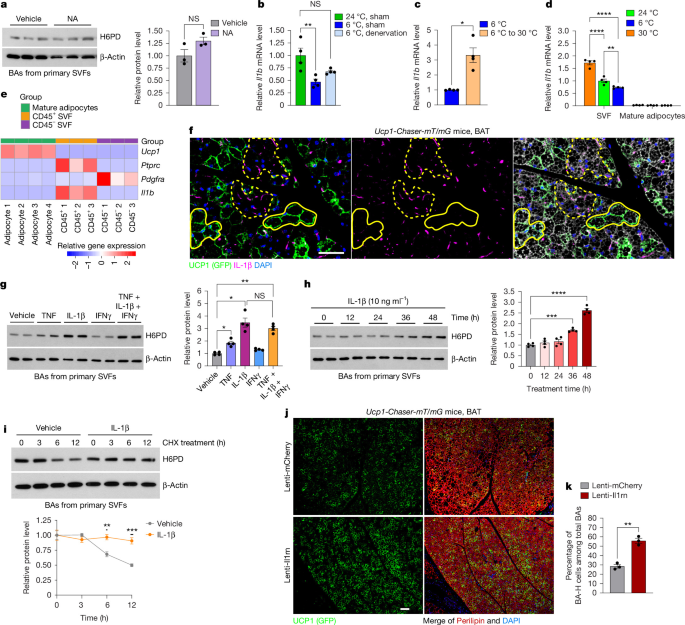
a, BAs differentiated from primary BAT SVFs were treated with NA for 24 h. Immunoblots and quantification of H6PD and β-actin are shown. n = 3 independent cultures. b,c, Male WT mice (aged 8 weeks) underwent sham or unilateral BAT denervation, recovered for 2 weeks and were then housed at 24 °C or 6 °C for 1 week (b) or were housed at 6 °C for 1 week, with or without subsequent housing at 30 °C for 1 week (c). BAT Il1b was analysed using RT–qPCR. n = 4 per group. d, Il1b RT–qPCR in BAT SVFs and mature adipocytes (10-week-old male mice). n = 4 per group. e, Ucp1, Ptprc, Pdgfra and Il1b mRNA in BAT mature adipocytes, and CD45+ and CD45− SVFs. n = 4, 3 and 3, respectively. f, Male Ucp1-Chaser-mT/mG mice (aged 10 weeks) received a doxycycline diet at 24 °C for 1 week. BAT IF staining for GFP (green), IL-1β (purple) and DAPI (blue). The dashed and solid yellow lines circle representative BA-L (GFP−) and BA-H (GFP+) cell clusters, respectively. g–i, BAs were treated with TNF, IL-1β, IFNγ or their combination for 48 h (g); IL-1β for 0–48 h (h); or were pretreated with IL-1β or vehicle for 4 h followed by CHX for 0–12 h (i). H6PD and β-actin immunoblots and quantification. n = 4 per group (g and h) and n = 3 per group (i). j,k, Male Ucp1-Chaser-mT/mG mice (aged 10 weeks) received intra-BAT lentivirus overexpressing IL-1RA or mCherry, followed by 2 weeks of recovery and 1 week of doxycycline diet. BAT IF staining for GFP (green), perilipin (red) and DAPI (blue) (j) and BA-H quantification (k). n = 3 per group. Statistical analysis was performed using unpaired two-tailed Student’s t-tests (a and k), one-way ANOVA with Tukey’s multiple-comparison test (b and h), unpaired two-tailed Welch’s t-test (c), two-way ANOVA with Šídák’s multiple-comparison test (d and i) and one-way ANOVA with Dunnett’s T3 multiple-comparison test (g). For a–d, g–i and k, data are mean ± s.e.m. Scale bars, 50 μm (f) and 100 μm (j).
Notably, IF staining revealed that BA-L cells clustered around IL-1β puncta, whereas BA-H cells formed clusters further away (Fig. 4f and Extended Data Fig. 7e), a pattern that was observed across room temperature, during cold exposure and after denervation (Extended Data Fig. 7e). Quantification indicated that IL-1β puncta and GFP+ cells (BA-H cells) show a significant negative Pearson correlation coefficient (PCC = −0.5 ± 0.1), suggesting a mutually exclusive pattern between these two factors at room temperature (Extended Data Fig. 7f). During cold exposure, this pattern persisted but was weaker (PCC = −0.2 ± 0.1), as fewer IL-1β puncta were available for quantification (Extended Data Fig. 7f). BAT denervation prevented the reduction in IL-1β puncta, maintained a low BA-H/BA-L ratio and preserved a strong negative correlation with GFP+ cells (BA-H cells) (PCC = −0.45 ± 0.1). Thus, across all three conditions, BA-L cells were consistently close to IL-1β puncta, indicating a strong correlation between IL-1β and BA heterogeneity.
We next tested whether IL-1β regulates H6PD protein levels in BAs. Among the proinflammatory cytokines tested, TNF and IL-1β increased H6PD protein levels by 1.8- and 3.5-fold, respectively (Fig. 4g), without increasing H6pd mRNA (Extended Data Fig. 7g), confirming a post-transcriptional regulation of H6PD. Combined IL-1β, TNF and IFNγ treatment did not further increase H6PD protein beyond the effect of IL-1β alone (Fig. 4g). IL-1β increased H6PD protein in a time-dependent manner (Fig. 4h). During cycloheximide (CHX) treatment, H6PD abundance decreased by 30% and 50% at 6 and 12 h, respectively, whereas IL-1β prevented this decline (Fig. 4i), indicating increased H6PD protein stability from degradation. IL-1β is known to activate multiple downstream pathways, including JNK, MEK–ERK, p38–MAPK and IKK–NF-κB. Among inhibitors targeting these pathways, only the MEK and ERK inhibitor U0126 attenuated IL-1β-induced H6PD upregulation (Extended Data Fig. 7h,i), indicating that MEK–ERK mediates IL-1β-induced H6PD stability.
We next examined whether IL-1β regulates UCP1 expression. IL-1β did not alter UCP1 expression in the in vitro-differentiated BAs in the absence of 11-DHC, but reduced UCP1 protein levels by 53% in the presence of 11-DHC (Extended Data Fig. 7j,k), indicating that IL-1β suppresses UCP1 through GR signalling.
Adipose-tissue-resident immune cells can regulate sympathetic innervation31,32,33. However, TH and synaptophysin staining showed similar sympathetic innervation of BA-H cells and BA-L cells (Extended Data Fig. 7l,m), indicating that IL-1β regulates BA heterogeneity independently of differential sympathetic innervation.
Neutrophils and macrophages secrete IL-1β
To identify the immune cells that secrete IL-1β in BAT, we integrated multiple published BAT scRNA-seq datasets14,34,35,36,37 (Extended Data Fig. 8a). β-Adrenergic receptors were expressed in CD45+ immune cells (Extended Data Fig. 8a,b), suggesting potential sympathetic regulation. Subclustering analysis revealed that Il1b was enriched in neutrophils (CD45+CD11b+F4/80−CXCR2+), monocytes (CD45+CD11b+F4/80−Ly6C+), and macrophages (CD45+CD11b+F4/80+) (Extended Data Fig. 8c–e). Flow cytometry confirmed that IL-1β was mainly produced by CD45+ immune cells (Extended Data Fig. 9a,b), with IL-1β+ cells predominantly comprising neutrophils and macrophages, but not monocytes (Extended Data Fig. 9c–e). IL-1β+ cells represented 10% of neutrophils and 1% of macrophages, indicating that IL-1β production is restricted to specific subsets (Extended Data Fig. 9d). Despite the low frequency, the greater abundance of macrophages resulted in substantial numbers of IL-1β+ macrophages, with IL-1β+ neutrophils only 1.7-fold more abundant (Extended Data Fig. 9e), indicating that both cell types are major IL-1β sources. IF staining further confirmed IL-1β colocalization with subsets of CXCR2+ neutrophils and F4/80+ macrophages in BAT (Extended Data Fig. 9f,g).
IL-1β directly controls BA heterogeneity
Depletion of CD45+ immune cells from BAT SVFs increased the BA-H/BA-L ratio by 2.7-fold without affecting overall differentiation efficiency (Extended Data Fig. 9h–j), supporting a role for immune cells in regulating BA heterogeneity. To further confirm the role of local IL-1β in thermogenic regulation, we injected lentivirus encoding Il1rn (encoding IL-1RA), a naturally occurring inhibitor of IL-1 receptor signalling, or an mCherry control directly into BAT (Extended Data Fig. 10a). IL-1RA increased the BA-H/BA-L ratio twofold in mice housed at room temperature (Fig. 4j,k). In in vitro-differentiated BAs, Il1r knockdown attenuated IL-1β-mediated suppression of UCP1 expression, indicating a direct effect of IL-1β on BAs (Extended Data Fig. 10b). Moreover, in vivo pharmacological inhibition of IL-1β production using the caspase-1 inhibitor VX-765 increased the BA-H/BA-L ratio by 2.2-fold (Extended Data Fig. 10c,d), further demonstrating a functional role for IL-1β in regulating BA heterogeneity.
NA directly controls immune cell IL-1β
We next investigated how temperature fluctuations regulate IL-1β in BAT. Il1b expression in primary BAT SVFs was temperature-dependent (Fig. 4d), whereas IL-1β+ immune cell numbers remained unchanged across housing temperatures (Extended Data Fig. 10e–h), indicating regulation independent of immune cell recruitment. NA directly suppressed Il1b expression in BAT-derived CD45+ immune cells (Extended Data Fig. 10i), suggesting adrenergic regulation of IL-1β production. Consistent with adrenergic receptor expression in CD45+ immune cells (Extended Data Fig. 8a,b), scRNA-seq analysis showed selective expression of Adrb1 and Adrb2, but not α-adrenergic receptor genes, in Il1b-expressing immune cell populations (Extended Data Fig. 11a). We further examined adrenergic regulation of Il1b using bone marrow-derived neutrophils. Lipopolysaccharide (LPS) induced Il1b expression dose dependently (Extended Data Fig. 11b), whereas NA pretreatment suppressed this induction in a dose- and time-dependent manner (Extended Data Fig. 11c,d). This effect was reversed by the non-selective β-adrenergic receptor antagonist propranolol, but not by the non-selective α-adrenergic receptor antagonist phenoxybenzamine (Extended Data Fig. 11e,f). Consistently, propranolol administration, but not phenoxybenzamine, increased Il1b expression in BAT in vivo (Extended Data Fig. 11g,h), supporting β-adrenergic suppression of IL-1β production.
Dysregulated BA heterogeneity in ageing
Decreased BA thermogenesis has been reported with obesity38 and ageing3. However, high fat diet- (HFD)-induced obese mice were completely cold-tolerant, with 100% survival after 7 days of cold exposure (Fig. 5a,b). HFD feeding decreased H6PD and increased UCP1 protein levels (Fig. 5c), indicating preserved BAT thermogenic potential. By contrast, aged mice exhibited cold intolerance, with reduced body temperature and a 25% mortality within the first 2 days (Fig. 5d,e), suggesting impaired thermogenesis. Aged mice showed a 2.3-fold increase in H6PD and a 40% decrease in UCP1 (Fig. 5f), suggesting a reduced BA-H/BA-L ratio. GR was modestly reduced by HFD feeding but unchanged with ageing. These differences suggest that cold-induced thermogenesis is more severely impaired with ageing than with obesity at a young age, and that the molecular and cellular mechanisms underlying impaired thermogenesis may differ substantially.
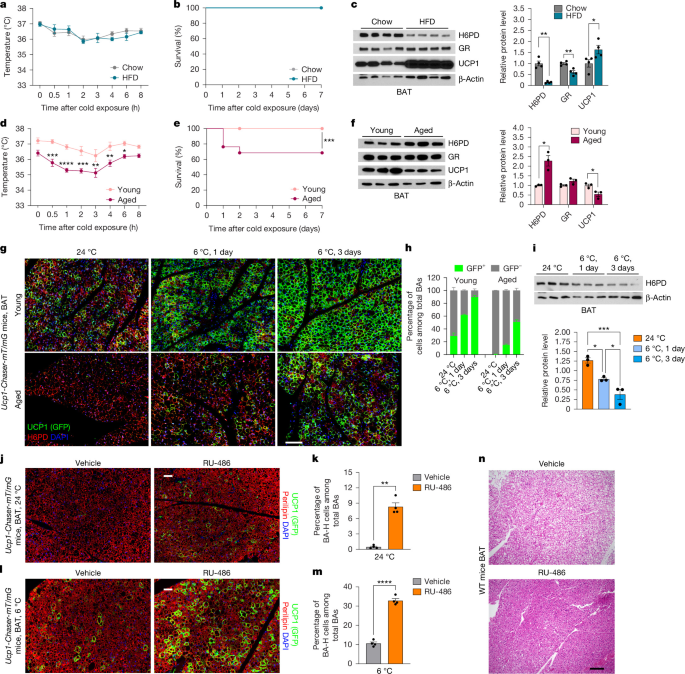
a–f, Male WT mice (aged 8 weeks) were fed chow or HFD for 10 weeks (a–c), or 10-week-old (young) and 75-week-old (aged) male mice (d–f) were exposed to 6 °C. Rectal temperatures (a,d), Kaplan–Meier survival curves (b,e), and H6PD, GR, UCP1 and β-actin immunoblots and quantification (c,f) are shown. n = 6 per group (a), n = 7 per group (b and d), n = 4 per group (c), n = 37 (young) and n = 38 (aged) (e) and n = 3 per group (f). g,h, Young (aged 8 weeks) and old (aged 74 weeks) male Ucp1-Chaser-mT/mG mice received a doxycycline diet for 1 week, then 6 °C for 1 and 3 days with continued doxycycline feeding. g, BAT IF staining for GFP (green), H6PD (red) and DAPI (blue). h, BA-H quantification. n = 3 per group. i, Male WT mice aged 10 weeks were housed at 24 °C or 6 °C for 1 or 3 days. H6PD and β-actin immunoblots and quantification. n = 3 per group. j–m, Male Ucp1-Chaser-mT/mG mice aged 72 weeks received vehicle or RU-486 (60 mg per kg per day, subcutaneous) with doxycycline diet for 1 week and were maintained at 24 °C (j,k) or exposed to 6 °C for 1 day (l,m). BAT IF staining for GFP (green), perilipin (red) and DAPI (blue) (j,l), and BA-H quantification (k,m). n = 4 per group. n, Male WT mice aged 75 weeks received vehicle or RU-486 (60 mg per kg per day, subcutaneous injection) for 1 week. H&E staining of BAT was performed. Statistics were computed using two-way ANOVA with Šídák’s multiple-comparison test (a and d), log-rank tests (b and e), unpaired two-tailed Welch’s t-tests (c (H6PD), f (H6PD) and k), unpaired two-tailed Student’s t-tests (c (GR and UCP1), f (GR and UCP1) and m), one-way ANOVA with Tukey’s multiple-comparison test (i) and two-way ANOVA with Tukey’s multiple-comparison test (h). For a, c, d, f, i, k and m, data are mean ± s.e.m. Scale bars, 50 μm (j and l) and 100 μm (g and n).
In young Ucp1-Chaser-mT/mG mice, BA-H cells increased from 28.8% at 24 °C to 61.7% and 89.7% after 1 and 3 days of cold exposure, respectively. In aged mice, the baseline BA-H/BA-L ratio at 24 °C was extremely low (0.31%), and BA-H cells increased to 15% and 50.9% after 1 and 3 days of cold exposure, respectively (Fig. 5g,h), suggesting delayed BA bistable regulation in response to cold stimulation. H6PD progressively decreased during cold exposure in both young and aged mice (Fig. 5i and Extended Data Fig. 11i), but its level at cold exposure in aged mice was comparable to that in young mice at 24 °C (Extended Data Fig. 11i). UCP1 was also reduced in aged mice, consistent with the lower BA-H/BA-L ratio (Extended Data Fig. 11i). Despite increased BA-L abundance, cold-induced TNAP expression was also blunted with age, although TNAP remained enriched in BA-L cells (Extended Data Fig. 11j), suggesting impaired futile creatine cycle activation. Aged mice also exhibited a 1.8-fold increase in BAT corticosterone (the active form of glucocorticoid in mice) in BAT, but not serum corticosterone (Extended Data Fig. 11k,l), and a sixfold increase in BAT Il1b expression arising from SVFs (Extended Data Fig. 11m,n). Together, these results suggest that elevated local IL-1β and H6PD-mediated overactivation of the GR–RGS2–AC axis lower the BA-H/BA-L ratio, therefore impairing cold-induced thermogenesis in aged mice.
Lastly, we investigated whether GR inhibition could restore BA bistable regulation and thermogenesis in aged mice. One week of RU-486 treatment increased the proportion of BA-H cells in aged mice from 0.5% to 8.3% at room temperature and from 10.6% to 32.8% after 1 day of cold exposure (Fig. 5j–m). RU-486 also reduced lipid droplet accumulation within BAs and improved BAT whitening (Fig. 5n), increased rectal temperature during the cold tolerance test and reduced body weight in the first few days of cold exposure (Extended Data Fig. 11o,p). Metabolic cage studies revealed that RU-486 treatment increased energy expenditure and oxygen consumption across the day–night cycle, without changes in respiratory exchange ratio, locomotor activity or food intake (Extended Data Fig. 11q–u). Thus, GR antagonism increases energy expenditure in aged mice, potentially due to elevated UCP1-dependent thermogenesis in BAT.
Discussion
We found that the two BA subtypes are spatially organized and tightly regulated. IL-1β stabilizes surrounding BAs in the low-thermogenic state (BA-L cells) by extending H6PD protein half-life. H6PD facilitates active glucocorticoid production, which suppresses UCP1 expression through the GR–RGS2–AC axis (Extended Data Fig. 12a). BAs further from IL-1β puncta are stabilized in the high-thermogenic state (BA-H cells) with low H6PD protein levels (Extended Data Fig. 12b). During cold stimulation, activated sympathetic neurons secrete NA, which suppresses IL-1β production by immune cells. Low IL-1β levels promote H6PD degradation and switch BA-L cells into BA-H cells (Extended Data Fig. 12a,b). After cold stimulation, this process is reversed, restoring a lower BA-H/BA-L ratio. Age impairs the flexibility to alter BA heterogeneity due to IL-1β overload in BAT, which significantly contributes to the age-related decline in thermogenesis (Extended Data Fig. 12b).
The advantages of this spatiotemporal neuronal–immune regulation of BA heterogeneity are multifaceted. First, it enables a dual-layered response: an immediate, acute response through readily active BA-H cells, and a longer-term, chronic response that involves shifting cellular heterogeneity. Second, it facilitates communication between different cell types through spatial proximity, thereby integrating stimuli from multiple systems, combining environmental and internal cues, and enabling precise regulation of cell states. Third, shifting between BA-H and BA-L states preserves BAs from oxidative damage associated with sustained high thermogenesis.
Although this study primarily focused on UCP1-dependent thermogenesis, UCP1-independent mechanisms are also critical for thermogenic adipose tissue function and whole-body metabolic homeostasis39,40,41. We observed that TNAP, a key component of the futile creatine cycle, is enriched in BA-L cells. Cold exposure increased the proportion of BA-H cells while inducing CKB and TNAP expression in BAT42, reflecting enhanced futile creatine cycle activity either specifically in BA-L cells or across all BAs, with BA-L cells retaining higher activity. Importantly, cold-induced TNAP expression was compromised with age, while remaining enriched in BA-L cells. These results suggest that both UCP1- and futile creatine cycle-dependent thermogenesis are impaired with age.
BAT has long been recognized as a target organ for glucocorticoids, but their precise role remains unclear. Some studies indicate that glucocorticoids suppress UCP1 expression and/or BAT activity43,44,45,46, whereas others reach the opposite conclusions47,48,49. Glucocorticoids have also been implicated in warm-induced beige adipocyte whitening50. This study shows that GR signalling in BAT regulates BA heterogeneity by locking BAs in the BA-L state and reducing their responsiveness to NA. Active glucocorticoid levels are regulated locally, independent of systemic levels25. Thus, systemic glucocorticoid treatments may not alter active glucocorticoid levels in individual BAs, potentially explaining previous conflicting observations. Importantly, inducible GR deletion in BAs during the transition from cold to room temperature sustained the high BA-H/BA-L ratio and thermogenesis. The stage- and cell-subtype-specific requirement of GR signalling explains why Nr3c1-knockout mice do not exhibit altered BAT development or thermogenesis51,52, and indicates that targeting GR at selective timing could profoundly manipulate thermogenic activity.
Our study showed that BA heterogeneity is determined by communication from sympathetic neurons to immune cells, rather than by direct communication from sympathetic neurons to BAs. NA, the primary neurotransmitter from sympathetic nerves, has been shown to modulate immune cell response by regulating cytokine production by immune cells in the liver and adipose tissue53,54. We found that NA directly suppresses Il1b production in immune cells through β-adrenergic signalling, thereby modulating BA heterogeneity. Notably, a recent study showed that cold-induced β3-adrenergic activation transiently recruits neutrophils predominantly to white adipose tissue (WAT), particularly the visceral depot55. These infiltrating neutrophils produce IL-1β, which suppresses local lipolysis by attenuating cAMP-dependent signalling, thereby limiting excessive lipid mobilization. Based on our findings in BAT, IL-1β may similarly suppress lipolysis through the H6PD–GR–RGS2–AC axis in white adipocytes. Notably, Il1b expression in WAT exhibits transient kinetics, peaking at 12 h after stimulation and returning to basal levels at 24 h. Given that NA suppresses Il1b expression in BAT, it may similarly suppress Il1b expression in newly infiltrated neutrophils in WAT.
It remains unclear why in vitro-differentiated BAs exhibit heterogeneity. BAs may intrinsically differentiate into cells with varying UCP1 levels to preserve thermogenic flexibility or maintain metabolic balance. Cross-talk between BAs and IL-1β+ immune cells in vivo may further reinforce and spatially organize this heterogeneity. Alternatively, IL-1β+ immune cells in SVFs during differentiation may influence the local environment. Indeed, depletion of CD45+ immune cells from SVFs before differentiation substantially increased the proportion of BA-H cells, suggesting that SVF immune cells reduce the BA-H/BA-L ratio. Future efforts with cell type-specific receptor knockout mouse models will help to validate and further elucidate how sympathetic innervation regulates IL-1β secretion and how IL-1β regulates H6PD protein stability.
Decline of thermogenesis and age-related adiposity56 contribute to age-related metabolic disorders. Previous studies suggest that reduction in thermogenic activity may be due to impaired beige adipogenesis5,57, declined mitochondrial fuel oxidation3, reduced adrenergic receptors, altered other master regulators of thermogenesis58 and compromised sympathetic innervation due to infiltration of senescent immune cells59. Our study showed that Il1b is increased in aged BAT, consistent with previous studies reporting increased immune cell infiltration and upregulated cytokines in aged BAT59. Increased IL-1β stabilized large amounts of BAs in the BA-L state and suppressed thermogenesis in aged mice. Importantly, pharmacological inhibition of GR signalling by a GR antagonist raised the BA-H/BA-L ratio and improved cold-induced thermogenesis in aged mice, indicating that BA-specific GR signalling could be targeted to correct age-related cold intolerance and significantly increase basal metabolism. However, given the systemic effects of RU-486 (ref. 60), other tissues and cell types may also contribute. Future efforts will focus on the effects of targeted inhibition of GR signalling specifically in thermogenic cells.
Methods
Mouse lines
All animal experiments were approved by the Institutional Animal Care and Use Committees of City of Hope (protocol 17014). Mice were maintained under a 12 h–12 h dark–light cycle in a temperature-controlled facility with ad libitum access to water and food. The diets included a standard chow diet (5053, Lab diet), an HFD (D12492, Research Diets) and a chow diet supplemented with 600 mg per kg doxycycline (S4107, Bio-Serv), as described for individual experiments. The Ucp1-rtTA mouse line was generated as previously described15,61. The Ucp1-mGFP knock-in mouse line was created by Biocytogen through microinjection of CRISPR components and a donor vector into C57BL/6J zygotes. The single guide RNA targeted the junction of the exon 6 coding region and 3′ untranslated region (UTR) (CTTCCTCCAAGTTGCTTATG + TGG) of the Ucp1 gene, and a P2A-mGFP cassette was inserted at the 5′ end of the 3′ UTR, immediately upstream of the Ucp1 gene stop codon. TRE-Cre (B6.Cg-Tg(tetO-cre)1Jaw/J, 006234), Rosa26-loxp-STOP-loxp-mT/mG (B6.129(Cg)-Gt (ROSA)26Sortm4(ACTB-tdTomato,-eGFP) Luo/J, 007676) and Nr3c1-floxed (B6.Cg-Nr3c1tm1.1Jda/J, 021021) mouse lines were purchased from the Jackson Laboratories. To generate mice lacking GR proteins selectively in BAs, Ucp1-rtTA and TRE-Cre mice were crossed with Nr3c1-floxed mice. Littermates lacking TRE-Cre were used as control mice. All mice were maintained on a pure C57BL/6J background. The sample sizes for animal experiments were determined based on previous studies. Experimental groups were randomly assigned. Investigators were blinded to group allocation during rectal temperature measurement, but blinding was not feasible for other experiments.
Unilateral denervation of BAT
Unilateral denervation of BAT was performed as previously described62. In brief, 8-week-old male mice were anaesthetized with 5% isoflurane and placed onto a warm surgical platform. The interscapular surgical region was shaved and sterilized with 70% isopropyl rubbing alcohol and iodine. A 1 cm lateral incision was made from the scapula to the neck, and the interscapular BAT depot was carefully detached from the underlying muscle layer and retracted cranially over the head using toothed forceps. Five branches of the intercostal sympathetic nerve bundles innervating the left and right BAT lobes were exposed. Unilateral denervation was achieved by cutting the nerve bundles on the left side, while the right nerve bundles were exposed and touched as a sham-operated control. The BAT lobes were repositioned, and the incision was closed using absorbable 5.0 sutures. Mice were allowed to recover for 2 weeks before undergoing further experimental procedures.
Lentivirus production and local injection into BAT
To construct the H6pd-expressing lentiviral vector, the mouse H6pd complementary DNA (cDNA) (NM_173371.4) was amplified using primers with 5′ BamH I and 3′ Sal I restriction sites. To construct the Il1rn-expressing lentiviral vector, the mouse Il1rn cDNA (NM_031167.5) was amplified using primers with 5′ BamH I and 3′ Sal I restriction sites. The PCR products were cleaved with BamH I and Sal I and ligated into the pLenti-mCherry vector (36084, Addgene) to generate the pLenti-mH6pd lentiviral vector or pLenti-mIl1rn lentiviral vector. Lentiviral particles were produced by co-transfecting HEK293T (ATCC) cells with the pLenti-mCherry, pLenti-mH6pd, or pLenti-mIl1rn transfer plasmids, along with the packaging psPAX2 (12260, Addgene) and envelope plasmids pMD2.G (12259, Addgene) at a 1:1:1 ratio, using PEI (1 μg DNA to 3 µl PEI). HEK293T cells were not independently authenticated but were regularly tested for mycoplasma contamination, with negative results. After 72 h, the supernatant containing lentiviral particles was collected, filtered through a 0.45-μm PES filter and concentrated using the Lenti-X concentrator (631232, Takara Bio). The concentrated lentivirus was resuspended in PBS, stored at −80 °C and titrated using an RT-PCR Titration kit (631235, Takara Bio). Lentivirus administration in BAT was performed as described previously63. In brief, 10-week-old male Ucp1-mGFP or Ucp1-Chaser-mT/mG mice were anaesthetized with 5% isoflurane. A small lateral incision (~0.5–0.8 cm) was made in the interscapular area to expose BAT. Then 10–20 μl of either pLenti-mH6pd lentivirus, pLenti-mIl1rn lentiviral or a negative control lentivirus (109 IFU ml−1) was directly injected at three distinct sites into each interscapular BAT lobe.
Three-dimensional imaging of BAT
For three-dimensional fluorescence imaging of BAT, we used the Adipo-Clear method as described previously64. In brief, 8-week-old male Ucp1-Chaser-mT/mG mice were fed a doxycycline diet for 3 days at 24 °C. Mice were anaesthetized and perfused with cold PBS containing 100 U ml−1 heparin (H3149, Sigma-Aldrich), followed by ice-cold 4% PFA. The BAT was then dissected and post-fixed in 4% PFA at 4 °C overnight. After fixation, the tissue was washed with PBS, trimmed and delipidated using a graded series of methanol–B1n buffer, followed by 100% dichloromethane. After delipidation, the BAT was washed with a graded series of methanol–B1n buffer, followed by PTwH buffer. The sample was then incubated with primary rabbit anti-TH polyclonal antibody (1:200, ab152, Abcam) or rabbit anti-synaptophysin antibody (1:200, ab32127, Abcam) along with chicken anti-GFP antibody (1:200, ab13970, Abcam), diluted in PTxwH buffer at room temperature for 3 days. After incubation with primary antibodies, the sample was washed with PTxwH buffer and then incubated with secondary antibodies: Alexa Fluor 647-conjugated donkey anti-rabbit IgG(H+L) (A31573, Thermo Fisher Scientific) and Cy3 AffiniPure F(ab′)2 fragment donkey anti-chicken IgY (IgG) (H+L) (703-166-155, Jackson Immuno Research) secondary antibodies at room temperature for 3 days. The sample was dehydrated through a series of methanol and 100% dichloromethane and then cleared with dibenzyl ether. Three-dimensional imaging of the cleared BAT was performed using tile scanning with a confocal laser-scanning microscope (LSM 880, Zeiss) at ×10 and ×20 magnifications, with image acquisition and analysis conducted using the Zeiss Zen black software.
Adipose SVF isolation and differentiation
The SVF of BAT was isolated from the interscapular BAT of mice on postnatal day 7, while the SVF from iWAT was obtained from 5-week-old male mice. In brief, dissected BAT or iWAT was minced and digested for 45 min at 37 °C in a digestion buffer containing 1.5 mg ml−1 collagenase D (11088882001, Sigma-Aldrich) in an isolation buffer (0.123 M NaCl, 5 mM KCl, 1.3 mM CaCl2, 5 mM glucose, 100 mM HEPES and 4% BSA). The cell–tissue mixture was filtered through a 70-μm cell strainer (08-771-2, Thermo Fisher Scientific) to remove undigested fragments, then centrifuged for 5 min at 300g at 4 °C. The resulting cell pellet was resuspended in growth medium (DMEM, 10566016 Life Technologies; 1% penicillin–streptomycin, SV30010 Hyclone; 0.1% gentamicin, 1855724 Life Technologies and 20 mM HEPES, Sigma-Aldrich, H3537) containing 20% FBS (16H328, Sigma-Aldrich) and filtered again through a 40-μm cell strainer (08-771-1, Thermo Fisher Scientific) to remove clumps and adipocytes. The flow-through was centrifuged for 5 min at 300g at 4 °C, and the SVF pellet was resuspended in SVF growth medium and plated onto a 12-well tissue culture plate for RNA and protein extraction or onto a 35 mm glass-bottom tissue culture dish for IF staining. For differentiation into brown and beige adipocytes, SVF cells were switched to fresh induction medium (DMEM plus DEX (1 μM), insulin (0.12 μg ml−1), isobutylmethylxanthine (0.5 mM), T3 (1 nM), indomethacin (0.125 mM), 20 mM HEPES, 1% penicillin–streptomycin and 0.1% gentamicin) containing 10% FBS on day 0 (2 days after reaching confluence). After 2 days, the medium was replaced with maintenance medium (DMEM with insulin (0.12 μg ml−1), T3 (1 nM), 20 mM HEPES, 1% penicillin–streptomycin and 0.1% gentamicin) containing 10% FBS, and this maintenance medium was changed every 2 days until further use.
Cell treatment
For glucocorticoid treatment, SVF cells from the BAT of Ucp1-mGFP mice were cultured and differentiated as described. During differentiation, cells were treated with or without 1 μM corticosterone (16063, Cayman Chemical), 1 μM DEX (D4902, Sigma-Aldrich) or 1 μM 11-DHC (32907, Cayman Chemical) in the induction medium. On differentiation day 6, the density of GFP fluorescence was assessed under a microscope (BZ-X710, Keyence) to quantify the BA-H/BA-L ratio. For the PKA activity assay, on differentiation day 6, primary BAs differentiated were pretreated with 1 μM 11-DHC or vehicle for 48 h, followed by incubation with 1 μM NA (A0937, Sigma-Aldrich), 10 μM forskolin (F6886, Sigma-Aldrich) or 500 μM 8-Br-cAMP (B7880, Sigma-Aldrich) for 30 min. PKA activity was measured by western blot analysis using antibodies specific to phosphorylated PKA substrates. For the H6PD half-life assay, BAs differentiated from primary BAT SVFs were pretreated with 10 ng ml−1 IL-1β (401-ML-005, R&D Systems) or vehicle for 4 h, followed by exposure to 50 µg ml−1 CHX (C1988, Sigma-Aldrich) with IL-1β or saline for various timepoints (0, 3, 6 and 12 h) at 37 °C, with H6PD quantified by western blot analysis. For cytokine treatment, on differentiation day 6, primary BAs were treated with saline, 10 ng ml−1 IL-1β, 20 ng ml−1 TNF (410-MT-010, R&D Systems) and 10 ng ml−1 IFNγ (485-MI-100, R&D Systems) alone or in combination for 48 h. For IL-1β signalling inhibition, BAs were treated with saline, 10 ng ml−1 IL-1β or IL-1β in combination with 10 μM p38 kinase inhibitor SB203580 (559395, Sigma-Aldrich), 5 μM NF-κB inhibitor BAY11-7082 (196871, Sigma-Aldrich), 10 μM JNK inhibitor SP600125 (420119, Sigma-Aldrich), 10 μM ERK inhibitor U0126 (662005, Sigma-Aldrich) or 5 mM IKKβ inhibitor aspirin (A5376, Sigma-Aldrich) for 48 h, with inhibitors administered 1 h before IL-1β treatment. To test the effect of IL-1β on UCP1 expression, BAs on day 6 were switched to culture medium containing charcoal-stripped FBS and then treated with vehicle or 10 ng ml−1 IL-1β for 48 h in the absence or presence of 1 μM 11-DHC. For DEX and RU-486 treatment, the BAs on day 6 were pretreated with vehicle or 10 μM RU-486 for 1 h, followed by treatment with 1 μM NA in the presence or absence of 1 μM DEX for 24 h. The concentrations of UCP1, H6PD and β-actin were quantified by western blot analysis. To assess the effect of immune cells on BAs heterogeneity, SVF cells from the BAT of Ucp1-mGFP mice were cultured and differentiated as described, with or without CD45+ immune cells. CD45+ immune cells were depleted from SVFs using PE-anti-CD45 antibody (103106, BioLegend) and EasySep Reagents (17656, StemCell Technologies).
Isolation of mouse primary BAs and treatment
Mature BAs from the interscapular BAT of 10-week-old male mice were obtained as described before. In brief, BATs were dissected, cleaned of contaminating muscle and WAT, minced into small pieces, and digested in collagenase-dispase buffer (17703034, Gibco) for 1 h at 37 °C with shaking at 110 r.p.m. The cell suspension was filtered through 100-μm cell strainers (08-771-19, Thermo Fisher Scientific) to remove undigested tissues, washed with 3 volumes of DMEM/F12 medium (10565018, Life Technologies) containing 10% FBS and centrifuged at 100g for 5 min at room temperature. The floating BAs were transferred and resuspended in PBS wash buffer three times. After quantification, 5 × 10⁵ BAs were suspended in Matrigel (Corning, CB-40234C) at a 1:1 volume ratio and seeded into 6-well tissue culture dishes. The plates were incubated at 37 °C for 15 min to induce gel formation. Maintenance medium (DMEM with insulin (0.12 μg ml−1), T3 (1 nM), 20 mM HEPES, 1% penicillin–streptomycin and 0.1% gentamicin) containing 10% FBS was then added to the wells with either vehicle, 1 μM DEX, 10 μM CL-316,243 (C5976, Sigma-Aldrich) or 1 μM DEX combined with 10 μM CL-316,243 for 24 h. For the separation of BA-H and BA-L cells, we modified our previous protocol6 by adding additional steps to further deplete contaminating SVFs in BA-L cells. In brief, floating BAs were collected as BA-L cells, and the pellet containing BA-H cells and SVF was further separated using the EasyPlate magnet-based method. The cell suspension was incubated with PE-conjugated antibodies against immune cells (PE-anti-CD45, 103106, BioLegend), endothelial cells (PE-anti-CD31, 102408, BioLegend), fibroblasts (PE-anti-CD140a, 135905, BioLegend) and pericytes (PE-anti-CD146, 134704, BioLegend) and processed using EasySep reagents (17656, StemCell Technologies) according to the manufacturer’s instructions. Freshly isolated BA-H and BA-L cells (1 × 10⁵ per condition) were incubated in tracing medium (D5030, Sigma-Aldrich) containing either 5 mM [U-13C]glucose or 0.5 mM [U-13C]palmitate for 2 h and 6 h. After incubation, cells were washed with NaCl and collected with cold 50% methanol as before22,23. Metabolites were extracted and analysed by GC–MS.
H&E and IF staining
Mice were anaesthetized and perfused with PBS, followed by 10% formalin fixative buffer. The interscapular BAT, iWAT and gWAT were carefully dissected and post-fixed in 10% formalin buffer overnight at 4 °C. After dehydration, paraffin embedding and sectioning, tissue sections were stained with haematoxylin and eosin (H&E).
For human samples, adipose tissue was collected during thyroid surgery. Written informed consent was obtained from all patients. Supraclavicular adipose tissue was removed as waste biological material from subjects undergoing surgery at the General Hospital (AOU; Ancona, Italy) for thyroid diseases. Ethical approval was obtained from the specific Commission within the Azienda Ospedaliero Universitaria delle Marche (University Hospital of the Marche Region). The ethical approval protocol code is 208156. Immediately after removal, tissue pieces were fixed overnight at 4 °C by immersion in 4% paraformaldehyde in 0.1 M phosphate buffer (pH 7.4). They were then dehydrated, cleared and paraffin embedded. Sections from three levels (100 μm apart) were stained with H&E to assess morphology and BAT presence for UCP1-immunohistochemistry.
For IF staining of mouse and human tissues, paraffin-embedded sections of Ucp1-mGFP and Ucp1-Chaser-mT/mG mice and human BAT slides were deparaffinized in xylene and rehydrated using a graded ethanol series to double-distilled H2O. The slides were immersed in 10 mM sodium citrate buffer (C9999, Sigma-Aldrich) and boiled for 30 min for antigen retrieval, then blocked in PBST containing 0.3% Triton X-100 and 5% BSA. Primary antibodies used were as follows: perilipin (1:500, NB100-60554, Novus and ab61682, Abcam), UCP1 (1:200, ab23841, Abcam and MAB6158, R&D Systems), GFP (1:200, ab13970, Abcam; and 2956S, Cell Signaling Technology), mCherry (1:200, ab167453, Abcam), H6PD (1:200, ab170895, Abcam; and 15255-1-AP, Proteintech), TNAP (1:200, AF2910, R&D Systems), GR (1:200, 12041S, Cell Signaling Technology), RGS2 (1:200, NBP1-32284, Novus), IL-1RA (1:100, MA5-35068, Thermo Fisher Scientific), IL-1β (1:50, AF-401-NA, R&D Systems), F4/80 (1:100, ab6640, Abcam) and CXCR2 (1:100, 20634-1-AP, Proteintech). Secondary antibodies (1:200 dilution) used were Alexa Fluor 647-conjugated donkey anti-mouse IgG (H+L) (A31571, Thermo Fisher Scientific), Alexa Fluor 555-conjugated donkey anti-rabbit IgG(H+L) (A31572, Thermo Fisher Scientific), Alexa Fluor 647-conjugated donkey anti-rabbit IgG(H+L) (A31573, Thermo Fisher Scientific), Alexa Fluor 488-conjugated donkey anti-goat IgG (H+L) (A32814, Thermo Fisher Scientific), Alexa Fluor 555-conjugated donkey anti-rat IgG (H+L) (A48270, Thermo Fisher Scientific), Alexa Fluor 647-conjugated donkey anti-goat IgG (H+L) (A21447, Thermo Fisher Scientific) and Cy3 AffiniPure F(ab′)2 fragment donkey anti-chicken IgY (IgG) (H+L) (703-166-155, Jackson Immuno Research). Slides were counterstained with 1 μg ml−1 DAPI (D9542, Sigma-Aldrich) and mounted with prolonged Anti-Fade mounting medium (P36931, Invitrogen). Bright-field and fluorescence images were acquired using an inverted fluorescence phase-contrast microscope (BZ-X710, Keyence).
Fluorescence microscopy image quantification
Fluorescence microscopy images were acquired for three experimental conditions: room temperature, cold exposure and cold exposure with denervation. For each condition, dual-channel fluorescence images were collected with UCP1 labelled in the green channel and IL-1β labelled in the magenta channel, along with corresponding autofluorescence reference images for cellular region identification. All image analysis was performed using custom Python scripts using the tifffile, numpy, scipy and pandas libraries. To restrict analysis to cellular regions and exclude background artifacts, autofluorescence images were Gaussian-smoothed and used to generate binary masks with a threshold of 50 arbitrary units applied to autofluorescence intensity values65, ensuring that correlation analysis was performed exclusively on biologically relevant areas. To eliminate low-intensity noise and focus analysis on meaningful fluorescence signals, intensity-based thresholds were applied to both channels: UCP1 (green channel) at 70 arbitrary units and IL-1β (magenta channel) at 20 arbitrary units. Pixels were retained for analysis if they exceeded the threshold in either channel, using a logical OR to preserve regions with specific labelling while maintaining sensitivity to differential expression patterns. Co-localization between UCP1 and IL-1β was quantified using the Pearson correlation coefficient (PCC), calculated pixel-wise across filtered cellular regions66. After masking and thresholding, images were vectorized by flattening two-dimensional pixel arrays into one-dimensional arrays. The PCC was computed using scipy.stats, providing both the correlation coefficient and associated P value for each image pair. Statistical comparisons between experimental conditions were performed using Welch’s t-tests for independent samples with unequal variances. This approach accounts for potential differences in variance between experimental groups while providing robust statistical inference. Results were compiled into structured data frames and visualized using bar plots with error bars.
RT–qPCR
Total RNA was extracted from tissues or cultured cells using either TRIzol reagent (15596026, Thermo Fisher Scientific) or RNAqueous-Micro Total RNA Isolation Kit (AM1931, Thermo Fisher Scientific). The first-strand cDNA was synthesized using the iScript cDNA synthesis kit (1708891, Bio-Rad) according to the manufacturer’s instructions. qPCR was performed using the SYBR Green PCR system (A25742, Applied Biosystems) with Tbp as the internal control. A list of all of the primer sequences is provided in Supplementary Table 1.
Western blot analysis
Adipose tissues, cultured adipocytes and isolated mature BAs were collected and lysed in radioimmunoprecipitation assay (RIPA) buffer (20-188, Sigma-Aldrich) containing protease inhibitor cocktails (11836170001, Sigma-Aldrich) and phosphatase inhibitor cocktails (P5726, P0044, Sigma-Aldrich). The extracted protein samples were loaded onto and separated on a 4–15% gradient SDS–PAGE TGX stain-free gel (4568086, Bio-Rad) and transferred to a PVDF membrane (1620177, Bio-Rad). The membranes were incubated with specific primary antibodies against H6PD (ab170895, Abcam and 15255-1-AP, Proteintech), UCP1 (ab23841, Abcam), GFP (2956S, Cell Signaling Technology), phosphorylated PKA substrates (RRXS/T) (9624S, Cell Signaling Technology), TH (ab152, Abcam), TNAP (AF2910, R&D Systems), CKB (18713-1-AP, Proteintech), GR (12041S, Cell Signaling Technology), IL-1R1 (PA5-97866, Thermo Fisher Scientific) and β-actin (4970 and 58169, Cell Signaling Technology). HRP-conjugated goat anti-rabbit IgG (1706515, Bio-Rad) and HRP-conjugated goat anti-mouse IgG (1706516, Bio-Rad) were used as secondary antibodies. The immunoreactive signals were detected using the Pierce ECL Western Blotting Substrate (32209, Thermo Fisher Scientific) and SuperSignal West Pico PLUS Chemiluminescent substrate (34577, Thermo Fisher Scientific).
Transfection of mature BAs
Mature BAs were reverse-transfected with dsiRNA as described previously67. In brief, on differentiation day 5, BAT-derived primary BAs were trypsinized using 0.25% trypsin (25200, Thermo Fisher Scientific) for 15 min. The cells were then resuspended in culture medium and seeded onto gelatin-coated cell culture plates that had been pre-incubated with a pool of 50 nM H6pd dsiRNAs, 50 nM Rgs2 dsiRNAs, 50 nM Il1r1 dsiRNAs or relevant control dsiRNAs (Integrated DNA Technologies), mixed with 5 μl ml−1 of Lipofectamine RNAiMAX (13778075, Thermo Fisher Scientific) diluted in Opti-MEM medium (31985070, Thermo Fisher Scientific). The final density of BAs was 2.5 × 10⁵ cells per cm2 of culture plate. Mature BAs were treated or collected 2 days after transfection. A list of all of the dsiRNA sequences is provided in Supplementary Table 1.
Thermoneutral or cold exposure and adrenoceptor agonist treatment
Mice were housed individually in temperature- and light-controlled rodent incubators (Powers Scientific) set to either thermoneutrality (30 °C) or cold (6 °C), with ad libitum access to food and water. For the β3-adrenoceptor agonist treatment experiment, mice were maintained at thermoneutrality for 1 week, followed by daily intraperitoneal injections of CL-316,243 in PBS at 1 mg per kg body weight for an additional 7 days. For adrenoceptor antagonist treatment, mice were exposed at 6 °C for 16 h, followed by intraperitoneal injections of propranolol (10 mg per kg; P0884, Sigma-Aldrich) or phenoxybenzamine hydrochloride (5 mg per kg; HY-B043A, MedChemExpress) in PBS for 4 h.
Flow cytometry
For flow cytometry analysis, SVF cells were blocked with anti-mouse-CD16/32 (1:500, 101302, BioLegend) for 10 min, and then stained with anti-mouse-CD45-BV605 (1:400, 103155, BioLegend), anti-mouse-CD11b-APC (1:100, 101212, BioLegend), anti-mouse-F4/80-488 (1:100, 123120, BioLegend), anti-mouse-Ly6C-PE/Cy7 (1:400, 128018, BioLegend), anti-mouse-CXCR2-PE (1:20, 149304, BioLegend), anti-mouse-CD3-488 (1:100, 100210, BioLegend) and anti-mouse-CD19-PE (1:200, 152408, BioLegend) for individual experiments for 20 min on ice. After antibody incubation, the cells were washed once with 2% FBS–PBS. For intracellular staining, cells were stained with LIVE–DEAD fixable dead cell stain (65-0868-14, Invitrogen) for 30 min on ice. After washing with PBS, cells were fixed and permeabilized using a fixation/permeabilization kit (554714, BD bioscience) according to the manufacturer’s instructions. In brief, cells were fixed with fixation–permeabilization solution for 15 min on ice, followed by a wash with PBS and 1× perm–wash buffer. Cells were stained with anti-mouse-IL-1β-APC/eFluor 780 (1:80, 47-7114-82, Invitrogen) in 1× perm–wash buffer for 30 min on ice. After staining, cells were washed once with 1× perm–wash buffer and analysed by BD Fortessa cytometer. The flow plots were analysed by FlowJo (v.10).
DEX, RU-486 and VX-765 treatment of mice
Eight-week-old male C57BL/6J mice were subcutaneously (s.c.) injected with either vehicle or 5 mg per kg per day water-soluble DEX (D2915, Sigma-Aldrich) dissolved in PBS for 2 weeks. Ucp1-Chaser-mT/mG mice aged 10 weeks were maintained on doxycycline chow diet and administered vehicle or VX-765 (HY-13205, MedChemExpress, 50 mg per kg per day), dissolved in 20% (v/v) Cremophor EL, through daily intraperitoneal injection for 1 week. Ucp1-Chaser-mT/mG or WT mice aged 70–75 weeks were injected s.c. with 60 mg per kg mifepristone (RU-486) (HY-13683, MedChemExpress) dissolved in DMSO–corn oil or with DMSO–corn oil alone daily as controls for 1 week. Body temperature was recorded daily throughout the treatment period. After the final RU-486 or vehicle injection, mice were individually housed and exposed to a cold environment (6 °C). Rectal temperatures were measured at the indicated timepoints using a rodent thermometer (Bioseb, TK8851). For metabolic phenotyping, 72-week-old male WT mice were s.c. injected with either vehicle or RU-486 (60 mg per kg per day) for 1 week, followed by metabolic phenotyping with continuing daily vehicle or RU-486 injection for an additional 3 days. During the metabolic cage study, energy expenditure, oxygen consumption, RER, locomotor activity and food intake were recorded. At the end point, the mice were perfused with PBS and 10% formalin and processed for H&E and IF staining as described above.
Glucose and insulin tolerance test
Male Ucp1-rtTA;TRE-cre;Nr3c1flox/flox or control littermates aged 10 weeks were fed a doxycycline diet at 6 °C for 1 week, then continued for an additional week after being moved back to 24 °C, followed by glucose tolerance tests and insulin tolerance tests. For the glucose tolerance test, mice were fasted for 12 h before intraperitoneal injection of glucose (2 g per kg body weight). For the insulin tolerance test, mice were fasted for 6 h before intraperitoneal injection of insulin (0.75 U kg−1, Eli Lilly). Tail vein blood samples were collected at 0, 15, 30, 60, 90 and 120 min after injection, and blood glucose levels were measured using a Contour glucometer (Bayer).
NA stimulation of the BAT explants and CD45+ immune cells
BAT depots were dissected from the interscapular BAT of male C57BL/6J mice exposed to 30 °C for 1 week and minced into 1–2 mm3 explants. The explants were washed three times with PBS and transferred to a six-well plate containing DMEM with 10% FBS. BAT SVFs were isolated as described above, and CD45+ immune cells were enriched using PE-anti-CD45 antibody (103106, BioLegend) and EasySep Reagents (17656, StemCell Technologies). Explants were incubated in saline or 10 mM NA (A0937, Sigma-Aldrich) for 24 h and CD45+ immune cells were treated with saline or NA (1 μM) for 4 h. After incubation, explants and CD45+ cells were collected for RNA extraction.
Bone marrow neutrophil isolation and stimulation
Bone marrow neutrophils were isolated from 10-week-old male WT mice. In brief, femurs and tibias were flushed with PBS containing 2 mM EDTA and 2% FBS using a 23-gauge needle, and the cell suspension was filtered through a 70-μm strainer. Cells were centrifuged at 400g for 5 min, and the pellet was resuspended in red blood cell lysis buffer (R7757, Sigma-Aldrich) for 1 min at room temperature, followed by neutralization with PBS containing 2% FBS. Neutrophils were enriched using PE-anti-Ly6G antibody (127608, BioLegend) and EasySep Reagents (17656, StemCell Technologies). Neutrophils were cultured in RPMI 1640 supplemented with 2% FBS. Neutrophils were stimulated with LPS (0–1,000 ng ml−1; L4391, Sigma-Aldrich) for 6 h or pretreated with NA (0–10 μM) for 30 min before 100 ng ml−1 LPS stimulation. For time-dependent experiments, neutrophils were treated with LPS with or without 1 μM NA pretreatment for 1–9 h. For adrenergic blockade experiments, neutrophils were pretreated with 1 μM propranolol (P0884, Sigma-Aldrich) or 1 μM phenoxybenzamine (HY-B0431A, MedChemExpress) for 60 min, followed by 1 μM NA and 100 ng ml−1 LPS stimulation. For IL-1β measurement, 10 μM nigericin (HY-100381, MedChemExpress) was added 30 min before sample collection. Neutrophils were collected for RNA extraction, and the supernatants were collected for enzyme-linked immunosorbent assay (ELISA) analysis.
ELISA assays
Blood samples were collected between 08:00 and 10:00, then centrifuged at 2,000g and 4 °C for 20 min to separate the serum. BAT was homogenized in a TissueLyser with 1 ml of 80% methanol on ice. The samples were then subjected to 3–5 freeze–thaw cycles and centrifuged at 4 °C and 13,000 r.p.m. for 15 min. The supernatant, which contains sterols, was collected, evaporated and dissolved in an assay buffer. Serum and tissue corticosterone levels were measured using a corticosterone ELISA kit (ADI-900-097, Enzo Biochem). Serum IL-1β levels were measured using an IL-1β ELISA kit (ab197742, Abcam). Neutrophil supernatant IL-1β was measured using an IL-1β ELISA kit (MLB00C-1, R&D Systems).
Integration of scRNA-seq datasets
scRNA-seq data from the non-adipocyte fraction of BAT of C57BL/6J mice maintained at room temperature were obtained and selected from the National Center for Biotechnology Information (NCBI) Gene Expression Omnibus (GEO) database under accessions GSE207707, GSE177635, GSE160585 and GSE161447. Data processing and analysis were conducted using Seurat v.4.0.6 in R v.4.1.2. Each dataset was imported, converted to Seurat objects, normalized and then variable features were identified. Integration anchors were computed to merge the datasets into a unified Seurat object. Quality control involved filtering out cells with fewer than 200 detected features and those with mitochondrial gene content exceeding 10%. The integrated data were scaled, and principal component analysis was performed. Clustering was performed using the Louvain algorithm with a resolution of 1.0. For visualization, t-distributed stochastic neighbour embedding was used to depict cell clusters. Identification of each cell type was determined by comparing cell cluster-specific marker genes with known cell type-specific markers from the literature. Immune cell clusters were further identified and subclustered based on the expression of Ptprc, and non-immune cell types, including erythrocytes (Hba-a1 and Hba-a2), capillary endothelial cells (Pecam1 and Gpibp1), smooth muscle cells (Acta2) and adipose progenitor cells (Pdgfra and Col3a1), were excluded from the analysis.
Identification of DEGs and enriched pathways
To identify differentially expressed genes (DEGs) and enriched pathways between BA-L and BA-H cells, scRNA-seq data deposited in the NCBI GEO database under accession number GSE125269 were analysed. Adipocyte clusters were selected based on Plin1 expression, while contaminating endothelial cells (Pecam1) were excluded from the analysis. BA-L and BA-H cell populations were identified as described previously6. These populations were further compared to identify DEGs using the FindMarker function, which applied the Wilcoxon rank-sum test, with a log-transformed fold change threshold of 0.25 and a minimum detection fraction (min.pct) of 25%. To control the false discovery rate, P values were adjusted using the Benjamini–Hochberg method, and genes with an adjusted P of <0.05 were considered statistically significant. Visualization of the top 50 upregulated DEGs in both BA-L and BA-H cells was generated using the DoHeatmap function. Pathway enrichment analysis was performed on the top 75 upregulated and downregulated DEGs in BA-L cells using Gene Ontology Biological Processes. The analysis used Benjamini–Hochberg-adjusted P values to identify significantly enriched pathways. Pathways with an adjusted P of <0.05 and containing at least three enriched genes were considered significantly enriched. The top 20 enriched pathways were determined based on adjusted P values. Dot plots of these pathways were generated to visualize the enrichment results, with specific pathways of interest highlighted for enhanced interpretability.
ChIP–qPCR
After the vehicle and DEX treatment, in vitro-differentiated BAs were cross-linked with 1% formaldehyde (15714-S, Electron Microscopy Sciences) for 10 min at room temperature and quenched with 125 mM glycine for 10 min. Cells were then incubated with ice-cold nucleus preparation buffer (10 mM HEPES, pH 7.5, 1.5 mM MgCl2, 10 mM KCl, 250 mM sucrose, 0.1% NP-40, 0.2 mM DTT, protease inhibitor cocktails) and homogenized using a KIMBLE Dounce tissue grinder (D8938, Sigma-Aldrich). The nuclei were collected by centrifugation at 1,000g for 10 min, washed with PBS containing protease inhibitor cocktails (11836170001, Sigma-Aldrich) and then resuspended in 250 μl nuclear lysis buffer (10 mM Tris, pH 8, 1 mM EDTA and 0.1% SDS). The chromatin was fragmented using the Bioruptor sonicator (Diagenode) for 30 cycles, 30 s on–30 s off with the maximum power setting to generate DNA fragments of 200–500 bp. The sheared chromatin was centrifuged at 13,000 r.p.m. for 10 min at 4 °C to remove debris and diluted tenfold with ChIP dilution buffer (16.7 mM Tris (pH 8), 1.2 mM EDTA, 167 mM NaCl, 1.1% Triton X-100, 0.01% SDS, protease inhibitor cocktail), with 10 μg chromatin for each ChIP. An aliquot of 10% was used for the input control. Then, 5 μg anti-GR antibody (NBP2-42221, Novus Biologicals) or normal rabbit IgG (2729S, Cell Signaling Technology) was added for overnight rocking at 4 °C. Next, 40 μl protein A/G Dynabeads (26162, Thermo Fisher Scientific) was added to the ChIP samples and rotated for 2 h at 4 °C. The Dynabeads were washed in low-salt wash buffer (20 mM Tris-HCl (pH 8.0), 2 mM EDTA, 150 mM NaCl, 1% Triton X-100, 0.1% SDS), high-salt wash buffer (20 mM Tris (pH 8), 2 mM EDTA, 500 mM NaCl, 1% Triton X-100, 0.1% SDS), LiCl wash buffer (10 mM Tris (pH 8), 1 mM EDTA, 1% NP-40, 1% sodium deoxycholate, 250 mM LiCl) and TE buffer (10 mM Tris (pH 8), 1 mM EDTA) twice at each step. The antibody–chromatin complex was eluted and reverse-cross-linked in 200 μl elution buffer (10 mM Tris (pH 8), 50 mM EDTA, 0.1% SDS, 300 mM NaCl, 0.8 mg ml−1 proteinase K and 10 μg ml−1 RNase A) by incubating at 50 °C for 2 h and subsequently at 65 °C for 8 h. The immunoprecipitated DNA fragments were purified using the MiniElute PCR Purification Kit (28004, Qiagen). ChIP–qPCR was performed using the primers listed in Supplementary Table 1. ChIP enrichments were calculated relative to the input DNA control.
Statistical analysis
Statistical analyses were performed using GraphPad Prism v.10. Results are presented as mean ± s.e.m. All measurements were obtained from individual samples. For each two-group comparison, equality of variances was first assessed using the F test. An unpaired two-tailed Student’s t-test was used when the F test indicated equal variances, whereas Welch’s t-tests were used when the assumption of equal variances was not met. For one-way ANOVA, Tukey’s multiple-comparison test was used when variances were equal, whereas Dunnett’s T3 multiple-comparison test was used when variances were unequal. For two-way ANOVA, Tukey’s or Šídák’s multiple-comparison test was selected according to the experimental design. The statistical tests used are specified in the corresponding figure legends. P < 0.05 was considered statistically significant. Exact P values for all statistical comparisons are provided in Supplementary Table 2.
Reporting summary
Further information on research design is available in the Nature Portfolio Reporting Summary linked to this article.