 Newshot
Main
Insect pests cause losses to crop production and damage vegetation4,5. During feeding, insects release oral secretions containing proteins and other molecules that can activate or suppress host plant defence6,7,8. Digestive enzymes hydrolyse cellular components to generate nutrients for herbivores. These breakdown products also act as host-derived damage-associated molecular patterns (DAMPs) that activate plant pattern-recognition receptors9,10. Identifying host-derived signalling molecules and their defence activation mechanisms is essential for developing new plant-protection strategies.
T2-family ribonuclease (RNaseT2) proteins, which preferentially cleave single-strand RNAs between purine and uridine residues, are ancient enzymes that are widely distributed across organisms and functional in diverse biological processes2,11. Plant S-RNases, which mediate self-incompatibility, belong to this protein family12. Phytopathogens also secrete nucleases into host tissues13,14. Human lysosomal RNaseT2 generates purine-2′,3′-cyclophosphate-terminated oligoribonucleotides that are sensed by Toll-like receptor 8 to activate innate immunity2. Toll/interleukin-1 receptor (TIR) domains of plant intracellular nucleotide-binding and leucine-rich repeat (NLR) immune receptors possess enzymatic activities towards oxidized nicotinamide adenine dinucleotide (NAD+) and nucleic acids15,16,17,18,19. Plant TIR domains generate second messengers such as 2′-ADPR and pRib-AMP, which promote the formation of EDS1–Phytoalexin Deficient 4 (PAD4)–Activated Disease Resistance 1 (ADR1) complex and trigger disease resistance15,20,21. Activated plant TIR also catalyses the production of ADPr-ATP and di-ADPR, leading to the complex formation of EDS1-Senescence-Associated Gene 101 (SAG101)–N Required Gene 1 (NRG1), inducing plant cell death16,22,23. Plant TIR domains also synthesize 2′,3′-cAMP and 2′,3′-cGMP (2′,3′-cAMP/cGMP) through nuclease activity. Arabidopsis nudix hydrolase 7 (AtNUDT7) hydrolyses 2′,3′-cAMP/cGMP and attenuates TIR-mediated cell death when overexpressed in Nicotiana benthamiana3. However, the contribution of 2′,3′-cAMP/cGMP to EDS1-dependent immunity remains elusive.
Plant glycine-rich RNA-binding proteins (GRPs) encompassing one RNA recognition motif (RRM) at the N terminus and a glycine-rich region (GRR) at the C terminus regulate plant responses to abiotic and biotic stresses24,25. Arabidopsis GRP7 (AtGRP7) has a positive role in immunity, whereas the Pseudomonas syringae effector HopU1 suppresses AtGRP7-mediaed immunity by catalysing ADP-ribosylation of an arginine residue (R49) in the RRM of AtGRP726,27,28. These data indicate that the RRM of GRPs is central to immune function, although the underlying molecular mechanism remains unidentified. Here we report that the rice GRP NIB1 interacts with invading insect T2 RNases (such as NVR1) to promote ribonuclease activity and the production of 2′,3′-cAMP/cGMP and ApG>p. Binding to the cyclic nucleotides via RMM stimulates NIB1 phase separation to assemble the plant defence machinery in the nucleus.
Insect RNaseT2 induces plant cell death
Nezara viridula (the green stink bug) is a polyphagous hemipteran pest feeding on a wide range of plants, including economically important food, fruit and vegetable crops and Nicotiana species. Populations of N. viridula have recently increased in rice fields. As a piercing-sucking mesophyll feeder (Fig. 1a), N. viridula uses needle-like stylets to puncture developing seeds or young leaves, extract nutrients and inject effectors29. To identify the secretory enzymes, we profiled proteins in its oral secretions using liquid chromatography–tandem mass spectrometry (LC–MS/MS) and identified 22 putative digestive enzymes, of which 15 were likely to be secretory based on signal peptide prediction (SignalP 3.0 server) and de-redundancy (Blastp) (Extended Data Fig. 1a). Transient expression of these proteins in N. benthamiana leaves identified one candidate enzyme that induced severe cell death and reactive oxygen species (ROS) production within 3 days post-agroinfiltration (dpi) (Extended Data Fig. 1b,c). This protein shows high sequence similarity to ribonuclease and we named it N. viridula ribonuclease 1 (NVR1).
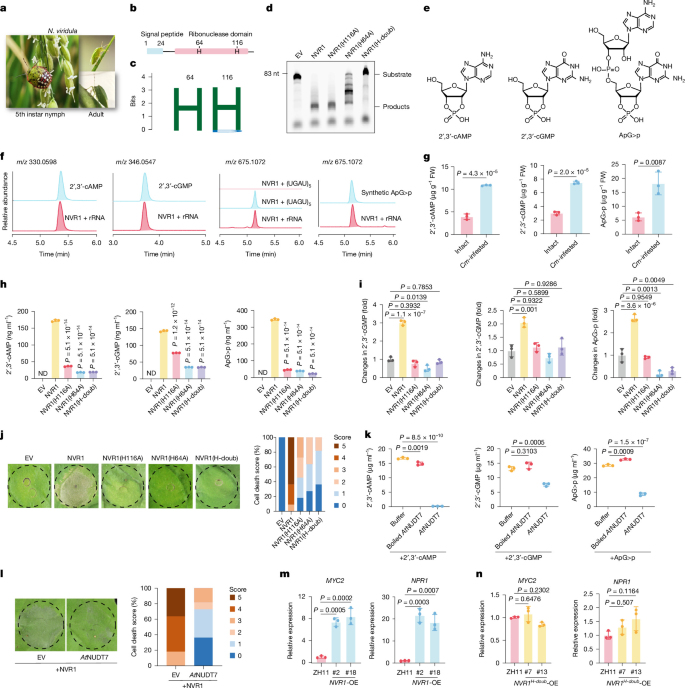
a, Fifth-instar nymph of N. viridula on rice panicle (left) and the adult on kidney beans (right). b, Diagram of NVR1 showing the N-terminal signal peptide (amino acids 1 to 24) predicted by Signalp 3.0 and the nuclease catalytic region (amino acids 28 to 235) predicted by Pfam. H indicates catalytically active histidine residues. c, Logo of conserved catalytically active sites (H64 and H116) in eukaryotic T2 RNases. d, Urea-PAGE separation of RNA digested by NVR1, NVR1(H116A), NVR1(H64A) and NVR1(H-doub). For gel source data, see Supplementary Fig. 1. e, Molecular structures of 2′,3′-cAMP, 2′,3′-cGMP and ApG>p. f, Extracted ion chromatogram comparison of NVR1 products with standards. The dinucleotide-2′,3′-cyclophosphate was produced from (UAGU)5 but was undetectable with (UGAU)5. rRNA, ribosomal RNA. g, Quantification of 2′,3′-cAMP/cGMP and ApG>P in rice leaves after 2 h of feeding by C. medinalis (Cm) third-instar larvae. FW, fresh weight. h, HPLC detection of 2′,3′-cAMP/cGMP and ApG>p produced in vitro by transfection with empty vector (EV) or wild-type or mutant NVR1. ND, not determined. i, Quantification of 2′,3′-cAMP/cGMP and ApG>p in N. benthamiana leaves 2 days post-expression of indicated protein (empty vector normalized to 1.0). j, Cell death in N. benthamiana leaves (3 dpi) induced by empty vector or wild-type or mutant NVR1. Colour-coded stacked bars display the percentages of each cell death score (0–5, n = 11 leaves). k, Hydrolysis of 100 μM 2′,3′-cAMP/cGMP and ApG>p by 1 μM active and boiled AtNUDT7 at 25 °C for 16 h. l, AtNUDT7 (322 amino acids) suppressed the NVR1-induced cell death in N. benthamiana leaves after co-expression for three days (scored as in j). m,n, Quantitative PCR with reverse transcription (RT–qPCR) of MYC2 and NPR1 in NVR1-OE (m) and NVR1H-doub-OE (n) lines compared with wild type (ZH11). Data in d,f are representative of three independent experiments. Data in g–i,k,m,n are mean ± s.d. of n = 3 biologically independent replicates (h,k) or samples (g,i,m,n). Statistical differences were determined by two-tailed t-test (g) or one-way ANOVA with Tukey’s test (h,i,k,m,n).
NVR1 generates 2′,3′-cNMP and ApG>p
NVR1 was predicted to have an N-terminal secretory signal peptide and no transmembrane region. Analysis using the protein family database (Pfam) revealed a ribonuclease (RNase) domain (Fig. 1b) that belongs to the RNaseT2 family11. NVR1 was detected both in N. viridula salivary glands and in infested rice plants, suggesting that it is secreted into plant tissues during feeding (Extended Data Fig. 1d). NVR1 exhibited a nucleocytoplasmic distribution pattern (Extended Data Fig. 1e).
H64 and H116 are conserved among T2 RNases from mammals, herbivorous insects, phytopathogenic fungi and plants (Fig. 1c and Extended Data Fig. 1f). NVR1 cleaved Cy5-labelled Arabidopsis tRNASer (83 nt) in vitro, whereas NVR1(H116A) and NVR1(H64A) mutants showed mild and strong reductions in substrate degradation, respectively, and the double mutant NVR1(H-doub) was almost completely inactivated (Fig. 1d), supporting H64 and H116 as key catalytic residues11. High-resolution mass spectrometry was subsequently used to identify products of the NVR1-catalysed reaction, which showed accumulation of 2′,3′-cAMP and 2′,3′-cGMP, as well as a dinucleotide-2′,3′-cyclophosphate with a mass-to-charge ratio (m/z) of 675.1072 in positive mode (Fig. 1e,f). Given that preferentially cleavage of single-stranded RNA between purines and uridines by RNaseT2 produces guanosine or adenosine 2′,3′-cyclophosphate termini2, we designed two oligoribonucleotides, (UAGU)5 and (UGAU)5, as substrates to determine the structure of the product. NVR1 exhibited activity towards (UAGU)5—but not towards (UGAU)5—generating a peak at 5.1 min in the extracted ion chromatogram mode that was identical to the dinucleotide-2′,3′-cyclophosphate peak at m/z 675.1072, suggesting that NVR1 produced 2′,3′-cGMP-terminated AMP (ApG>p). The ApG>p synthetic standard, eluting at 5.1 min with a m/z of 675.1072 in positive mode, aligns with the NVR1 product (Fig. 1f) and matches the tandem mass (MS2) spectrum (Extended Data Fig. 1g). The accumulation of 2′,3′- cAMP/cGMP and ApG>P was rapidly induced in rice leaves within 2 h after insect feeding (Fig. 1g).
The 2′,3′-cNMP and ApG>p synthase activity of NVR1 was dependent on the two catalytic histidines H64 and H116 (Fig. 1h). High-performance liquid chromatography (HPLC)–mass spectrometry and matrix-assisted laser desorption/ionization (MALDI) analysis showed that N. benthamiana leaves expressing empty vector or catalytic inactive NVR1 mutants accumulated much less 2′,3′-cAMP/cGMP and ApG>p than leaves expressing wild-type NVR1 (Fig. 1i and Extended Data Fig. 1h). Leaves expressing NVR1 mutants were impaired in inducing plant cell death (Fig. 1j and Extended Data Fig. 1i). AtNUDT7 hydrolysed 2′,3′-cAMP/cGMP and ApG>p (Fig. 1k). Co-expression with AtNUDT7 attenuated cell death activity of NVR1 in N. benthamiana at 3 dpi, with necrosis completed at 6 dpi (Fig. 1l and Extended Data Fig. 1j,k). These results indicate that the NVR1 enzymatic activity was causative to plant cell death.
NVR1 triggers plant defence response
To investigate plant responses to pest RNase, we generated rice NVR1-GFP transgenic plants that overexpress NVR1–GFP (Extended Data Fig. 2a,b). RNA-sequencing (RNA-seq) analysis revealed that genes associated with biotic stimulus, jasmonic acid and defence were significantly enriched in NVR1-expressing plants (Extended Data Fig. 2c). MYC2, NPR1, COI1 and ERF1 (Fig. 1m and Extended Data Fig. 2d) were upregulated and levels of jasmonic acid and salicylic acid levels increased (Extended Data Fig. 2e). The Cnaphalocrocis medinalis ribonuclease 1 (CMR1), an NVR1 orthologue expressed by Cnaphalocrocis medinalis—a lepidopteran pest of rice—was detected in oral secretions and also produced 2′,3′-cAMP/cGMP (Extended Data Fig. 2f,g), congruent with the rice leaf-feeding data (Fig. 1g). Given this functional conservation, we evaluated the resistance of NVR1 transgenic lines to C. medinalis. The larvae gained less weight on NVR1-expressing plants than on controls (Extended Data Fig. 2h). Adult females laid fewer eggs on NVR1 transgenic lines, and larvae preferred feeding on control plants (Extended Data Fig. 2i,j).
NVR1-expressing plants were stunted and produced fewer tillers, phenotypes associated with the growth cost of constitutive defence activation, whereas rice plants expressing catalytically inactive NVR1(H-doub) did not upregulate defence genes and grew normally (Fig. 1n and Extended Data Fig. 2k,l). These results demonstrate that heterologous expression of NVR1 in rice elicited defence responses and enhanced plant resistance to insect feeding, and that NVR1 catalytic activity is essential for immune activation.
NIB1 interacts with NVR1
To uncover the molecular mechanisms underpinning the NVR1-induced plant defence response, we screened plant proteins that could bind to NVR1 by immunoprecipitation and mass spectrometry (IP–MS). NVR1-interacting RNA-binding protein 1 (NIB1 (Os03t0670700-04), also known as OsGRP330,31) showed a strong interaction signal (Extended Data Fig. 3a,b). NIB1 is a GRP composed of an N-terminal RRM and a C-terminal GRR and shares 80% N-terminal sequence identity with AtGRP726,27 (Extended Data Fig. 3c). Microscale thermophoresis (MST) indicated that NIB1 interacted directly with NVR1 in vitro (Fig. 2a and Extended Data Fig. 3d), and co-immunoprecipitation confirmed the interaction in planta (Fig. 2b).
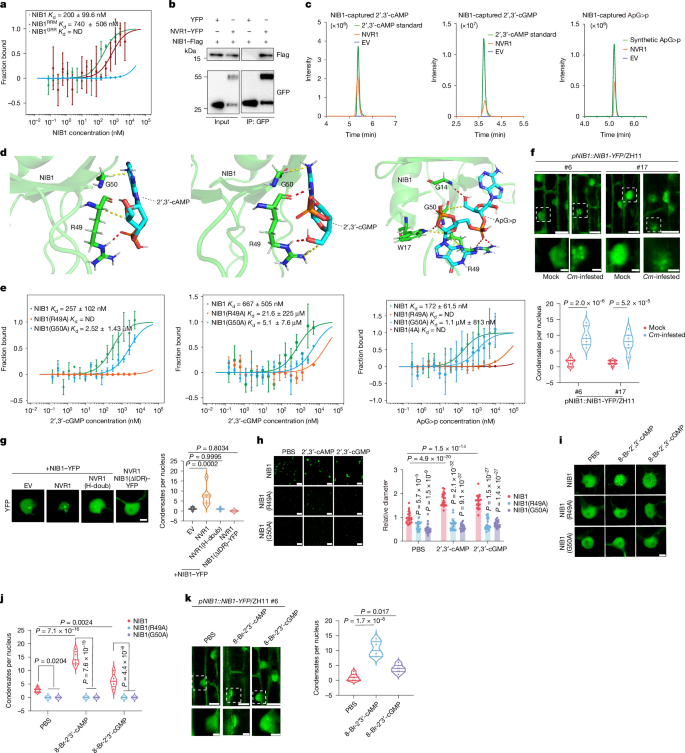
a, MST assay showing interaction of NHS–NVR1–Trigger factor (TF) with the RRM of NIB1 (NIB1RRM) in vitro. Kd is the dissociation constant. b, NVR1–YFP interacts with NIB1–Flag in a co-immunoprecipitation assay. For gel source data, see Supplementary Fig. 1. IP, immunoprecipitation. c, High-resolution mass spectrometry detection of NIB1-captured 2′,3′-cAMP/cGMP and ApG>p from NVR1-catalysed products following incubation with NIB1–GST (100 μg) for 1 h. TF-tagged empty vector served as negative control. d, Structural modelling of 2′,3′-cAMP/cGMP and ApG>p in NIB1. NIB1 binds 2′,3′-cAMP/cGMP via R49 and G50, and binds ApG>p via R49, G50, G14 and W17. e, MST assay showing 2′,3′-cAMP/cGMP and ApG>p binding by NIB1 and its mutants. f, NIB1–YFP condensates in the root elongation zone of independent T1 pNIB1::NIB1-YFP/ZH11 transgenic rice lines, following 6 h of feeding by third-instar C. medinalis larvae. Right, quantification of condensates per nucleus. g, Left, NVR1 promoted formation of NIB1-containing nuclear condensates in N. benthamiana leaves, photographed 48 hpi. Empty vector was used as control. Scale bars, 5 µm. Right, quantification of condensates per nucleus. h, Left, 2′,3′-cNMP (2 nM) induced phase separation of NIB1, but not binding mutants (20 μM each), in vitro. Right, relative droplet diameters (PBS was normalized to 1.0). Scale bars, 10 µm. i,j, Images (i) and quantification (j) of NIB1 nuclear condensates in N. benthamiana leaves following 2 h of treatment with 8-Br-2′,3′-cAMP/cGMP (50 μM). Scale bars, 5 µm. k, Left, NIB1–YFP condensates in the root elongation zone of the T1 pNIB1::NIB1-YFP/ZH11 rice line after 6 h of treatment with 50 µM 8-Br-2′,3′-cAMP or 8-Br-2′,3′-cGMP. Right, quantification of condensates per nucleus. Scale bars in f and k, 10 μm (top) and 3 μm (bottom). Data are mean ±s.d.; n = 3 biologically independent replicates (a,e), 7 nuclei (f,g,k), 20 droplets (h) or 5 nuclei (j). Statistical analyses used two-way ANOVA with Tukey’s post hoc test (f,h,j) or one-way ANOVA with Tukey’s multiple-comparisons test (g,k). Experiments in b,c were repeated independently three times with similar results.
Split luciferase complementation (SLC) showed that the NIB1 RRM, but not the GRR, interacted with NVR1 (Extended Data Fig. 3e), matching the MST data (Fig. 2a). AlphaFold2 predicted the RRM residue R22 as a contact site (Extended Data Fig. 3f), and the NIB1(R22A) mutant abolished the interaction in planta (Extended Data Fig. 3g). NVR1 interacted strongly with NIB1, independently of its catalytic activity (Extended Data Fig. 3h–j).
Given that NVR1-like secretory T2 ribonucleases are widespread in insects and phytopathogenic fungi (Extended Data Fig. 1f), and GRPs are conserved across land plants (Extended Data Fig. 3k), we investigated whether the RNaseT2–GRP interaction is a common phenomenon. We tested secreted RNases T2 from the insect pests C. medinalis (CMR1) and Helicoverpa armigera (HAR1) and the fungal pathogen Magnaporthe oryzae (MOR1). SLC assays demonstrated that the recognition of T2-family RNases by plant GRPs is universal (Extended Data Fig. 3l,m).
NIB1 binds 2′,3′-cAMP/cGMP and ApG>p
Given that GRPs bind RNA fragments27 and NVR1 requires its RNase activity to elicit defence, we investigated the potential binding of NIB1 to the RNaseT2 products. NIB1–GST was incubated with NVR1 products, denatured to extract the bound molecules, and analysed by high-resolution mass spectrometry. Notably, high-intensity signals of 2′,3′-cAMP/cGMP and ApG>p were observed (Fig. 2c). Structural modelling of NIB1 with ligands identified two adjoining residues in RRM domain loop, R49 and G50 that were responsible for 2′,3′-cAMP/cGMP recognition (Fig. 2d and Extended Data Fig. 4a). R49 is a known RNA-binding site27, whereas G50 contacts both 2′,3′-cAMP and 2′,3′-cGMP in our model. G14 and W17 serve as additional recognition sites for ApG>p (Fig. 2d and Extended Data Fig. 4a). In MST assays with 2′,3′-cAMP/cGMP and ApG>p, NHS-labelled NIB1 exhibited high binding affinity. Substitution of either residue with alanine (NIB1(R49A) or NIB1(G50A)) markedly reduced the binding affinity, and the NIB1(R49A/G50A/G14A/W17A) (hereafter NIB1(4A)) mutation fully abolished the ApG>p binding (Fig. 2e and Extended Data Fig. 3d). G14, W17, R49 and G50 are highly conserved in a group of GRPs across land plants (Extended Data Fig. 3n), implying a critical role of these residues in ligand recognition. The NIB1(R49A) mutation impaired NIB1 binding to both RNA and 2′,3-cyclic nucleotides, whereas the NIB1(G50A) mutant maintained binding affinity towards FLAGELLIN SENSITIVE2 (FLS2) 3′ untranslated region (UTR) while showing strongly impaired binding to 2′,3-cyclic nucleotides (Extended Data Fig. 4b). Thus, NIB1 employs shared yet distinct recognition mechanisms for 2′,3′-cAMP/cGMP and RNA.
In MST assays using 2′,3′-cAMP as a positive control, NIB1 did not bind 3′,5′-cAMP, 8-Br-3′,5′-cAMP, AMP or 2′,3′-cGAMP32 (Extended Data Fig. 4c–g). NIB1 exhibited 4-fold and 34-fold weaker binding affinities for 3′,5′-cGMP and GMP, respectively, compared with 2′,3′-cGMP (Fig. 2e and Extended Data Fig. 4h,i).
2′,3′-cNMP drives NIB1 phase separation
NIB1 contains a C-terminal intrinsically disordered region (IDR) (Extended Data Fig. 5a) that mediates phase separation33. PONDR predicted a high average disorder score similar to that of AtGRP7 (Extended Data Fig. 5b). In vitro, NIB1–YFP formed droplets that showed fluorescence recovery after photobleaching (FRAP) and fused to form larger droplets (Extended Data Fig. 5c–e). NIB1–YFP signals also recovered after photobleaching in N. benthamiana leaves (Extended Data Fig. 5f).
To determine whether herbivory induces NIB1 condensation in planta, we generated two pNIB1::NIB1-YFP/ZH11 rice lines (Extended Data Fig. 5g). Following 6 h of feeding by third-instar C. medinalis larvae, distinct NIB1 nuclear condensates were clearly visualized (Fig. 2f), indicating that this phase separation is a physiologically relevant response to herbivory. Similar to the observations in vitro and in N. benthamiana nuclei, NIB1–YFP condensates in pNIB1::NIB1-YFP/ZH11 nuclei recovered fluorescence after photobleaching (Extended Data Fig. 5h).
We further analysed the interplay between NVR1 catalytic activity and NIB1 condensation. Wild-type NIB1–YFP, but not the C-terminal IDR-truncated NIB1(ΔIDR)–YFP, absorbed NVR1–mCherry into the droplets (Extended Data Fig. 5i–k). The droplets of purified NIB1–YFP protein with nucleic acid contamination, but not that of nucleic acid-free NIB1–YFP, were enlarged in the presence of NVR1–mCherry, whereas the catalytically inactive NVR1(H-doub)–mCherry did not exert such effect (Extended Data Fig. 5i–k). NIB1–YFP exhibited nucleoplasmic localization, and NVR1 significantly enhanced its nuclear accumulation, with about 70% of the examined nuclei containing distinct condensates. N-terminal YFP-tagged NIB1 showed a similar localization pattern (Extended Data Fig. 5l–n). Immunoblotting further confirmed that NVR1 promoted nuclear accumulation of NIB1 (Extended Data Fig. 5o). Nuclear condensates were not observed for the NIB1–NVR1(H-doub) or NIB1(ΔIDR)–NVR1 (Fig. 2g), revealing that the RNase activity of NVR1 is crucial for promoting NIB1 phase separation in the nucleus. In subsequent analyses, we focused on nuclear NIB1 condensates.
Multivalent interactions drive phase separation and locally concentrate molecules, as in dsDNA-dependent cGAS activation and NAD+/ATP-dependent plant TIR activation32,34. We investigated whether 2′,3′-cNMP and ApG>p would induce NIB1 phase separation. The NIB1(R49A)–YFP and NIB1(G50A)–YFP droplets were smaller than NIB1–YFP droplets with or without NVR1–mCherry (Extended Data Fig. 6a). When co-expressed with NVR1 in N. benthamiana, NIB1(R49A), NIB1(G50A) and NIB1(4A) did not generate sparkling nuclear condensates (Extended Data Fig. 6b), implying that NIB1 phase separation involves binding of 2′,3′-cNMP and ApG>p. Congruently, 2′,3′-cNMP and ApG>p (2 nM each) promoted NIB1 phase separation in vitro (Fig. 2h and Extended Data Fig. 6c,d), and treatment with 8-Br-2′,3′-cNMP or ApG>p increased nuclear condensates in N. benthamiana cells (Fig. 2i,j and Extended Data Fig. 6e). Notably, exogenous application of 50 µM 8-Br-2′,3′-cNMP and ApG>p for 6 h induced distinct nuclear condensates in the pNIB1::NIB1-YFP/ZH11 rice plant (Fig. 2k and Extended Data Fig. 6f), indicating that 2′,3′-cNMP and ApG>p act as agonists of NIB1 in promoting phase separation.
We further monitored NIB1–YFP condensation in N. benthamiana leaves upon treatment with nucleotide analogues. Consistent with findings from MST (Extended Data Fig. 4c–g), 3′,5′-cAMP, 8-Br-3′,5′-cAMP, AMP and 2′3′-cGAMP did not trigger condensate formation, whereas 3′,5′-cGMP and GMP induced far fewer condensates than 2′,3′-cAMP (Extended Data Fig. 6g,h). Co-incubation with NVR1, rice plant RNA (OsRNA) and 2′,3′-cAMP resulted in larger NIB1–YFP droplets in vitro, which required the NVR1 catalytic activity, NIB1 binding sites and 2′,3′-cAMP to achieve optimal effect (Extended Data Fig. 6i). In vitro reconstitutions revealed that NIB1–YFP formed droplets, dependent on 2′,3′-cAMP, OsRNA and salt, as well as protein and macromolecular crowding agent concentrations (Extended Data Fig. 6j–m).
To investigate the biochemical consequences of NIB1 liquid–liquid phase separation, we examined its effect on NVR1 enzymatic activity. NVR1 was more active in the presence of NIB1, and the substrate degradation increased with higher concentrations of NIB1 (Fig. 3a). When the C-terminal IDR-containing fragment was deleted (NIB1(ΔIDR)), the influence of NIB1 on NVR1 activity was reduced or negligible (Fig. 3b), suggesting that the IDR steers NIB1 to boost the NVR1 enzymatic activity. Consistently, the NVR1–NIB1 complex synthesized a higher amount of 2′,3′-cAMP/cGMP and ApG>p than NVR1 alone, which also required the IDR in NIB1 for increased activity (Fig. 3c). Similarly, when co-expressed in N. benthamiana leaves, full-length NIB1 significantly enhanced NVR1 in generating 2′,3′-cNMP compared with NIB1(ΔIDR) (Extended Data Fig. 6n). We subsequently evaluated the effect of NIB1 on NVR1-induced cell death in N. benthamiana and found that removing the IDR from NIB1 largely abrogated its potentiation of NVR1-induced plant cell death (Extended Data Fig. 6o,p). Additionally, the NIB1(R49A) and NIB1(G50A) mutants also showed compromised acceleration of NVR1 catalysis (Fig. 3d) and the NVR1-induced plant cell death (Extended Data Fig. 6q,r). In sum, catalytically active NVR1 stimulates NIB1 phase separation, which in turn enhances NVR1 activity in degrading RNA and synthesizing 2′,3′-cAMP/cGMP and ApG>p, thereby inducing plant cell death through a positive feedback loop. In this mutual potentiation interaction, NIB1 uses both the IDR and the RNA-binding sites in the RRM to amplify and transduce NVR1-generated signalling molecules.
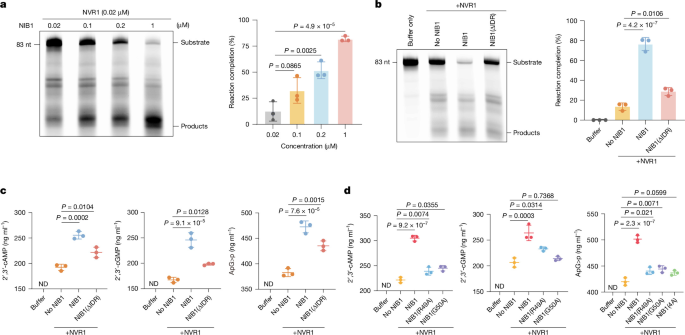
a, Left, degradation of Cy5–tRNA (2 μM) by NVR1 (0.02 μM) with increasing concentrations of NIB1. Right, reaction completion after 25 min, calculated as (intensity of hydrolysed RNA)/(intensity of undigested RNA) × 100%. For gel source data, see Supplementary Fig. 1. b, Left, NIB1 (1 μM), but not NIB1(ΔIDR), stimulated NVR1 activity in a 25-min assay. Right, quantification of band intensity. For gel source data, see Supplementary Fig. 1. c, 2′,3′-cAMP/cGMP and ApG>p produced by NVR1 (1 μM) after co-incubation with NIB1 or NIB1(ΔIDR) (1 μM) for 25 min. d, NIB1(R49A), NIB1(G50A) and NIB1(4A) (1 μM) activity in promoting the production of 2′,3′-cAMP/cGMP and ApG>p is compromised by NVR1 (1 μM), assayed for 25 min using rRNA as substrate (2 μg in 20 μl). In a–d, data are mean ± s.d. of n = 3 biologically independent replicates. Statistical differences were determined by one-way ANOVA with Tukey’s multiple-comparisons test.
NIB1 activates the plant defence response
NIB1 is highly expressed in multiple rice tissues (Extended Data Fig. 7a). To investigate the NIB1 function in plant defence, we used CRISPR–Cas9 to generate NIB1-knockout (NIB1-KO) and NIB1-overexpression (NIB1-OE) rice lines (Fig. 4a and Extended Data Fig. 7b–d). NIB1-OE and NVR1-OE plants showed similar transcriptional changes, with 553 (59%) of the upregulated genes overlapping (Fig. 4b), including genes associated with response to biotic stimulus, jasmonic acid and defence (Fig. 4c). MYC2, NPR1, COI1 and ERF1 were downregulated in NIB1-KO plants but markedly upregulated in NIB1-OE plants (Extended Data Fig. 7e), consistent with the RNA-seq data and the levels of defence hormones salicylic acid and jasmonic acid (Fig. 4d). C. medinalis larvae gained more weight after feeding on the NIB1-KO lines than with the wild-type plants; by contrast, their growth was retarded on the NIB1-OE plants (Fig. 4e). Females and larvae preferred NIB1-KO over wild-type and NIB1-OE plants in oviposition and feeding-choice assays (Extended Data Fig. 7f,g). Insect feeding strongly induced MYC2 in wild-type rice, but the induction was much weaker in the NIB1-KO mutant (Fig. 4f). NIB1-OE plants had reduced tillering, partly resembling the NVR1-OE phenotype (Extended Data Fig. 2l), whereas NIB1-KO plants grew well and produced more tillers (Fig. 4a and Extended Data Fig. 7h), probably reflecting their differences in immune intensity. These results suggest that NIB1 positively regulates plant defence responses.
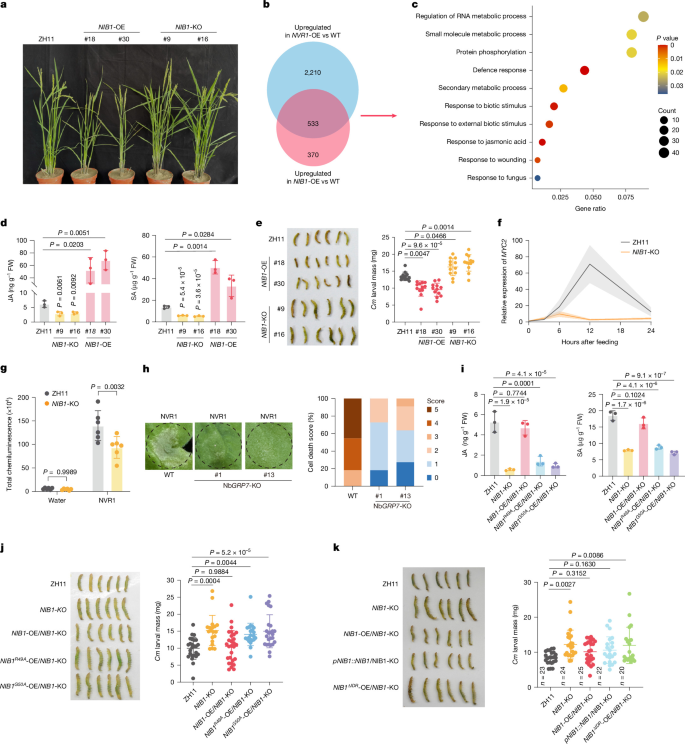
a, Representative plants of ZH11, NIB1-KO and NIB1-OE lines. b, Venn diagram showing overlap of genes that are upregulated in NVR1-OE and NIB1-OE rice leaves. WT, wild type. c, Gene ontology (GO) analysis of the upregulated genes common to NIB1-OE and NVR1-OE rice. P < 0.05. d, Jasmonic acid (JA) and salicylic acid (SA) contents in ZH11, NIB1-KO and NIB1-OE leaves, detected using HPLC. e, Weights (right) of C. medinalis third-instar larvae fed on the 12-day old rice plants for 3 days (left). f, MYC2 expression increased markedly in ZH11 leaves but weakly in NIB1-KO leaves during feeding by C. medinalis third-instar larvae. g, NVR1 (1 μM) treatment triggered a lower-intensity ROS burst in NIB1-KO rice leaves in 30-min assays, compared with wild-type ZH11 leaves. h, Right, NVR1-induced cell death was compromised in NbGRP7-KO leaves (3 dpi). Right, colour-coded stacked bars display the percentages of each cell death score (0–5; n = 11 leaves). i, Jasmonic acid and salicylic acid contents in ZH11, NIB1-KO and NIB1-KO leaves expressing NIB1, NIB1R49A or NIB1G50A in 12-day old rice plants. j, 2′,3′-cNMP binding mutations impaired NIB1-mediated resistance to insect feeding. Twelve-day-old rice plants were inoculated with C. medinalis third-instar larvae for three days. k, Overexpression of NIB1(ΔIDR) did not restore the compromised insect resistance in NIB1-KO plants. Third-instar larvae were weighed after placing on the rice plants for three days. Data are mean ± s.d. Sample sizes: n = 3 biologically independent samples (d,i); n = 12 (e) and n = 19 (j) larvae; n = 6 (g). Statistical differences were determined by two-way ANOVA with Tukey’s post hoc test (g), one-way ANOVA with Tukey’s (d,e,i,j) or Dunnett’s (k) multiple-comparisons test.
We next investigated whether the NVR1-induced plant defence responses were contingent on the presence of NIB1. Treatment of rice plants with purified NVR1 induced ROS production, which was attenuated in NIB1-KO lines (Fig. 4g). Consistently, NVR1-induced cell death was mitigated in NbGRP7-KO leaves compared with wild-type N. benthamiana (Fig. 4h and Extended Data Fig. 7i,j). Thus, the RNA-binding protein NIB1 mediates NVR1-dependent induction of plant defence response.
To further determine whether NIB1 senses 2′,3′-cNMP and ApG>p to mediate NVR1-induced immune activation, we generated overexpression complementation lines in NIB1-KO rice plants, including wild-type NIB1, NIB1R49A and NIB1G50A. The two recognition-deficient complementation lines were unable to rescue the immune responses in NIB1-KO mutants, as indicated by defence hormone accumulation (Fig. 4i), insect resistance (Fig. 4j and Extended Data Fig. 8a,b) and the expression of MYC2, COI1 and NPR1 (Extended Data Fig. 8c). Expression of NIB1R49A and NIB1G50A in wild-type rice plants did not lead to a clear upregulation of these defence genes (Extended Data Fig. 8d,e). Together, these results show that NIB1 activates plant defence against insect feeding and that sensing of 2′,3′-cNMP and ApG>p is crucial for this immune function of NIB1.
MST assays with NIB1(ΔIDR) exhibited similar binding affinity to 2′,3′-cAMP/cGMP and ApG>P as wild-type NIB1 (Fig. 2e and Extended Data Fig. 8f). However, overexpression of NIB1(ΔIDR)–YFP in NIB1-KO rice plants did not rescue the compromised insect resistance (Fig. 4k). Moreover, treatment with 50 µM 8-Br-2′,3′-cAMP induced condensate formation in pNIB1::NIB1-YFP/NIB1-KO plants but not in 35S::NIB1ΔIDR-YFP/NIB1-KO plants (Extended Data Fig. 8g,h). Thus, both ligand recognition via RRM and subsequent phase separation via IDR are essential for the NIB1-dependent defence response.
NIB1 interacts with the immune protein EDS1
To connect the NVR1–NIB1 module to the plant defence network, we performed IP–MS on leaves co-expressing NIB1–YFP and NVR1. EDS1, CDPK and MAPK6 were identified as NIB1 interactors (Extended Data Fig. 9a). Comparison with the NVR1 interactome revealed that the shared components were enriched in herbivore-response pathways (Extended Data Fig. 9b).
EDS1 is a central immune signalling node35,36,37. In SLC assays, NIB1 interacted with rice EDS1 (Extended Data Fig. 9c). EDS1–YFP co-immunoprecipitated with NIB1–Flag in N. benthamiana (Fig. 5a), and His–NIB1 pulled down EDS1–Flag from N. benthamiana leaves (Extended Data Fig. 9d). Bimolecular fluorescence complementation (BiFC) assays showed that NIB1 interacted with EDS1 in the nucleus (Extended Data Fig. 9e), and the NIB1–EDS1 interaction was enhanced by NVR1 via its RNase activity (Fig. 5b). Catalytically active NVR1, but not the inactive NVR1(H-doub) mutant, stimulated NIB1 recruitment of EDS1 into sparkly nuclear condensates (Fig. 5c and Extended Data Fig. 9f). We then used EDS1–NES–mCherry to test whether EDS1 acts as a nuclear carrier for NIB1. When EDS1–NES–mCherry was largely retained in the cytosol, NIB1 continued to form nuclear condensates in the presence of NVR1 (Extended Data Fig. 9g), indicating that NIB1 nuclear condensation is independent of EDS1 and supporting the role of NIB1 as a scaffold for EDS1 recruitment.

a, Co-immunoprecipitation of NIB1 with EDS1 in N. benthamiana. For gel source data, see Supplementary Fig. 1. b, Left, BiFC assay showing that active NVR1, but not the inactive NVR1(H-doub) mutant, enhanced nuclear NIB1–EDS1 interaction. Right, relative nuclear fluorescence (empty vector was normalized to 1.0). c, Left, active NVR1 promoted recruitment of EDS1 into NIB1 nuclear condensates in N. benthamiana. Middle, number of condensates per nucleus. Right, NIB1 and EDS1 partition coefficients with empty vector, NVR1 or NVR1(H-doub). mCh, mCherry. d, Salicylic acid and jasmonic acid contents in ZH11 and eds1 leaves. e, MYC2 expression in CR-eds1 leaves with or without 6 h of C. medinalis feeding (ZH11 set to 1). f, Decreased resistance in eds1 plants, evaluated by C. medinalis larvae weight after 3 days of feeding. g, RT–qPCR of PR1 and MYC2 in ZH11 leaves, NIB1-OE ZH11 leaves and NIB1-OE CR-eds1 leaves. h, PR1 and MYC2 expression in wild-type, NIB1-KO and CR-eds1 leaves 6 h after treatment with water, 8-Br-2′,3′-cAMP/cGMP, ApG>p or 8-Br-AMP (50 μM each). i, NbPR1 and NbMYC2 expression in wild-type, NbGRP7 and epss leaves 6 h after treatment with water or 8-Br-2′,3′-cAMP. j,k, Spraying 50 μM 8-Br-2′,3′-cAMP enhanced plant insect resistance in the laboratory (j) and the paddy field (k), as indicated by growth of C. medinalis third-instar larvae fed with water- or 8-Br-2′,3′-cAMP-treated ZH11 plants. l, A proposed model of GRP in the plant defence response to insect oral secretory RNaseT2. Data are mean ± s.d. n = 3 biologically independent samples (d,e,g–i); n = 6 (b) or 8 (c, middle) nuclei; n = 20 condensates (c, right); n = 11 (f) or 12 (j,k) larvae. Results in a represent three independent experiments; experiments in j,k were repeated twice. Statistical differences were analysed by two-tailed t-test (d–f,j,k); one-way ANOVA with Tukey’s multiple-comparisons test (b,c,g); or two-way ANOVA with the two-stage linear step-up procedure of Benjamini, Krieger and Yekutieli (h,i). Scale bars, 10 μm (b) and 5 μm (c).
The rice CR-eds1 mutant generated by CRISPR–Cas9 accumulated lower levels of jasmonic acid and salicylic acid (Fig. 5d) and expressed lower levels of COI1, NPR1 and ERF1 (Extended Data Fig. 9h–j). The induction of MYC2 expression in response to insect feeding was minimal in the rice CR-eds1 mutant (Fig. 5e). CR-eds1 plants were more vulnerable to C. medinalis (Fig. 5f and Extended Data Fig. 9k,l), demonstrating a vital role of rice EDS1 in insect resistance.
The immune activation phenotype of NIB1 overexpression was highly attenuated in the rice eds1-KO mutant and NIB1-triggered induction of defence genes PR1, MYC2, COI1, NPR1 and ERF1 was diminished in CR-eds1 rice plants (Fig. 5g and Extended Data Fig. 9m,n). Treatment with 8-Br-2′,3′-cAMP/cGMP and ApG>p induced the expression of PR1 and MYC2 in rice leaves, but this induction was compromised in NIB1-KO and CR-eds1 plants (Fig. 5h). Similarly, 8-Br-2′,3′-cAMP treatment upregulated NbPR1 and NbMYC2 expression in wild-type N. benthamiana but not in NbGRP7-KO or N. benthamiana epss (eds1a, pad4, sag101a, sag101b) mutants (Fig. 5i). RNA-seq analyses of N. benthamiana wild-type, NbGRP7-KO and N. benthamiana epss leaves treated with 8-Br-2′,3′-cAMP showed that the differential gene expression observed in wild-type N. benthamiana was largely absent in NbGRP7-KO and N. benthamiana epss mutants (Extended Data Fig. 9o,p). The upregulated genes were predominantly enriched in defence pathways (Extended Data Fig. 9q). These data demonstrate that EDS1 and NIB1 are important signalling components for the immune function of 2′,3′-cAMP.
Herbivore-induced endogenous 2′,3′-cAMP concentration reached around 21 μM in rice (Fig. 1g), comparable to the 50 μM concentration used in our assays. Treating N. benthamiana leaves with 21 μM 8-Br-2′,3′-cAMP for 6 h upregulated NbPR1 and NbMYC2 to similar levels as the 50 µM 2′,3′-cAMP treatment. Thus, the herbivore-induced endogenous accumulation of 2′,3′-cAMP is physiologically sufficient to elicit defence responses (Extended Data Fig. 9r). Exogenous application of 50 μM 8-Br-2′,3′-cAMP via spray significantly enhanced plant resistance against herbivory under both laboratory and paddy field conditions (Fig. 5j,k and Extended Data Fig. 9s).
Given that plant TIR proteins function as 2′,3′-cAMP/cGMP synthases3, we tested whether the TIR-induced immunity also involves NIB1 or the orthologous GRP by expressing the TIR domain of Arabidopsis RPS4 (RPS4TIR) in NbGRP7-KO lines. Arabidopsis RPS4TIR-induced cell death in NbGRP7-KO leaves showed slight attenuation at 36 h post-infiltration (hpi) but became obvious and complete by 56 hpi (Extended Data Fig. 10a–c). The cell death triggered by the rice TIR-only protein OsTIR was also slightly attenuated in the NbGRP7/NbGRP8-KO mutants when observed at 40 hpi (Extended Data Fig. 10d–g), with obvious cell death and completion at 68 hpi (Extended Data Fig. 10h). These results suggested a general role of GRP in sensing the 2′,3′-cyclophosphate-terminated mono- and dinucleotides. In sum, our results show that GRPs sense the nuclease products of 2′,3′-cAMP/cGMP and ApG>p, contributing to the activation of the EDS1-dependent signalling pathway (Fig. 5l).
Discussion
Plants express many cell-surface and intracellular immune receptors to perceive alien molecules and activate defence38,39. Here we found that the rice GRP NIB1 interacts with invading RNaseT2 and senses 2′,3′-cAMP/cGMP and ApG>p to induce plant defence. The presence of NVR1 orthologues in oral secretions of the piercing-sucking pest Apolygus lucorum (ALR1; data not shown) and chewing insect C. medinalis suggests that T2-family ribonuclease effectors are conserved across divergent feeding types and may be a broadly deployed strategy in plant–insect interactions. Given the involvement of 2′,3′-cAMP/cGMP in abiotic stresses40,41,42,43, it is worth further investigating the role of GRPs in leveraging biotic and abiotic stresses. Whether and how plants discriminate between different sources of second messengers are also important questions to address.
Condensates or membraneless compartments are engaged in a variety of plant developmental and stress response processes44,45,46,47. NIB1, as a sensor, perceives 2′,3′-cAMP/cGMP and ApG>p and forms nuclear condensates that recruit the core immune regulator EDS135,36,37 and activate downstream signalling pathways, highlighting protein phase separation as a mechanism in response to second messengers. Our study focuses on the immune function of nuclear NIB1, whereas the biological roles of its cytoplasmic condensates deserve future investigation. Exogenous spraying of these RNA degradation-derived signalling molecules triggered plant defence responses, highlighting their application potential as immune activators. Our study opens a door for exploring the engagement of RNase products in plant defence, adaptation and development.
Plant TIR-catalysed and NAD+-derived products induces formation of EDS1–SAG101–NRG1 and EDS1–PAD4–ADR1 heterotrimers, as well as oligomerization of ADR1 and NRG1 as calcium channels at the plasma membrane, to confer immunity. The link between TIR nuclease-derived 2′,3′-cAMP/cGMP and EDS1 remains unclear, and the nuclear function of EDS1 in TIR-mediated immunity is unknown. Our unpublished data show that 2′,3′-cAMP/cGMP does not contribute to the EDS1–SAG101–NRG1 or EDS1–PAD4–ADR1 heterotrimer formation, consistent with the proposed role of 2′,3′-cAMP/cGMP in amplifying rather than initiating TIR signalling3. In bacteria, 2′,3′-cAMP/cGMP have been shown to modulate activities of transcription factors48. 2′,3′-cAMP/cGMP-induced NIB1 condensate in the nucleus recruits EDS1 to trigger defence, potentially via transcriptional modulation, providing a possible explanation for the biological relevance of plant TIR nuclease activity. Plant TIR-only proteins but not TIR–NLR receptors possess nuclease activity—thus, TIR nuclease activity and 2′,3′-cAMP/cGMP are likely to be involved in TIR-only-mediated basal immunity but not TIR–NLR-mediated effector-triggered immunity3,49, consistent with the weak contribution of GRPs towards TIR-induced cell death phenotypes in N. benthamiana. The T2 RNase NVR1 produces ApG>p, and the nuclease product spectrum of plant TIR-only proteins awaits further studies. Future studies could investigate whether other GRPs are also involved in perceiving such nuclease products and their interactions. Detailed analyses of NIB1 condensate components will add valuable knowledge to understanding this nuclease-based defence pathway.
Phytophagous insects, especially mesophyll feeders, generate various small molecules from biopolymers by injecting digestive enzymes into plant tissues, in addition to mechanical injury. Detection of DAMPs is essential for plants to activate defence programmes. Although the wide-scale cultivation of transgenic crops expressing Bacillus thuringiensis insecticidal proteins has effectively controlled the lepidopteran chewing insects in the field, heteropteran mesophyll feeders such as the mirid bug A. lucorum (Miridae) and the green stink bug N. viridula (Pentatomidae), are less sensitive to these proteins and are emerging as a threat to agriculture50. Our findings show that plant GRP is a sensor of the invading RNase products and orchestrates immune responses to activate an EDS1-dependent signalling pathway, providing a potential target for advanced plant protection technologies.
Methods
Plant materials and growth conditions
Rice plants (Oryza sativa L. subsp. japonica cv. ZH11) grown in experimental fields in Shanghai or Hainan, or under controlled greenhouse conditions, were used for stable transformation and CRISPR–Cas9-mediated gene knockout. To generate overexpression lines, the cDNAs of NVR1 and NIB1 (transcript ID: Os03t0670700-04) were introduced into the pCAMBIA1300 vector under the control of the CaMV 35S promoter, or as indicated. DNA sequences were analysed using SnapGene 6.0.2. Following transformation, more than ten independent overexpression lines were obtained for both NVR1 and NIB1. The NIB1-KO rice mutants, as well as N. benthamiana NbGRP7-KO plants, were generated by WIMI Biotechnology. NbGRP7/NbGRP8-KO lines were generated by Wuhan BioRun Biosciences. For transient expression assays, leaves from 4-week-old N. benthamiana plants grown in a greenhouse at 22 °C under long-day conditions (16 h light:8 h dark) with a photosynthetic photon flux density (PPFD) of 112.81 μmol m−2 s−1.
Insects
N. viridula was collected from the Hangzhou farm, Zhejiang Academy of Agricultural Sciences, and reared on kidney beans and corn in a growth chamber at ~28 °C. C. medinalis was at first collected from the experimental farm in Songjiang, Shanghai, China in 2022. To maintain genetic homogeneity and sensitivity, the insects were continuously laboratory-reared for more than 15 generations without pesticide exposure. Larvae were reared on fresh wheat seedlings, and adults were supplied with a 15% honey solution. The colony was maintained under strictly controlled conditions at 26 °C with 12 h light:12 h dark photoperiod.
Identification of N. viridula oral secretion proteins
N. viridula saliva was collected using a Parafilm sachet feeding assay. Following a 24-h starvation period, 20 adult N. viridula were supplied with 1 ml of 2.5% sucrose solution encapsulated within Parafilm membranes. After 24 h of feeding, the saliva-containing sucrose solution was collected and concentrated using Amicon Ultra-0.5 centrifugal filter devices (Millipore). Salivary proteins were mixed with 4× SDS loading buffer, denatured at 95 °C for 10 min, and separated by SDS–PAGE. The salivary proteome was subsequently analysed via LC–MS/MS (Novogene) (Supplementary Table 1).
Agrobacterium-mediated transient expression in N. benthamiana
The constructed vectors were introduced into A. tumefaciens strain GV3101 (pSoup-p19). After cultivation in medium at 30 °C overnight, the bacteria were collected and resuspended in infiltration buffer (10 mM MgCl2, 10 mM MES, 150 μM acetosyringone, pH 5.8), and incubated at room temperature for 2–3 h. The bacterial suspensions were adjusted to OD600 = 0.6 and infiltrated to the leaves of 4-week N. benthamiana with needleless syringe. For co-expression, equal volumes of Agrobacterium suspensions (adjusted to an OD600 of 1.0) carrying the respective constructs were mixed for co-infiltration.
Recombinant protein expression and purification
The protein coding sequences for His- and GST-tagged proteins were cloned into pColdTF/pET-28a and pGEX-4T vectors, respectively, and expressed in Escherichia coli BL21 (DE3) pLysS cells. Cultures were grown in LB medium at 37 °C to OD600 of 0.5, followed by induction with 0.5 mM IPTG at 15 °C for 16 h. Cells were collected, lysed by sonification in lysis buffer (50 mM Tris-HCl, 300 mM NaCl, pH 8.0) and centrifuged at 20,000g for 30 min at 4 °C. For His-tagged proteins, the supernatant was loaded onto Ni-NTA resin, washed with a wash buffer (50 mM Tris-HCl, 300 mM NaCl, 10 mM imidazole, pH 8.0), and subsequently eluted with an elution buffer (50 mM Tris-HCl, 300 mM NaCl, 500 mM imidazole, pH 8.0). For the purification of GST-tagged proteins, the supernatant was incubated with Glutathione Sepharose 4B resin, washed with lysis buffer (140 mM NaCl, 27 mM KCl, 10 mM Na2HPO4, 1.8 mM KH2PO4), and eluted with the same buffer supplemented with 10 mM reduced glutathione. To obtain nucleic acid-free NIB1–YFP, recombinant protein-expressing E. coli cells were collected and resuspended in cold TBS (20 mM Tris-HCl, 150 mM NaCl, pH 7.6) at 9 ml per gram of wet cells. TieChui E. coli Lysis Buffer (ACE Biotechnology) was added at one-ninth of the suspension volume, followed by incubation at 4 °C for 10 min to lyse the cells and digest bacterial DNA and RNA. After centrifugation at 20,000g at 4 °C, the clarified supernatant was subjected to affinity purification.
Split luciferase complementation assay
To investigate potential protein–protein interactions, coding sequences were cloned into JW772-35S-cLUC or JW771-35S-nLUC. The constructs were introduced into Agrobacterium GV3101 (pSoup-p19), and the bacterial cultures were co-infiltrated into N. benthamiana leaves as described above. After 48 h of transformation, fluorescence was detected and imaged using the Tanon Chemi Dog 5200T Imaging System to visualize protein interactions.
Co-immunoprecipitation and immunoblotting analyses
The interacting protein candidates were co-expressed in N. benthamiana leaves for 48 h. The leaves were collected, homogenized in liquid nitrogen and suspended in IP lysis buffer (50 mM Tris-HCl, 150 mM NaCl, 20% glycerol, 0.5% NP-40, 1×protease inhibitor cocktail). The mixture was centrifuged at 14,000g for 10 min. The supernatant was incubated with GFP magnetic beads for 2 h at 4 °C and then washed 5 times in IP lysis buffer. Beads were boiled at 95 °C in 50 μl 4× SDS loading buffer for 10 min and analysed by immunoblotting. Measurements were repeatedly taken from separate lysates to confirm repeatability.
For immunoblotting, proteins were separated by 4–20% SDS–PAGE and transferred onto polyvinylidene difluoride (PVDF) membranes. After blocking with 5% (w/v) non-fat milk, the membranes were incubated with the following primary antibodies: mouse anti-DDK (Flag) monoclonal antibody (ZSGB-BIO, TA-05, clone OTI11C3, lot no. 230021225; 1:2,000), mouse anti-His monoclonal antibody (OriGene, TA150088, clone OTI2B5; 1:5,000), mouse anti-plant actin monoclonal antibody (ABclonal, AC009, clone AMC0496, lot no. 9100009001; 1:5,000), horseradish peroxidase (HRP)-conjugated rabbit anti-Myc-tag monoclonal antibody (ABclonal, AE102, clone ARC5004-12-HRP, lot no. 3523030201; 1:5,000), rabbit anti-GFP-tag polyclonal antibody (ABclonal, AE011, clone N/A, lot no. 3560104011, RRID: AB_2771922; 1:2,000), rabbit anti-β-actin monoclonal antibody (ABclonal, AC026, clone ARC5115-01; 1:10,000), rabbit anti-histone H3 monoclonal antibody (HUABIO, ET1701-64, clone JJ090-07, lot no. H641565025; 1:5,000), rabbit anti-PEPC polyclonal antibody (Agrisera, AS09 458, lot no. 2410; 1:2,000), or a custom rabbit anti-NVR1 polyclonal antibody generated for this study by ABclonal Technology (1:500). For unconjugated primary antibodies, the membranes were subsequently incubated, as appropriate, with HRP-conjugated goat anti-mouse IgG (H+L) (ZSGB-BIO, ZB-2305, lot no. 219760308; 1:10,000) or HRP-conjugated goat anti-rabbit IgG (H+L) (ZSGB-BIO, ZB-2301, lot no. 242521208; 1:10,000). Chemiluminescent signals were detected using ECL reagents and imaged with a Tanon 5200T Imaging System.
Immunoprecipitation and mass spectrometry analysis
The YFP-tagged protein was immunoprecipitated using GFP magnetic beads at 4 °C for 2 h. After washing the beads 5 times with IP lysis buffer, the bead-bound proteins were treated with 10 mM TCEP and 50 mM CAA (in 50 mM ammonium bicarbonate) at 95 °C for 10 min.
Samples were prepared via a filter-aided sample preparation method using Vivacon 500 filters (10,000 MWCO; Sartorius), sequentially washed with 8 M urea and 50 mM ammonium bicarbonate, and digested overnight with 1 μg of trypsin (Promega). Following desalting with Pierce C18 Spin Tips (Thermo Fisher Scientific), peptides were dried by centrifugation at 10 °C, reconstituted in 0.1% formic acid, and subjected to LC–MS/MS analysis.
LC–MS/MS analysis was performed using a timsTOF Pro 2 mass spectrometer coupled to a nanoElute liquid chromatography system (Bruker Daltonics). In brief, 200 ng of peptides were separated on a reversed-phase analytical column (25 cm × 75 µm internal diameter, IonOpticks) over a 60-min gradient at a flow rate of 300 nl min−1 and a column temperature of 50 °C. The mobile phases consisted of buffer A (0.1% formic acid in water) and buffer B (0.1% formic acid in acetonitrile). The gradient elution profile was set as follows: an increase to 22% buffer B from 0 to 45 min, up to 37% buffer B from 45 to 50 min, and a final step at 80% buffer B from 50 to 60 min. The mass spectrometer was operated in DDA-PASEF mode with the following parameters: capillary voltage, 1,500 V; dry gas flow, 3.0 l min−1; and drying temperature, 180 °C. The collision energy was linearly ramped as a function of ion mobility.
The raw LC–MS/MS data were searched against the N. benthamiana protein sequence database (Nbe_v1.1_pep.fa.gz), downloaded from NbenBase (https://nbenthamiana.jp/downloads), using MSFragger within FragPipe v22.0. Trypsin was specified as the digestion enzyme, allowing up to two missed cleavages. Precursor and fragment ion mass tolerances were set to 10 ppm and 0.02 Da, respectively. Carbamidomethylation of cysteine (+57.021 Da) was set as a fixed modification, whereas methionine oxidation (+15.995 Da) was included as a variable modification. Peptide and protein identifications were filtered to a 1% false discovery rate using a target-decoy strategy (Supplementary Tables 3, 6 and 7).
Semi-in vivo pull-down assay
His–TF and His–TF–NIB1 were incubated with 15 μl of Ni-NTA resin for 1 h at 4 °C. Protein extracts from leaves expressing EDS1–Flag were added to each resin and incubated overnight at 4 °C. The resin was washed 6 times with IP lysis buffer, resuspended in 50 μl of 4× SDS loading buffer and heated at 95 °C for 10 min. Bound proteins were analysed by immunoblotting.
Bimolecular fluorescence complementation
Target coding sequences were cloned into pCAMBIA1300S-cYFP or pCAMBIA1300S-nYFP. Following co-expression of the fusion proteins in N. benthamiana leaves for 2 days, YFP signals were acquired by 20× water immersion objective through Leica TCS SP8 STED 3X.
Microscale thermophoresis assay
MST was used to determine the protein–protein interactions and the binding affinities of NIB1 and its mutated versions to the indicated small molecules or RNA, protein labelling was performed in strict accordance with the manufacturer’s protocol. In brief, the purified recombinant proteins (NIB1–GST, NIB1(R49A)–GST, NIB1(G50A)–GST and NIB1(4A)–GST) at a concentration of 10 μM were labelled with NT–647–NHS using the Monolith Protein Labeling Kit RED-NHS 2nd Generation (NanoTemper Technologies). The labelled NIB1–GST and its mutants were adjusted to 50 nM in PBST buffer (PBS, with 0.05% Tween-20) and 2′,3′-cAMP/cGMP and ApG>p (5 μM to 0.000153 μM) were added separately. For characterizing the interaction between NVR1 and NIB1 (NIB1RRM and NIB1GRR), 10 μM NVR1–TF was labelled and adjusted to 40 nM in PBST buffer. Subsequently, NIB1–GST, NIB1RRM–GST and NIB1GRR–GST (2.5 μM to 0.0000763 μM) were added separately. For protein–RNA interaction, the Cy5-labelled FLS2 3′-UTR served as the target and adjusted to 20 nM. NIB1–GST and the mutant fusions (10 μM to 0.000306 μM) were incubated with target. To access the interaction between NIB1(ΔIDR) and 2′,3′-cAMP/cGMP and ApG>P, the labelled NIB1(ΔIDR) was used as target and adjusted to 50 nM. The target protein was independently mixed with 2′,3′-cAMP/cGMP and ApG>P (10 μM to 0.000306 μM). Furthermore, to test the binding affinity of NIB1–GST with 3′,5′-cAMP, 3′,5′-cGMP, 8-Br-3′,5′-cAMP, AMP, GMP and the unrelated cyclic dinucleotides 2′,3′-cGAMP, 50 nM labelled NIB1–GST was used as target and independently mixed with the indicated compounds (15 μM to 0.000458 μM). A Microscale Thermophoresis Monolith NT.115 instrument (NanoTemper Technologies). was used to measure binding reactions at 25 °C, 40% MST power and 20% LED power. Measurements were repeatedly taken repeatedly from separate protein preparations to confirm repeatability. The curve was fitted using the MO.AffinityAnalysis_x86_2.3.0.7385, and the dissociation constant (Kd) value was determined.
In vitro and in vivo phase separation assays
NIB1–YFP fusion protein and its various mutants were purified by Ni-NTA resin. NIB1–YFP droplets with 10% PEG 8000, or as specifically indicated, were observed by Leica TSC SP8 STED 3× 100× oil immersion objective. The droplets were bleached by 100% intensity 488 nm laser and the recovery was recorded every 3 s 290 ms for 50 frames in FRAP. Fusion of NIB1 droplets was recorded through time-lapse photography. Droplet diameters were measured from microscopy images using Fiji (ImageJ, version 1.54f).
Target proteins fused with fluorescent protein (YFP or mCherry) were co-expressed in N. benthamiana leaves. Condensates in leaves were observed by Leica TSC SP8 STED 3X (Leica) 40 × oil immersion objective. To prevent fluorescence bleed-through during imaging, all images were acquired using the sequential scanning mode on a Leica TCS SP8 confocal microscope. YFP was excited with a 488 nm laser and detected at 498–540 nm, and mCherry was independently excited with a 561 nm laser and detected at 600–630 nm. The images of condensates were analysed using Fiji (ImageJ, version 1.54f). Line profile analysis was performed to evaluate co-localization of the proteins. To quantify the partition coefficient of the EDS1–mCherry into NIB1–YFP condensates with or without NVR1, regions of interest of equivalent size were analysed. The partition coefficient (Kp) was defined as the ratio of intracondensate EDS1 fluorescence intensity to that of the extracondensate background.
RNase activity assay
The Cy5-labelled AttRNAser (83 nt) used as substrate for NVR1 digestion was obtained through in vitro transcription using T7 RiboMAX Express RNAi System. A reaction mixture containing 0.5 mM Cy5-UTP and 1 mM synthesized AttRNAser DNA template (sequence listed in Supplementary Table 13) were incubated at 37 °C for 30 min. The template DNAs were then removed by 0.5 μl RNase-Free DNase (Promega) at 37 °C for 30 min. In the RNase activity assay, 2 μM Cy5-AttRNAser was incubated with 0.02 μM NVR1 in buffer containing 20 mM Tris-HCl, pH 7.5, 5 mM NaCl, 5 mM MgCl2, 1 mM ATP, 0.5 μl RNase Inhibitor at 25 °C for 20 min. The reaction was stopped by 400 μl stop solution (40 mM Tris-HCl pH 7.5 and 500 mM NaCl). Then RNAs were purified with PCIA solution (phenol:chloroform:isopentyl alcohol, 25:24:1) and the RNA pellet was resuspended in 1× TBE urea loading buffer. The RNA was then separated using 16% urea polyacrylamide gels at 150 V for 90 min and subsequently detected with a Amersham Typhoon 5.
In vitro transcription of Cy5-labelled FLS2 3′-UTR
Cy5-labelled FLS2 3′-UTR were synthesized in vitro using the HyperScribe T7 High Yield Cy5 RNA Labeling Kit (APExBIO) according to the manufacturer’s protocol. In brief, the 3′-UTR sequence of FLS2, as previously described44, was amplified using a forward primer containing a T7 promoter sequence (TAATACGACTCACTATAGGGGAAGTTTAGCAGCAAAGC) and a reverse primer (GTTCATCAAAACCAAATTTC). One microgram of DNA template containing a T7 promoter was combined in a 20 μl reaction volume. The reaction mixture consisted of 2 μl of 10× Reaction Buffer, 2 μl of T7 RNA Polymerase Mix, 2 mM each of ATP, GTP, and CTP, 1.5 mM UTP and 0.5 mM Cy5-UTP. The reaction was thoroughly mixed and incubated at 37 °C for 2 h. Following transcription, the DNA template was digested by adding 1 μl of DNase I and incubating at 37 °C for 15 min. The synthesized Cy5-labelled RNA was subsequently purified via phenol/chloroform extraction and ethanol precipitation. To evaluate the labelling efficiency, the absorbance of the purified RNA was measured at 260 nm and the Cy5 maximum excitation wavelength using NanoDrop.
Extraction of cytoplasmic and nuclear proteins from N. benthamiana leaves
Cytoplasmic and nuclear fractions were extracted according to the manufacturer’s manual instructions of Minute Cytoplasmic and Nuclear Extraction Kit for Cells. In brief, leaves (0.1 g, co-expressing NIB1–YFP and EDS1–mCherry with or without NVR1 for 48 h) were homogenized in cytoplasmic extraction buffer. Following centrifugation (14,000g, 5 min, 4 °C), the cytoplasmic supernatant was collected. The pellet was lysed in nuclear extraction buffer through repeated cycle of vortexing and ice incubation, and then centrifuged through a pre-chilled filter cartridge (14,000g, 30 s) to collect the nuclear extract. Histone H3 and phosphoenolpyruvate carboxylase (PEPC) served as nuclear and cytoplasmic markers, respectively, to confirm successful fractionation.
DAB staining
Leaves were incubated in DAB solution (1 mg ml−1 DAB, 0.05% Tween-20, 10 mM Na2HPO4, pH 5.8) for 4–5 h in the dark. Bleaching buffer (ethanol:acetate:glycerol, 3:1:1) was added to displace DAB stain, and the sample was heated to 90–95 °C 3–5 times until the chlorophyll was removed completely. The samples were immersed in 50% glycerol for imaging.
Protein phylogenetic analysis
RNaseT2 proteins were filtrated from the genomes of plants (Gossypium hirsutum, Nicotiana tobacum, O. sativa), fungi (Fusarium graminearum, M. oryzae), insects (N. viridula, A. lucorum, Nilaparvata lugens, Aphis gossypii, C. medinalis, H. armigera) and mammals (Homo sapiens and Rattus norvegicus) using PF00445 HMM search or NCBI blastp. The GRPs (GRPIVa) encoded in genomes of 18 plant species of 14 families (Physcomitrella patens, Adiantum capillus, Cycas revoluta, Picea abies, Nymphaea colorata, O. sativa, Zea mays, Sorghum bicolor, Brachypodium distachyon, G. hirsutum, Arabidopsis thaliana, Vitis vinifera, Carica papaya, Cucumis sativus, Glycine max, Solanum lycopersicum, Solanum tuberosum and Populus trichocarpa) were filtrated under the condition of only one PF00076 domain. The genomes were obtained from Phytozome (https://phytozome-next.jgi.doe.gov/) or NCBI (https://www.ncbi.nlm.nih.gov/datasets/genome/), and insect proteomes were obtained from the NCBI Protein database (https://www.ncbi.nlm.nih.gov/protein/). All filtrated proteins in these two classes were aligned by MUSCLE 5.1, trimmed using trimAl 1.2. The phylogenetic tree was constructed by using IQ-TREE 2.2.0 and annotated by Evolview v3. Conservation diagram of amino acid residues was shown using Jalview 2.11.2.5.
RNA-seq analysis
Total RNA was extracted from leaves of ~4-week-old wild-type O. sativa ZH11 and transgenic lines, as indicated. Leaves of four-week-old tobacco (N. benthamiana) were infiltrated with 50 μM 8-Br-2′,3′-cAMP for 6 h, followed by RNA extraction. RNA-seq was performed by Personalbio. Clean reads were aligned to the O. sativa reference genome (GCF_001433935.1_IRGSP-1.0_genomic.fna; https://www.ncbi.nlm.nih.gov/datasets/genome/GCF_001433935.1/) or the N. benthamiana reference genome (Niben.genome.v1.0.1; https://solgenomics.net/ftp/genomes/Nicotiana_benthamiana/assemblies/) using HISAT2. Differential gene expression analysis was subsequently performed using DESeq, with differentially expressed genes identified based on the thresholds of |log2(fold change)| > 1 and P < 0.05. GO enrichment and volcano plots were generated using R v4.3.2 in RStudio 2023.09.1. The differentially expressed genes and corresponding GO enrichment results are provided in Supplementary Tables 2, 4, 5, 8–12.
Insect feeding assay
The third-instar C. medinalis larvae were placed on leaves of the 12-day-old rice seedlings of the indicated lines. Larval weight was recorded after the feeding for three days. Oviposition selection assay was conducted in nylon mesh cages (90 × 70 × 90 cm). Three one-month-old, uniform rice plants per genotype were grouped and arranged triangularly to prevent positional bias. 15 pairs of newly emerged moths were mated for 48 h. Subsequently, males were removed, and the 15 mated females were released into the cage centre with a 15% honey solution. After 24 h of oviposition at 26 °C (12 h:12 h light:dark photoperiod), the total number of eggs laid on the three plants of each genotype was summed. The assay was repeated with three independent cages. Oviposition preference was quantified by the oviposition index: OI = (T − C)/(T + C), where T and C are the number of eggs in the mutants and wild type, respectively. The deviation of the oviposition index against 0 was tested using a one-sample Student’s t-test.
For larval feeding preference, leaf segments (3 cm) from 3 plant lines were arranged equidistantly in a circle within a Petri dish. Ten third-instar larvae (pre-starved for 2 h) were introduced to the centre. After 1 h of selection in darkness, the number of larvae settled on each plant was recorded. The selection rate was calculated as Ntarget/Ntotal selection × 100%, where Ntarget and Ntotal selection represent the number of larvae on a specific plant and the total number of larvae making a definitive choice, respectively.
For field test, wild-type ZH11 seeds were sown in soil, and 35-day-old plants were transplanted into six 1 m × 1 m field plots. Each plot was surrounded by two rows of rice plants serving as buffer rows, and all six plots were maintained within mesh enclosure. Four weeks after transplantation, the plots were arranged in an alternating pattern and sprayed with either water or 50 μM 8-Br-2′,3′-cAMP. Following treatment, 20 mated female C. medinalis moths were released at the centre of the enclosure. Once rolled-leaf shelters became visible, the number of shelters was counted. Insects and plant positions were randomized in laboratory assays, field treatments followed an alternating design, and outcomes were assessed blind to genotype or treatment.
Measurement of jasmonic acid and salicylic acid
Leaves tissue of 4-week-old rice plants were ground into powder with liquid nitrogen and resuspended in 500 μl ethyl acetate. Following vortex for 1 min and centrifugation at 14,000g for 10 min at 4°C, the supernatant was transferred and dried in vacuum concentrator and resuspended in 30 μl 30% (v/v) methanol. The samples were centrifuged at 14,000g for 15 min and the supernatant was applied to the LC–MS/MS on a QTRAP 6500+ mass spectrometer (AB SCIEX) for analysis. Salicylic acid samples were diluted to 1/100 with 30% (v/v) methanol.
ROS measurement
Leaf sheath segments of 2 mm were excised from 2-week-old rice seedlings and pre-incubated overnight in sterile distilled water. The samples were then treated with water or purified recombinant His–NVR1 protein in buffer containing 20 μM luminol and 10 μg ml−1 HRP. Luminescence was recorded at 1-min intervals for 100 min with Varioskan Flash multireader (Thermo Fisher Scientific).
Q Exactive quadrupole analysis of NVR1 products
NVR1 (1 μM) and the rRNA substrate (2 μg) were incubated in a 20-μl reaction mixture at 25 °C for 25 min. The reaction was stopped by adding methanol, and the mixture was centrifuged at 12,000g for 10 min at 4 °C. The supernatant was collected and analysed by liquid chromatography–high-resolution mass spectrometry (LC–HRMS) using a Q Exactive quadrupole-Orbitrap high-resolution mass spectrometer coupled to a Dionex Ultimate 3000 RSLC (HPG) ultrahigh-performance liquid chromatography system. The injection volume was 1 μl. The samples were separated on an ACQUITY UPLC HSS T3 column with a particle size of 1.8 μm. The mobile phase were water (A) and methanol (B), each containing ammonium formate (2 mM). The gradient elution was set as follows: 0–6.5 min, 2% methanol; 6.5–8.5 min, 20% methanol; 8.5–11 min, 98% methanol; 11.1–15.0 min, 2% methanol. The flow rate was consistently set to 0.40 ml min−1, and the column temperature was precisely maintained at 40 °C. Detection was performed in positive-ion mode using a heated electrospray ionization source. LC–HRMS data were analysed using Thermo Scientific Xcalibur 4.1.50.
Extraction and detection of 2′,3′-cAMP/cGMP from leaves
Extraction of 2′,3′-cAMP/cGMP was performed as described3. Leaf tissue was ground into powder with liquid nitrogen. Samples were resuspended in 600 μl 4% acetate containing 1 mM IBMX and vortexed for 2 min. The supernatant was extracted twice with 800 μl chloroform. The samples were dried through vacuum spinning and resuspended in 50 μl sterile water.
The dissolved samples were subjected to analysis by LC–MS/MS on a QTRAP 6500+ mass spectrometer (AB SCIEX) coupled to an Agilent 1290 LC system. Chromatographic separation was achieved using a Waters XSelect HSS T3 column with a particle size of 2.5 μm and dimensions of 100 mm × 3.0 mm. Sample of 1 μl was injected. The mobile phase consisted of water (A) and methanol (B), both containing 2 mM ammonium formate. The gradient elution method was used as follows: 0–2.5 min, 2% B; 2.5–3.0 min, 2–70% B; 3.0–5.0 min, 70–99% B; 5.0–7.0 min, 99% B; 7.1–10 min, 2% B. The flow rate was set at 0.4 ml min−1, and the column temperature was maintained at 40 °C. Metabolites were detected using electrospray ionization in negative ion mode with multiple reaction monitoring. The mass spectrometer parameters were as follows: −4,500 V of capillary voltage, 500 °C of source temperature, 50 psi of ion source gas 1 (GS1) and gas 2 (GS2), and 35 psi of curtain gas. Data acquisition and analysis were performed using Analyst 1.6.3 software (AB SCIEX).
Chemical synthesis of ApG>p
Step 1. To a stirred solution of 2′,3′-O-isopropylideneguanosine (1.0 eq) in anhydrous tetrahydrofuran (THF) at 0 °C under an inert atmosphere, trimethylsilyl chloride (TMSCl) (1.0 eq) was introduced, followed by the dropwise addition of pyridine (2.5 eq). The reaction mixture was stirred at room temperature for 2 h. Next, isobutyryl chloride (1.0 eq) was added dropwise at 0–5 °C, and the mixture was stirred at room temperature for an additional 1 h. After quenching and extraction, the crude product was obtained and purified by C18 flash chromatography. The final product was characterized by LC–MS and 1H NMR spectroscopy for structural confirmation. Step 2. To a stirred solution of the Step 1 product (1.0 eq) and starting compound 2 (1.0 eq, CAS: 104992-55-4) in dichloromethane (DCM) at 0 °C, 5-(benzylthio)-1H-tetrazole (5-BTT) (1.0 eq) was added. The reaction mixture was stirred at room temperature for 3 h. Reaction solution washed water and brine, the DCM solution was concentrated under vacuum, the crude by C18 flash purification. Confirmed by LC–MS, 1H NMR and 31P NMR. Step 3. To a stirred solution of iodine (1.0 eq) in a THF:water:pyridine mixture (10:5:1, v/v/v), the Step 2 product was added at room temperature. The reaction mixture was stirred at room temperature for 1 h, followed by the addition of 10% sodium sulfite solution until the colour disappeared. The reaction mixture was then concentrated under vacuum, and the residue was extracted with ethyl acetate. The organic layer was dried over anhydrous Na2SO4, filtered, and concentrated under vacuum. The crude product was used directly in the next step without further purification. Confirmed by LC–MS and 31P NMR. Step 4. To a stirred solution of the Step 3 product (1.0 eq) in DCM, trifluoroacetic acid was added at room temperature. The reaction mixture was stirred at 45 °C for 4 h. After completion, the solution was concentrated under vacuum. Due to the product’s high water solubility, the residue was purified directly by C18 flash chromatography. Confirmed by LC–MS, 1H NMR and 31P NMR. Step 5. To a stirred solution of the Step 4 product (1.0 eq) in acetonitrile, N-methylmorpholine (1.0 eq), 2-methoxy-1-ethanesulfonyl chloride (2.0 eq), trimetaphosphate tri-tetrabutylammonium salt (1.0 eq), 1H-4(5)-nitroimidazole (0.1 eq), and DBU (3.0 eq) were added sequentially under nitrogen protection. The reaction mixture was stirred at room temperature until completion. MgCl2 (2.0 eq) was then added, and the mixture was stirred at room temperature. After completion, the solvent was concentrated under vacuum, and water was added to the residue to adjust the pH to 3–4. The mixture was extracted with ethyl acetate, washed, dried, and concentrated to obtain the crude product, which was further purified by preparative HPLC and lyophilization. Confirmed by LC–MS, 1H NMR and 31P NMR. Step 6. To a stirred solution of the Step 5 product (1.0 e) in THF, HF (6.0 eq) was added at room temperature. The reaction mixture was stirred at 50 °C until completion. Triethylamine was then added to the residue to adjust the pH to 6–7, and the mixture was concentrated under reduced pressure to obtain the crude product. The crude product was purified by preparative HPLC and lyophilization. Confirmed by LC–MS, 1H NMR and 31P NMR. Step 7. To a stirred solution of the Step 6 product (1.0 eq) in methanol (10 volumes), NH3/methanol (10.0 eq) was added at 0 °C. The reaction mixture was stirred at 0 °C for 6 h until completion. The methanol solution was then concentrated under vacuum and the residue was purified by preparative HPLC followed by lyophilization. Confirmed by LC–MS, 1H NMR and 31P NMR.
In vitro assay of NIB1 capture of NVR1-catalysed small molecules
NIB1–GST was incubated with 10 μl of glutathione agarose resin at 4 °C for 2 h. Empty vector (encoding TF tag) or NVR1 products were added to the resin for an overnight incubation at 4 °C. Then the resin was treated with 100 μl of 80% acetonitrile and 5% formic acid and incubated at 25 °C for 30 min before proceeding with liquid chromatography analysis.
Treatment of plants with 8-Br-2′,3′-cAMP/cGMP and ApG>p
The 12-day-old rice seedlings were sprayed with 50 μM 8-Br-2′,3′-cAMP, 8-Br-2′,3′-cGMP or ApG>p for 6 h, with water and 8-Br-AMP as controls. After treatment, RNA was extracted, and the expression levels of defence genes were analysed by RT–qPCR. Leaves of 4-week-old N. benthamiana plants were infiltrated with 50 μM 8-Br-2′,3′-cAMP for 6 h, and gene expression was analysed by RT–qPCR.
Molecular docking
AlphaFold2 was used to predict the structure of the NVR1–NIB1 complex. The 3D structures of 2′,3′-cAMP and 2′,3′-cGMP were obtained from PubChem (https://pubchem.ncbi.nlm.nih.gov/), and ApG>p was modelled using ChemBioDraw Ultra 14.0. The ligands were optimized using density functional theory (DFT) in Gaussian 16 and prepared for docking with NIB1 using AutoDockTools 1.5.7. Molecular docking was performed using AutoDock 4.2.6 with ligand-specific grid boxes at a spacing of 0.375 Å. Grid dimensions were adjusted to 46 × 50 × 50 for 2′,3′-cAMP, 50 × 56 × 56 for 2′,3′-cGMP and 100 × 100 × 100 for ApG>p. The Lamarckian genetic algorithm was applied with 50 runs, a population size of 150 and 2.5 × 10⁶ energy evaluations. The lowest-energy poses were analysed using PyMOL 2.5.5 and LigPlot+ 2.2.8.
Statistics
Statistical analyses were performed using GraphPad Prism 9 (GraphPad Software). Comparisons between two groups were performed using unpaired two-tailed Student’s t-tests. For comparisons among multiple groups, one-way ANOVA followed by Dunnett’s or Tukey’s multiple-comparisons test was used, as appropriate. Two-way ANOVA with Tukey’s post hoc test or the two-stage linear step-up procedure of Benjamini, Krieger and Yekutieli was performed, as indicated in the figure legends. Statistical significance was set at P < 0.05, with a false discovery rate of 5% for analyses using the Benjamini–Krieger–Yekutieli procedure. For violin plots, width indicates data density, lines show the median and quartiles, and dots represent individual values. Details of the statistical tests are provided in the corresponding figure legends.
Reporting summary
Further information on research design is available in the Nature Portfolio Reporting Summary linked to this article.