 Newshot
Main
The Landau model provides a powerful framework for understanding many phases of matter through the lens of spontaneous symmetry breaking6,7. In superfluids and superconductors, this breaking manifests in the emergence of a macroscopic condensate that exhibits long-range phase coherence. This coherence is ultimately responsible for properties such as dissipationless transport8,9, the Josephson effect10, and in the case of superconductivity the Meissner effect11. Although relatively robust in bulk systems, in lower-dimensional systems, the enhanced effect of fluctuations—and in particular topological defects—can suppress this long-range phase coherence and govern superfluid transport4,12.
For example, in a voltage-biased superconducting wire, the applied voltage continuously winds the superconducting phase, causing an increase of the phase gradient between the contacts. The supercurrent, proportional to this gradient, would grow without bound unless intermittent phase fluctuations relax the accumulated gradient. By relaxing the gradient, the fluctuations dissipate energy, thereby causing a resistance3,13. The characteristics of the fluctuations and their corresponding resistance depend on the dimensionality of the setup as follows.
In one-dimensional (1D) wires, discrete relaxation events known as phase slips dominate the dynamics. Microscopically, a phase slip occurs when the magnitude of the superconducting order parameter is transiently and locally suppressed over a healing length ξ. Where the amplitude vanishes, the phase is ill-defined, allowing for phase jumps of 2π. As the order parameter recovers, the wire returns to a state with a uniform amplitude but a reduced phase gradient4 (Fig. 1a, top row).
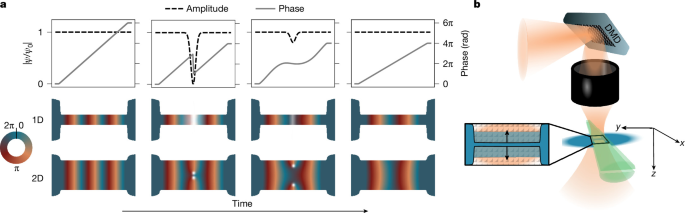
a, Dissipation in a narrow, quasi-1D channel occurs because of phase slips, in which a depletion of the order parameter allows for a relaxation of the phase gradient and kinetic energy (top row). The corresponding phase (colour-coded) evolution of a phase slip in a narrow channel is plotted in the central row. In a wide, quasi-2D channel, dissipation is governed by vortex–antivortex pairs traversing the channel (bottom row). b, A transport channel of programmable width connects two superfluid reservoirs (blue). The channel is formed by two repulsive beams (green and orange), one of which is tunable by a DMD.
In two-dimensional (2D) geometries, such as thin films, dissipation instead arises from the nucleation and motion of topological defects known as vortices. A vortex is a point-like singularity of the phase around which the phase winds by 2π, with a small core in which the amplitude is suppressed. Driven by a current, vortices move across the film and dissipate energy. Each time a vortex traverses the sample, the phase difference between the contacts relaxes by 2π. Repeated vortex crossings generate a finite voltage and hence an effective resistance14,15 (Fig. 1a, bottom row). In intermediate, thin-strip geometries, both vortex flow and phase slips may contribute to dissipation.
Previous studies included experiments on superconducting rings16; Dayem-bridge nanowires17,18,19,20; Bose–Einstein condensates in dumbbell21,22, cylindrical23 or toroidal geometries24; optical lattices25,26; and fermionic Josephson junctions27,28,29. These previous studies have explored various facets of phase-slip and vortex physics, including direct imaging of vortices28,30,31,32, the Berezinskii–Kosterlitz–Thouless phase transition33 and the recent observation of Shapiro steps in atomic Josephson junctions34,35. However, the experimental challenge of isolating and characterizing geometric or dimensional effects on dissipation remains unresolved.
With the rise of quantum simulation of devices based on highly controllable ultracold atomic gases36,37, it is now possible to shed new light on how these dissipative processes emerge in quantum systems.
In this work, we use ultracold, strongly interacting fermions in a two-terminal configuration to study nonlinear transport through a digitally programmable channel. The optically shaped channel can be reproducibly tuned from a quasi-1D to a quasi-2D geometry, providing a platform ideally suited for probing the influence of geometry on fluctuation-driven dissipation in the absence of defects or impurities.
In the narrow, 1D channel limit, we identify signatures of phase slips, in agreement with the Langer–Ambegaokar–McCumber–Halperin (LAMH) theory4,38,39. In particular, we observe the predicted exponential suppression of the LAMH activation factor over many orders of magnitude on widening the channel. For even larger widths, the system crosses over to a 2D regime in which dissipation is dominated by vortices, as indicated by the observed power-law dependence of the current–voltage characteristics predicted for vortex dynamics.
Beyond establishing these limiting behaviours, our measurements provide a direct window into the crossover between 1D and 2D transport, a regime in which analytical modelling is challenging. It is in this crossover that widening the channel paradoxically increases its resistance. More broadly, our results highlight the utility of ultracold atomic superfluids as a platform for quantum simulation of nonequilibrium transport.
Optical sample shaping
We prepare a balanced mixture of the lowest and third-lowest hyperfine states of fermionic 6Li in the unitary regime. A total of 2N = 2.7 ± 0.1 × 10⁵ atoms are cooled to T/TF = 0.144 ± 0.007, where N denotes the number of atom pairs, TF denotes the Fermi temperature, and the errors in both quantities denote the uncertainties due to shot-to-shot fluctuations. The temperature corresponds to T/TC ≈ 0.7, where TC ≈ 0.2TF denotes the critical temperature40. The atoms are confined in a cigar-shaped, harmonic trap with trapping frequencies (νx, νy, νz) = (222 ± 7, 28.1 ± 0.1, 195 ± 5) Hz.
As shown in Fig. 1a, a repulsive TEM0,1 beam, propagating in the x-direction, is aligned with the trap centre. It divides the atomic cloud into two reservoirs, separated by a quasi-2D transport region that is 51 ± 1 μm long and provides confinement of ν2D = 10.46 ± 0.09 kHz along z. Within the central 27 ± 0.5 μm of this plane, the atoms are further confined in the x-direction to a channel of variable width w. The channel is defined by a repulsive beam propagating along z, shaped by a digital micromirror device (DMD). It enables reproducible tunability of w from 0.9 ± 0.5 μm to 19.8 ± 0.5 μm, in which the uncertainty is dominated by and calculated from the resolution limit of our projection system (numerical aperture = 0.53, λ = 532 nm). Note that given the dimensions of our setup, we are not in the Josephson regime (see Methods, ‘No Josephson oscillations’). A third, attractive Gaussian beam (not shown) illuminates the transport channel and its connections to the reservoirs, locally increasing the degeneracy. A more detailed description of this effect as well as of the overall setup can be found in ref. 41.
Phenomenology
At time t = 0, we prepare a relative atom-pair imbalance between the two reservoirs, ΔN/N = (Nl − Nr)/(Nl + Nr), where Nl,r denote the number of atom pairs in the left and right reservoirs. An initial imbalance of ΔN/N ≈ 0.1 relaxes through an approximately constant initial current, followed by damped oscillations of the imbalance. The discharge is distinctly non-exponential, indicating a nonlinear response. The damping, and in particular its dependence on the channel width w, carries information about the underlying microscopic mechanisms.
The key data of our measurement series are shown in Fig. 2a. We record transport traces for w between 0.9 ± 0.5 μm and 19.8 ± 0.5 μm. As w increases, the magnitude of the initial current increases, which manifests in a steeper initial slope. Concurrently, both the oscillation frequency and amplitude grow. The frequency rises from just below 10 Hz to approximately 18 Hz (see also Extended Data Fig. 1). For the narrowest channel (w = 0.9 ± 0.5 μm), the oscillation amplitude is comparable to the noise floor and barely resolved. By contrast, for the widest channel (w = 19.8 ± 0.5 μm), the amplitude reaches ΔN/N ≈ 0.06.
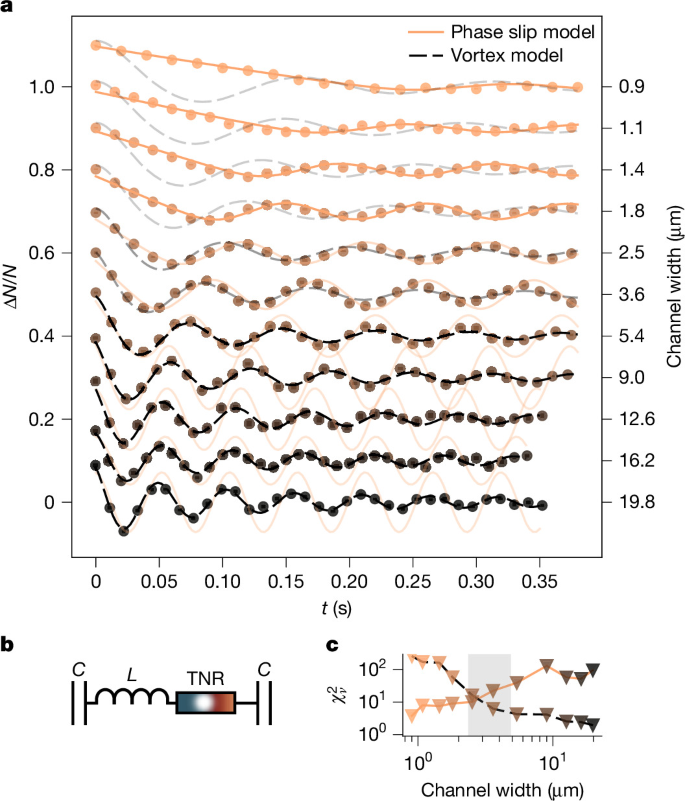
a, Atom transport (imbalance ΔN/N as a function of time t) of a unitary Fermi gas through channels of increasing width shows distinctively changing dissipation characteristics. The data are compared with fitted phase slip (LAMH) and vortex models. The models both describe the TNR in the circuit (b), capturing either phase slips or vortices. The LAMH model fits narrow channels, whereas the vortex model fits wide channels. The measurements for different channel widths are vertically offset for clarity. The statistical uncertainties of the measurements (typically four to five measurements per data point) are smaller than the marker size. c, A quality-of-fit \({\chi }_{\nu }^{2}\) analysis substantiates the change of the dominant model apparent in a.
The damping exhibits a non-monotonic dependence on w. At longer transport times (for example, t = 0.3 s), the remaining oscillation amplitude reaches a maximum for intermediate channel widths (see also Fig. 4). These signals suggest distinct dissipative mechanisms in the narrow and wide channel limits, which we analyse quantitatively below.
Modelling of dissipative mechanisms
The general characteristics of the dynamics can be understood as arising from the interplay between the potential energy stored in the reservoirs, the kinetic energy inside the channel and the dissipative processes we want to investigate. To study these dissipative processes, we model our system with an equivalent RLC circuit shown in Fig. 2b. We first characterize the capacitance and inductance of the circuit to subsequently infer the dissipative (resistive) processes by fitting the dynamics of the circuit to the measurements. The capacitances, inductance and resistance in the circuit model correspond to the compressibility of the atomic reservoirs, the inertia of the atoms and the dissipative processes in the channel, respectively. We explore these elements in the following starting with the capacitors. As the model circuit features two capacitors in series, each with a capacitance C, the effective capacitance of the circuit is Ceff = C/2. The compressibility κeff of the gas allows to quantify this equivalent capacitance Ceff (potential energy per atom pair displaced from equilibrium) through \(\frac{1}{2}{(\Delta N/2)}^{2}/{\kappa }_{\mathrm{eff}}=\Delta {E}_{\mathrm{pot}}\equiv \frac{1}{2}{(\Delta N/2)}^{2}/{C}_{\mathrm{eff}}\). We measured the compressibility of our sample (Methods, ‘Derivation of the reservoir capacitance’) to find hCeff = 15.8 ± 0.5 s, where h is Planck’s constant. Next we quantify the inductance. To do so, we assume all channels have box-like potentials. A charge-neutral atom-pair current I carries a kinetic energy Ekin that depends on w. We define the inductance of our systems using \({E}_{{\rm{kin}}}\equiv \frac{1}{2}L{I}^{2}.\) We developed a model that predicts a functional dependence
(Methods, ‘Derivation of the inductance’). By analysing the oscillation frequencies observed in our measurements and noting that in a weakly damped circuit, the frequencies are given by \(\omega (w)\approx 1/\sqrt{L(w){C}_{\mathrm{eff}}}\), we find ℓc/h = 3.01 ± 0.03 × 10⁻⁵ μm s and Lres/h = 3.06 ± 0.04 × 10⁻⁶ s. Although the details are provided in the Supplementary Information, here we state that the first term in equation (1) captures the kinetic energy in the channel, whereas the second term accounts for the kinetic energy in the reservoirs.
Phase slips and vortices dissipate the kinetic energy of the current into heat. So, they effectively act as a topological nonlinear resistor (TNR). With L and C determined, the resistance R remains the sole unknown component in our circuit. Owing to the nature of phase slips, R is topological and nonlinear, meaning it depends not only on the geometry but also on the current.
Showing how R depends on geometry, in particular in relation to the length scale given by ξ ≈ 1.2 μm (Methods, ‘Estimate of ξ’), reveals the nature of the underlying dissipative processes. To do so, we fit the width-dependent resistance R(w) in the equations of motion of an RLC circuit (derived in Methods, ‘RLC circuit modelling and fitting’)
to the measurements.
Phase slips in narrow channels
For narrow, quasi-1D channels (w ≱ 2ξ), we expect the system to be in the phase slip regime. The LAMH model predicts4
defined using R = V/I, where R0 is the characteristic resistance, w0 is the characteristic width, and I0 = 2kBT/h, where kB is the Boltzmann’s constant and T is the temperature. The exponential suppression of R with w reflects the thermally activated phase-slip rate scaling with \(\varGamma \propto \exp (-\Delta F/({k}_{{\rm{B}}}T))\) (ref. 18), where the free energy barrier for phase slips is ΔF ∝ w. The sinh(I/I0) term can intuitively be understood as follows: at small |I/I0| ≪ 1, phase slips occur in both directions with roughly equal probability; as the bias increases slightly, phase slips that relax the current become more probable. For large |I/I0| ≫ 1, sinh(I/I0) ≈ exp(I/I0)/2. reflecting the local destabilization of the superfluid and the resulting exponential increase in the phase-slip probability.
Using our predetermined C and L(w), we determine R0 and w0 by fitting them simultaneously to the measurements of our four narrowest channels (Methods, ‘RLC circuit modelling and fitting’). Assuming that the LAMH model can be used to describe our system, a simultaneous fit to multiple channel widths provides a robust extraction of the model parameters but enforces the predicted exponential suppression of RLAMH with w. We find R0/h = 102.3±0.2 and w0 = 49.7(6) nm, where the errors denote the uncertainties of the fit. The resulting fits (shown in Fig. 2a) largely capture the dynamics for channels with a width up to w = 2.5 μm. This is quantified by \(\mathrm{NRMSE}\,=\) \(\sqrt{{\sum }_{i}{({m}_{i}-{f}_{i})}^{2}/N}/({m}_{\max }-{m}_{\min }) < 0.06\), where mi and fi denote the measured and fitted imbalances, respectively, and mmax − mmin is the measured signal range. However, the \({\chi }_{\nu }^{2}\) analysis \(({\chi }_{\nu }^{2}\lesssim 9)\) shown in Fig. 2c suggests additional systematic effects beyond the very small statistical uncertainties of the measurements (typically on the level of 0.004). These systematic effects could originate from the approximation of modelling the channel with a box-like potential or the attractive beam illuminating the channel locally increasing the temperature. Outside the validity range of the model, the quality of the fits degrades noticeably, failing to capture the phase of the oscillations and underestimating their damping.
In a second step, we validate the choice of the LAMH model by fitting RLAMH(w) to each curve individually. In contrast to the simultaneous fit, these individual fits do not enforce the predicted scaling RLAMH(w) and therefore provide an independent test of whether the scaling is present in the data. Within the validity regime of the model, the individual fits reproduce the predicted exponential scaling over many orders of magnitude, as shown in Fig. 3a.
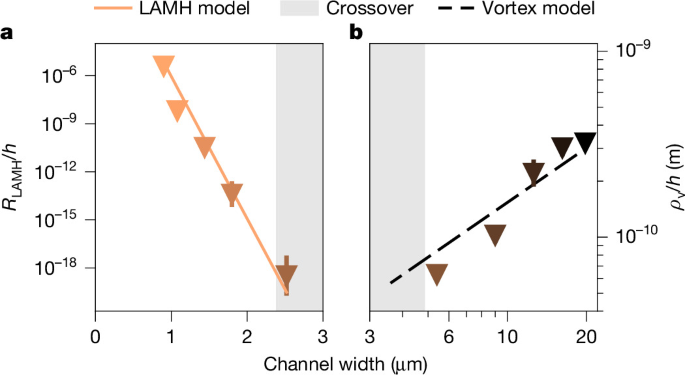
a, The fitted phase-slip resistance RLAMH(w), for narrow channels, shows the exponential suppression with width, as predicted by LAMH theory. b, The fitted vortex resistivity ρv(w), for wide channels, shows the predicted power law. Inside the crossover region (2–4ξ), that is, outside the validity range of the models, both scalings break down (Methods, ‘Breakdown of scaling laws’). Note that a and b display different quantities (resistance compared with resistivity) characterizing different regimes (1D compared with 2D) and are therefore not intended to be compared across the dimensional crossover. The error bars represent the error of the fit.
This is the first main finding of this paper. Compared with RLAMH(w), the total resistance R(I, w) apparent in the measurements (Fig. 2a) varies much less. As we initialize a fixed potential bias in our system, the exponential geometric suppression (R ∝ exp(−w/w0)) approximately cancels the current-induced exponential enhancement (R ∝ sinh(I/I0) ≈ exp(I/I0)/2). This allows RLAMH to be inferred over a wide range—more than 10 decades—while only exploring a relatively modest dynamic range of R. Importantly, the observed scaling of RLAMH(w) is contained within the data itself and is not just an artefact of the choice of the model. This becomes evident when the model is applied outside its validity regime, where the scaling breaks down immediately (Methods, ‘Breakdown of scaling laws’).
Vortices in wide channels
In quasi-2D channels (w ≳ 4ξ), phase slips become energetically unfavourable, as their activation energy increases exponentially with w. Instead, dissipation is expected to be governed by vortex flow. Owing to the vortices, we expect to see a power-law dependence in the pair-current density J:
where J0 = I0/ξ. A derivation, building on the results of ref. 5, is provided in the Methods, ‘Vortices in a finite width’. By fitting α and \({\widetilde{R}}_{0}\) simultaneously to the data of our four widest channels (Methods, ‘RLC circuit modelling and fitting’), we find \(\alpha =1.98\pm 0.04,{\mathop{R}\limits^{ \sim }}_{0}/h=1{0}^{-4.79\pm 0.07}\). As apparent from Fig. 2a, this model captures the dynamics for channels in the 2D regime (NRMSE ≱ 0.06). In these cases, \({\chi }_{\nu }^{2}\lesssim 4\). Note that the vortex model does not contain an explicit temperature dependence, and for wide channels, the box-potential approximation is safer compared with narrow channels. Apart from these statistical tests, we validate our model by fixing α to its global fit value but fitting ρv to each individual curve. Within the validity range of the model, these individual fits agree with the predicted power-law ρv ∝ wα−1 (Fig. 3b). This scaling is the second main finding of the paper. The scaling breaks down outside the validity regime of the model (Methods, ‘Breakdown of scaling laws’), providing evidence that the observed scaling is a feature of the data, not a mere artefact of the enforced power law R ∝ Jα−1. When approaching the dimensional crossover w ≱ 4ξ, while still largely capturing the dynamics, the model begins to slightly but systematically underestimate the amplitude of the oscillations at long times. Presumably, because the approximation of sufficiently large w used in the derivation of R(J) ceases to hold (Methods, ‘Vortices in a finite width’). The eventual breakdown of the vortex model at w ≈ 4ξ marks the end of the 2D regime: the vortex model should be valid only when vortex–antivortex pairs are available as excitations. As each vortex has a radius of ξ, such an excitation requires w ≳ 4ξ. This leaves a gap between the validity ranges of the phase slip and the vortex model, in which neither model provides a microscopically satisfactory description. In this gap, there is a dimensional crossover, in which both phase slips and vortices compete.
Exploring the dimensional crossover
The underdamped oscillations allow us to characterize dissipation in our system using only a few basic assumptions, while staying agnostic to the dissipation mechanism. This is particularly useful to analyse the dimensional crossover, in which neither the phase-slip nor the vortex model provide a satisfactory microscopical description. We split the total energy Etot into a potential (capacitive) energy EC and a kinetic (inductive) energy EL. We assume Etot = EC(ΔN) + EL(I, w) with EC ∝ ΔN2 and EL(I = 0, w) = 0. For each channel width w, we extract the times ti,w at which ΔN(t = ti, w) reaches an extremum and thus I ≈ 0. There, the system has minimal inductive energy (EL ≈ 0) and maximal capacitive energy. The fraction of the initial energy remaining in the system is then given by
The remaining energy as a function of time and channel width is shown in Fig. 4. The plot is obtained by cubic interpolation between the measured points, performed linearly in time and logarithmically in width.
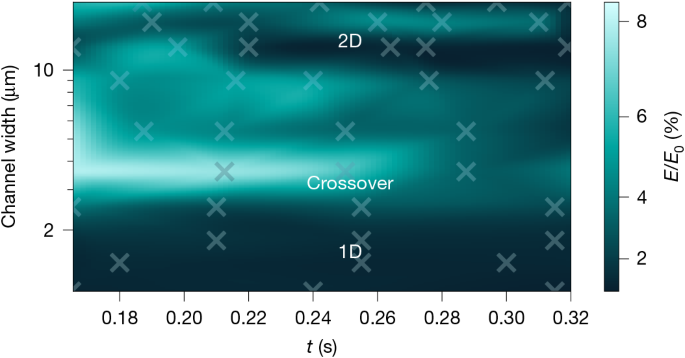
The remaining energy in the oscillator paradoxically varies non-monotonically as a function of the channel width w. For a given time after the initial decay, the maximum appears in the crossover region, near w = 4 μm ≈ 3ξ, in which phase slips and vortices are suppressed but competing. The crosses mark the measurement points (typically four to five measurements per cross) between which we interpolate. We estimate the individual data points to have a typical positive bias of 0.5% and a statistical uncertainty smaller than 2% (Methods, ‘Error estimation’).
For a fixed width, the energy decays over time, reflecting dissipation. At any given time t > 0.15 s, Et(w)/E0 varies non-monotonically with the channel width, exhibiting a clear maximum near w ≈ 3ξ, corresponding to a minimal effective resistance. We call this deviation from the expected monotonicity the ‘quantum resistance paradox’ and consider it the third and last main finding of this paper. Note that the activation energy for phase slips increases exponentially with channel width, whereas vortex–antivortex pairs require sufficiently wide channels to form. The observed non-monotonicity thus suggests a transition in the underlying dissipation mechanism and a crossover from 1D to 2D physics.
Conclusion
We have investigated atom transport between two bulk superfluids through channels across different dimensional regimes and observed distinct behaviours. In narrow, quasi-1D channels, our data are in agreement with those of the LAMH model. We infer the geometric suppression of the phase slips by many orders of magnitude, providing the first experimental confirmation of the predicted geometric scaling. For wide, quasi-2D channels, dissipation is captured by a vortex flow model. The borders of the 1D and 2D regimes appear close to the theoretically expected length scale. A measurement of energy decay, agnostic to microscopic details, provides further evidence for a transition in the dissipation mechanism for channels of intermediate width, which paradoxically exhibit the least energy loss. These findings not only suggest routes for optimizing energy transport in mesoscopic devices but also provide a benchmark for theoretical efforts to describe the delicate phase-slip and vortex-flow mechanisms in the dimensional crossover in superfluids and superconductors42,43,44.
Methods
RLC circuit modelling and fitting
Our setup is analogous to an RLC circuit with the mapping presented in Extended Data Table 1.
The procedures for determining the capacitance C and the inductance L are described in sections ‘Derivation of the reservoir capacitance’ and ‘Derivation of the inductance’. Here, we derive the governing equations and provide additional details on the fitting procedure used to determine R, as presented in the main text.
The total number of atoms in each reservoir is measured directly using absorption images of both hyperfine states (|1⟩ and |3⟩), taken in rapid succession. To determine the total number of pairs in each reservoir Nl,r, we use both measurements, as this reduces statistical uncertainty. Specifically, \({N}_{{\rm{l}},{\rm{r}}}=({N}_{{\rm{l}},{\rm{r}};|1\rangle }+{N}_{{\rm{l}},{\rm{r}};|3\rangle })/2\), where \({N}_{{\rm{l}},{\rm{r}};|i\rangle }\) denotes the number of atoms in the left and right reservoirs in state |i⟩. However, the second image (state |3⟩) shows a cloud that has absorbed some energy from the first imaging pulse and is therefore slightly distorted. To avoid systematic effects from this distortion on C and T, we use only the image of the lowest hyperfine state (|1⟩) to extract the compressibility and temperature of the cloud, assuming these are identical for both states. We verified that our preparation is equivalent for both states by inverting the imaging sequence. We describe our system in terms of pairs and report C, L and R for pairs and pair currents, respectively.
As shown in Fig. 2b, our RLC circuit consists of two capacitors (reservoirs) in series. We replace these two capacitors C by an effective capacitance Ceff = C/2. With this replacement, we obtain a standard RLC series circuit with an initially charged capacitor but no externally applied voltage.
Applying Kirchhoff’s voltage law and charge conservation, we find
Using the mapping Q ↔ ΔN/2 and Ceff = C/2, we obtain
Phase slips and vortices induce nonlinear resistances, so R = R(I) or R = R(J), where I and J denote the pair current and pair-current density, respectively. Depending on the model, we use
for the phase-slip model, and
for the vortex model.
Equations (9) and (10) are then integrated numerically.
Experimentally, transport is initiated by ramping down a blue-detuned beam that blocks the channel. A sudden quench of this beam slightly perturbs the reservoirs, so we instead ramp it down over 10 ms. This introduces an unknown initial condition I(t = 0). For each curve, we fit I(t = 0) ∈ [0, Iavg], where Iavg is the average current during the initial decay (before oscillations). To avoid giving undue weight to the first measured point, we fit ΔNfit(t = 0) ∈ [0.8, 1.2] ⋅ ΔNmeasured(t = 0). These bounds are necessary to prevent the models from ignoring the initial decay outside their validity regime. In particular, this is the case for the LAMH model when fitting data of wide channels, where only a few points represent the initial dynamics.
For numerical stability, R0 and \({\widetilde{R}}_{0}\) are fitted on a logarithmic scale, whereas α and w0 are fitted linearly.
Finally, we discuss the fitting weights. Each configuration (t, w) has five measurements. Points with preparation errors (low atom number) are excluded, typically leaving four to five measurements per point and occasionally three. The experimental standard deviation is calculated for each configuration individually. We assume that for a given w, the uncertainty is independent of t. To prevent the fit from being dominated by points with unrealistically small uncertainties, both the fitting and the \({\chi }_{\nu }^{2}\) calculations replace individual error bars with the median error bar of all the data sharing w.
\({{\boldsymbol{\chi }}}_{{\boldsymbol{\nu }}}^{{\bf{2}}}\) Analysis
The \({\chi }_{\nu }^{2}\) analysis shown in Fig. 2c is performed as follows. The uncertainty of the measured points is assumed to be identical for all points belonging to a specific channel width. For each channel width, the model is fitted, either with 2.5 effective degrees of freedom (R0, w0, ΔN0, I0 or \({\widetilde{R}}_{0},\alpha ,\Delta {N}_{0},{I}_{0}\)), where the first two parameters are shared among four channels (2/4 = 0.5) if the channel participates in the global fit of the respective model, or two degrees of freedom (ΔN0, I0) otherwise. The reduced chi-squared is then calculated using \({\chi }_{\nu }^{2}=\frac{1}{n-m}\sum \frac{{({m}_{i}-{f}_{i})}^{2}}{{\sigma }^{2}}\), where mi are the measured values, fi the corresponding values fitted by the model, σ the uncertainty shared by all measurement points of a specific width, n the number of measured points and m = 2.5 or m = 2 the number of effectively fitted degrees of freedom.
Systematic uncertainties and robustness of the fitted models
We discuss how the fitted models are affected by the various sources of systematic uncertainty. Specifically, we investigate how systematic uncertainties in the capacitance C, the channel width w and the temperature T affect the quality of the model fits and the inferred parameters RLAMH and α.
Uncertainties in capacitance
Assume that the true physical capacitance \(\widetilde{C}\) differs from the calculated value (see section ‘Derivation of the reservoir capacitance’) by a factor γ, such that \(C=\gamma \widetilde{C}\). In our analysis, the effective inductance L is determined (see section ‘Derivation of the inductance’) before fitting the resistance by analysing the underdamped, multi-period oscillations of the system. Owing to the observation of multiple periods, the frequency can be measured with good accuracy and precision. A systematic shift γ ≠ 1 would therefore result in an inverse scaling of the extracted inductance curve, \(L\approx \widetilde{L}/\gamma \), where \(\widetilde{L}\) represents the true physical inductance. Inspecting the underlying equation of motion of the circuit (equation (2)) shows that the extracted resistance scales identically with this factor (R ∝ 1/γ). This uniform rescaling by 1/α can be absorbed in the prefactor R0 or \({\widetilde{R}}_{0}\), leaving the quality of the fits, scalings, the inferred dynamic ranges and the geometric suppression constant w0 entirely unaffected.
Uncertainties in channel width
The geometric potential landscape is projected onto the atoms using a DMD. Although physical pixel spacing and optical demagnification ratio are known accurately, the primary source of spatial uncertainty stems from the finite resolution of the imaging optics. The finite resolution effectively blurs the repulsive potential walls of the channel. Consequently, having to choose where to define the sharp boundaries of the model (spaced by w) within this blurred profile introduces a systematic uncertainty Δw.
Importantly, this geometric uncertainty of roughly 0.5 μm is expected to be shared across all channel configurations and does not affect each channel independently of the others. For channels in the 1D regime, the initial discharge through the narrowest channels is characterized by an extended period of nearly constant current in which inertial forces are negligible (∣L dI/dt∣ ≪ |RI|). In this regime, the system behaves predominantly as a nonlinear RC circuit, approximately decoupling the resistance fit from the precise value of L. Then, a uniform translation of w by Δw alters the resistances by a constant factor. For the LAMH model, \(R(w+\Delta w)\propto \exp (-\Delta w/{w}_{0})\). Similarly to the capacitance error, this effect is entirely absorbed by a re-normalization of the global prefactor R0, preserving both the dynamic range of RLAMH and its slope set by w0. The relatively high value of \({\chi }_{\nu }^{2}\) for the LAMH model might be caused by the experiment that violates the assumption of box-like channel potentials. For the channels in the 2D regime, Δw/w ≪ 1, so we expect systematic effects caused by Δw ≠ 0 to be small and the approximation of modelling the channels as box-like to be safe.
Uncertainties in temperature and atom-pair number
Although we calibrated our measurements with the thermodynamic reference point of Bose–Einstein condensation, our measured atom-pair numbers and temperatures (see sections ‘High-saturation imaging’ and ‘Thermodynamic state extraction by 2D equation of state fitting’) might be subject to systematic errors. An error in the inferred pair-number \(N=\gamma \widetilde{N}\), where N is the inferred particle number and \(\widetilde{N}\) is the physical particle number, would force a corresponding shift in C, thereby rescaling L and R as discussed above. Moreover, it would rescale I. As the current enters the expression for the resistance in the vortex model only in the form of a power law, it would merely shift \(\widetilde{R}\) by a constant factor γ−α. Again, this constant factor would affect neither α, nor the quality of the vortex-model fits, nor the quality of its scaling law. As the vortex model does not contain an explicit temperature dependence, it is unaffected by potential systematic effects in T. For the LAMH model, the situation is different. The temperature enters the model explicitly through I0 = 2kBT/h. Variations in both N and T ultimately tie into the ratio I/I0. Because this ratio controls the degree of nonlinearity of the circuit, we can model their combined systematic impact by analysing variations in I0 alone.
The initial discharge of the narrowest channels is distinctly nonlinear (implying I ≫ I0), whereas the subsequent oscillations are approximately sinusoidal (implying I ≱ I0). Consequently, the ratio I/I0 is constrained by the geometric profile of the relaxation curves. However, systematic effects that affect the ratio I/I0 do also affect the quality of fit and the dynamic range of RLAMH. In general, if I/I0 is lowered (by decreasing I or increasing T), the circuit is less nonlinear and the dynamic range of RLAMH decreases, whereas an increase in the ratio has the opposite effect. Although the parameter I0 is constrained in the LAMH model, we performed additional fittings, where I0 was a global fit parameter, to effectively account for potential systematic errors in I or T. The best fits are achieved with I0,fit = 3.50(1)I0, reducing \({\chi }_{\nu }^{2}\) averaged over the five narrowest channels, by more than a factor of 2. A possible cause for this could be that the attractive Gaussian beam illuminating the channel locally heats the channel, thereby increasing I0. Note that this beam also increases the local degeneracy such that we would still expect the channel to be deeply degenerate. Although in the case of fitted I0, the dynamic range of RLAMH is reduced, it continues to span more than four orders of magnitude. The values are still in good agreement with the predicted exponential scaling.
Derivation of the reservoir capacitance
The capacitance of the reservoirs is fundamentally related to their compressibility36. This connection stems from the analogy between the atomic transport system and an electrical RC circuit, in which the compressibility serves as the neutral analogue of electrical capacity. The compressibility of a single reservoir κ is defined as
where N is the particle (in our case pairs) number, μ the chemical potential and T the temperature of the reservoir. For the full transport system consisting of two reservoirs connected in series, the effective circuit capacitance is given by the series combination \({C}_{\mathrm{eff}}={({C}_{{\rm{L}}}^{-1}+{C}_{{\rm{R}}}^{-1})}^{-1}\). As mentioned in section ‘RLC circuit modelling and fitting’, we measure only the atom number in one hyperfine state, so we use \(C\leftrightarrow \partial {N}_{|1\rangle }/\partial \mu ={\kappa }_{|1\rangle }\).
High-saturation imaging
To determine the thermodynamic state, we use absorption imaging with intermediate intensities (I/Isat ≈ 1−2) and a high-quantum-efficiency CCD camera45. The column density is reconstructed using the modified Beer–Lambert law to account for saturation effects:
where σ0 = 3λ2/2π is the resonant scattering cross-section, I is the transmitted intensity, I0 is the incident intensity and Isat is the saturation intensity.
Thermodynamic state extraction by 2D equation of state fitting
To determine the thermodynamic state of the reservoirs, we perform a two-dimensional fit to the reconstructed column density ncol(y, z) (ref. 45). We assume the gas is in the unitary limit (1/kFa → 0) and in local thermodynamic equilibrium.
Under the local density approximation, the local three-dimensional density n(r) is determined entirely by the local dimensionless chemical potential q(r) = μ(r)/(kBT) through the universal function fn(q). In a harmonic trap, the local potential reads q(r) = q0 − ∑(ri/Ri)2, where q0 is the central degeneracy and Ri are the thermal radii.
The experimental signal is the column density integrated along the line of sight (x-axis). Integrating the universal density distribution yields the following fitting function45:
Here, \({N}_{0}(\widetilde{q})\equiv {\int }_{0}^{\infty }{\rm{d}}u\,\sqrt{u}{f}_{n}^{{\prime} }(\widetilde{q}-u)\) is the calculated line-of-sight integral of the universal density function.
Although the ratio of the thermal widths Ry/Rz is theoretically fixed by the trap aspect ratio ωz/ωy, we treat Ry and Rz as independent free parameters in the fit. This degree of freedom accounts for small drifts in the transverse confinement or slight anharmonicities in the optical potentials. This approach ensures that the temperature T remains robust against minor distortions in the transverse direction (z).
Using the fitted q, the equation of state of the unitary Fermi gas allows us to determine T/TF directly from the second moment of the universal density function46
Alternatively, the temperature can be extracted primarily from the fitted width along the transport axis (Ry):
These two methods yield very similar values, with discrepancies comparable to or smaller than the uncertainty arising from the shot-to-shot fluctuations in T/TF reported in the main text. Another, theoretically valid approach would be to infer the temperature using the analogue expression (21) along the z-direction (replacing ωy → ωz, Ry → Rz). However, this is experimentally unfavourable, as the trapping frequency along the tighter z-direction is measured with a larger uncertainty.
The chemical potential is determined from the fitted degeneracy parameter:
This procedure yields the properties of an ‘extrapolated reservoir’—the hypothetical full harmonic reservoir that would exist in the absence of our wall beam used to separate our harmonic trapping potential into two approximately half-harmonic reservoirs.
Although μ and T are best determined from the fit to the harmonic wings, the total atom number N is sensitive to the depletion caused by the wall. Therefore, rather than using the analytic integral of the fit (which would overestimate N, as it assumes the region depleted by the wall beam is filled with atoms), we compute N by numerically integrating the measured column density over the region of interest:
Calculation of the capacitance
With the thermodynamic coordinates (q, T) of the reservoir established from the fit, we compute the capacitance.
It is important to distinguish between the absolute atom number N and the differential capacitance κ. For the absolute atom number (equation (23)), we rely on numerical integration of the image because the presence of the wall beam approximately halves the relevant volume of the cloud. However, for the capacitance (κ = ∂N/∂μ), performing a numerical derivative on the noisy integrated signal would yield an unstable result. Instead, we model the reservoir thermodynamically as a ‘half-harmonic’ trap defined by the fitted parameters (μ, T). We assume that the intensive properties are determined by the bulk wings, whereas the extensive properties (such as N and κ) are exactly half that of a full harmonic trap because of the wall constraint.
To derive this analytic capacitance, we begin with the theoretical expression for the total atom number Ntheo in a ‘half-harmonic’ trap (integrating over only half the space). This introduces a factor of 1/2 compared with the full harmonic result:
where \(\bar{\omega }\) is the geometric mean trapping frequency.
The compressibility is then defined as the derivative of this theoretical atom number with respect to the chemical potential μ at constant T. We apply the chain rule using the relation q = μ/(kBT), which implies \(\frac{\partial }{\partial \mu }=\frac{1}{{k}_{{\rm{B}}}T}\frac{\partial }{\partial q}\):
The factor of 1/kBT reduces the power of the temperature prefactor from 3 to 2. Furthermore, because the chemical potential enters only through the argument of the density function fn(q − u), the derivative ∂/∂q passes inside the integral and acts directly on fn. This yields the final expression for the compressibility of a single reservoir for a single spin component:
where σ1,3 indicates which spin is considered, {L,R} indicate the left and right reservoirs and N0(q) is the dimensionless compressibility integral defined as
Here, \({f}_{n}^{{\prime} }(x)\) denotes the derivative of the universal density function. The value of N0(q) is computed numerically using the known equation of state for the unitary gas at the experimentally determined degeneracy q (ref. 47). We define \({\kappa }_{{\rm{L}},{\rm{R}}}={\kappa }_{{\rm{L}},{\rm{R}}}^{{\sigma }_{1}}+{\kappa }_{{\rm{L}},{\rm{R}}}^{{\sigma }_{3}}\), the total compressibility of the left and right reservoirs. Now we model the reservoirs using a circuital analogy, where each reservoir is characterized by a capacitance CL,R = ∂N/∂μ ≡ κL,R, as shown in Fig. 2b, describing the particle number change in response to a shift in chemical potential. Using equation (27), we can compute the total capacitance of our system. As the two reservoirs are in series, the total capacitance of the system is
Note that for the analysis presented in the main text, the exact value of C is of limited importance (see section ‘Systematic uncertainties and robustness of the fitted models’).
Derivation of the inductance
For all channel widths except the narrowest one, we observe underdamped, long-lived oscillations. As these oscillations remain underdamped, the influence of the nonlinear resistance on the oscillation frequency is expected to be small. To extract the inductance of the channel for each width (except the narrowest one), we exclude the initial transient dynamics up to the first, global minimum occurring at a time t = t1,w. The remaining data are fitted with a damped sinusoidal function \({f}_{w}(t)={A}_{w}\exp (-(t-{t}_{1,w})/{\tau }_{w})\sin ({\omega }_{w}t+{\phi }_{{\rm{w}}})+\Delta {N}_{w,\mathrm{offset}},\) where Aw, τw, ωw, ϕw, and ΔNw,offset are fitting parameters. Small offsets |ΔNw,offset| < 0.018 account for potential alignment errors that cause the oscillations to centre around slightly nonzero values. Using the inferred effective capacitance Ceff of our circuit (see section ‘Derivation of the reservoir capacitance’), we determine the total inductance for a given channel width as \({L}_{w}=1/(({\omega }_{w}^{2}+{\tau }_{w}^{-2}){C}_{\mathrm{eff}})\approx 1/({\omega }_{w}^{2}C),\) where the approximation is equivalent to the result for an undamped LC circuit and holds for weakly damped circuits. Although the quantitative difference in our case is minute, we do include the τ-term capturing the effect of the resistance lowering the oscillation frequency of the RLC circuit. Note that for the wide channels in particular, fitting a damped sine to the oscillatory data is a pragmatic choice that allows for an approximation of the inductance, the signature of which is primarily contained in the frequency of the oscillation. Over extended periods of time, however, the damped sine and the dynamics of the vortex model would appear different, as the latter does not feature an exponentially decaying amplitude. This kinetic inductance Lw quantifies the kinetic energy associated with a given pair current I. Although the main contribution arises from the transport channel itself, there is also a residual contribution because of particle motion in the adjoining 2D and 3D regions, whose geometries are independent of the channel width. We therefore write \(L(w)={L}_{\mathrm{channel}}(w)+{L}_{\mathrm{res}}\). Assuming a constant particle density inside the channel, the mass of particles in the transport channel (M) scales with its width, M ∝ w. For a given current, the corresponding particle velocity in the channel thus scales inversely, \({v}_{\mathrm{channel}}\propto \frac{1}{w}\). Consequently, the kinetic energy associated with a fixed I scales as \({E}_{\mathrm{kin}}=M{v}_{\mathrm{channel}}^{2}/2\propto w{(1/w)}^{2}=1/w\), implying that Lchannel(w) ∝ 1/w. We therefore model the total inductance as
with fitting parameters ℓc and Lres. We find ℓc/h = 3.01(3) × 10−5 μm s and Lres/h = 3.06(4) × 10−6 s, where the uncertainties represent the standard errors of the fit. The measured inductances Lw and the fitted model are shown in Extended Data Fig. 1. The excellent agreement of the model with the data validates our model assumptions.
Estimate of ξ
In a previous, comparable experimental setting, we estimated the atoms traversing a region of length d ≈ 3 μm in a time t ≈ 330 μs, resulting in an estimated atomic velocity of v ≈ 9 mm s−1 (ref. 48). As our channel is practically defect free, we assume that the atomic velocity is close to the critical velocity vc. So we estimate 4ξ ≈ 4ħ/(mvc) ≈ 5 μm (ref. 49).
Error estimation in energy measurement
Given the method with which we extract the energy ratio, two main sources of error are to be considered. The first one is the statistical noise of the measurement points. This directly translates into an uncertainty of the inferred energy ratio but also causes a systematic bias towards higher values, as only the extrema of the signals are considered. The second contribution comes from the finite sampling rate of the oscillations. This causes an uncertainty and a bias towards lower values, as the measured points do not sample the peaks exactly. To quantitatively assess their influence for all our measurements, we performed Monte Carlo simulations. Specifically, we sampled sinusoidal signals with the frequencies, amplitudes and dampings observed in the signals used for Fig. 4. We sampled these artificial signals with the sampling rates and statistical noise that occurred in the physical experiment. This simulation yielded the following insight: For the data presented in Fig. 4, the inferred energies have a typical positive bias of 0.5% and a standard deviation smaller than 2%.
No Josephson oscillations
Although several studies have reported on Josephson oscillations with seemingly similar measurements in comparable settings27,28,29, our system operates far outside the Josephson regime. The Josephson effect requires the junction length to be much shorter than the superconducting coherence length, which for our system is close to the healing length4,12. In our case, the channel length ℓ = 27 μm is much larger than the estimated healing length ξ ≈ 1.2 μm (Methods, ‘Estimate of ξ’). Moreover, we observe neither a well-defined current-phase relation nor an oscillation amplitude consistent with the Josephson relation. The former statement is based on time-of-flight measurements of the relative phase of the two reservoirs with the same preparation performed in a slightly different geometry. Although for the data shown in this manuscript, we always observe the same initial dynamics (up to small noise), these additional measurements confirm that the prepared phase between the two reservoirs is not controlled, sampling values between 0 and 2π from a flat distribution. We therefore conclude that the oscillatory signal observed in our experiment cannot be attributed to JO.
Vortices in a finite width
Here, we outline the calculation of the current–voltage (I–V) characteristics of the XY-vortex model in a planar geometry that is periodic along the x-direction, with width w in x and infinite extent in y. The evaluation of the vortex–antivortex potential in the finite geometry closely follows ref. 5.
We begin by considering the circulation of the gradient of the phase, which is given by
where we parametrize the phase gradient u as a smooth and a topological part u = ∇θ − ∇ × (ezψ), respectively. Here, n is the total vorticity enclosed by the circulation. This can be parametrized as
where \({n}_{i}\in {\mathbb{Z}}\) corresponds to the vorticity of the vortex at position ri. With this in mind, it is now clear that the energy due to vortex–vortex interaction can be obtained by the superposition principle once the Green’s function is known. Therefore, we have to solve for
in the aforementioned geometry. This is easily achieved by using the following Ansatz:
and after solving for each m, we arrive at
This equation can be simplified employing the following identity:
The energy due to the presence of vortices in this geometry is given by
where K is the dimensionless superfluid stiffness. We are interested in computing the production rate of vortex–antivortex pairs in the presence of an applied current along the y-direction, with current density J.
To compute the equilibrium separation between a single vortex–antivortex pair, it is enough to set y − y′ = 0, such that the energy of the pair to be at a distance x apart is
where F ∝ J is the Magnus force that arises due to the current going through the system. The distance x* at which the pair potential reaches its maximum corresponds to the location of the energy barrier that must be overcome to unbind a vortex–antivortex pair. It is obtained by extremizing the pair potential U(x) with respect to x, that is, by solving
This result holds as long as xeq ≳ ξ, the healing length. The energy barrier needed to overcome the confinement barrier is thus roughly given by U(xeq) and the unbinding rate \(\varGamma \propto \exp (-U({x}_{{\rm{e}}{\rm{q}}})/T)\propto \) \({\left[1-\cos \left(2{\cot }^{-1}\left(\frac{Fw}{2{{\rm{\pi }}}^{2}K}\right)\right)\right]}^{-{\rm{\pi }}K}\approx {\left(2/{\left(\frac{Fw}{2{{\rm{\pi }}}^{2}K}\right)}^{2}\right)}^{-{\rm{\pi }}K}\), where the last approximation is valid for sufficiently large w. The voltage is then proportional to the current density and the number of free vortices. As Γ is the rate of vortex–antivortex pair unbinding, the number of free vortices in the system scales as nF ∝ Γ1/2. Hence,
where we have used that the Magnus force is proportional to the current density F ∝ J. Using Ohm’s law, V = RJw, and substituting α = πK + 1 > 1 we find
Note that the effective stiffness K of our finite, inhomogeneous channel is not known independently and is obtained from the fit presented in the main text, yielding α = 1.98(4) and K = 0.31(1).
Breakdown of scaling laws
Extended Data Fig. 2 provides additional data related to Fig. 3. The theoretical motivation and the \({\chi }_{\nu }^{2}\) analysis presented in Fig. 2 already justify the choice of models. The data shown here complements that analysis by demonstrating that the scaling laws reported in Fig. 3 are not numerical artefacts and are not imposed by the fitting procedure.
For both the LAMH and vortex models, the predicted scalings break down outside their respective ranges of validity. This behaviour indicates that the observed scaling is not a numerical consequence of the fitting procedure and is not artificially enforced by the functional form of the models.
The saturation of the LAMH-inferred resistance at large widths does not seem to be due to limited fitting precision, fitting boundaries or lack of convergence. Instead, it reflects a transition from the strong exponential width dependence characteristic of the LAMH model to a much weaker dependence, as predicted by the vortex model.
For the vortex model, the trend reverses in the crossover regime, showing a clear deviation from the scaling expected by that model.