 Newshot
Main
Integrated photonic devices have emerged as a powerful platform for the next-generation information technologies, and the development of efficient and scalable integrated photonic circuits has become a central focus of state-of-the-art research. Photonics enables ultrafast signal propagation, low-loss transport, broadband modulation and highly efficient information processing6,7. In this context, it is crucial that the same architecture supports a variety of integrated components, including on-chip coherent light sources, frequency-comb generators, modulators, amplifiers and switches, enabling coherent phase manipulation of propagating optical fields as a key functionality for dynamical reconfigurability and interferometric-based operations.
However, the effectiveness of all-optical devices depends critically on the ability to harness optical nonlinearities. As conventional platforms based on linear dielectric materials or lithium niobate (LiNbO3) show intrinsically weak nonlinear responses8,9, structures supporting exciton–polaritons have been proposed as an effective alternative. These hybrid light–matter excitations, formed under non-perturbative radiation coupling between excitons and purely photonic eigenmodes, combine photon-like propagation with strong optical nonlinearities, making them attractive for ultrafast all-optical information processing10,11,12,13. Although exciton–polaritons have been extensively studied in vertically confined microcavities, planar architectures such as polariton waveguides14,15,16,17 have recently attracted increasing interest owing to their ability to confine light within smaller modal volumes, thereby enhancing exciton–photon coupling, increasing polariton group velocities and facilitating on-chip integration. When combined with suitable active materials showing large exciton binding energies, polariton operation can be sustained at room temperature5, a condition fulfilled by perovskites, which stand out for their exceptional and tunable optoelectronic properties and ease of processing, eliminating the demanding fabrication procedures typically required for conventional semiconductors. In addition, their strong polariton nonlinearities, comparable to that of gallium arsenide (GaAs)-based systems, makes them an increasingly attractive platform for polariton-based applications at room temperature18,19,20,21. However, fabricating high-quality perovskite photonic components remains challenging because well-defined edges and smooth surfaces are essential for achieving satisfactory performance22,23,24, whereas conventional postprocessing often degrades the crystal morphology and optical quality. Despite recent progress, efficient in-coupling and out-coupling of light remains a main bottleneck. In particular, the realization of coherent on-chip tunable light sources, optical amplification of propagating polariton signals and efficient nonlinear phase control—only partially explored in planar microcavities under cryogenic conditions25 and still absent in guided propagating polariton systems—remains a key outstanding challenge. Overcoming these limitations is crucial to achieving robust, room-temperature, scalable and fully integrated nonlinear photonic devices.
Here we address these critical challenges by developing a fully integrated perovskite-based polaritonic circuit in which waveguides and grating couplers are simultaneously defined within the active materials using an innovative bottom-up soft-lithographic strategy that combines surface-tension-assisted and microfluidic growth processes26,27,28. This growth approach eliminates the need for any subsequent postprocessing, enabling the direct integration of hundreds-of-micrometres-long, micrometre-wide caesium lead bromide (CsPbBr3) waveguides with subwavelength gratings featuring tunable periodicity and filling factors. Under off-resonant pumping, the integrated gratings provide longitudinal optical feedback, enabling polariton lasing in an in-plane Fabry–Pérot cavity, with emission efficiently propagating along the waveguide and readily tunable by means of the grating geometry. We also demonstrate efficient optical amplification in a two-beam experiment, in which a resonantly injected propagating polariton wavepacket is amplified through stimulation from the exciton reservoir created by an extra off-resonant beam. The threshold-like amplification resembles key features of spiking neurons, offering a promising route towards the development of neuromorphic polariton devices29,30. In parallel, we achieve nonlinear optical phase control of propagating polariton signals, enabling interferometric functionalities with phase shifts reaching 2π. Our results demonstrate room-temperature polaritonic circuits with active nonlinear functionalities, marking an important step towards ultra-compact, highly nonlinear polariton devices for integrated photonics and optical information processing.
Integrated CsPbBr3 polaritonic waveguides
CsPbBr3 perovskite waveguides with various geometries were directly fabricated on glass substrates using a modified soft-lithography approach that combines surface-tension-driven lithography with microfluidic processing from a liquid precursor solution, following the procedure sketched in Fig. 1a and detailed in the Methods (Supplementary Figs. 1–4). The process uses a patterned polydimethylsiloxane (PDMS) replica moulded from a silicon master (Fig. 1b), yielding the perovskite waveguides with integrated gratings shown in Fig. 1c–e. This hybrid method enables the direct formation of hierarchical architectures through controlled self-assembly under saturation conditions and controlled temperature, yielding micrometre-scale waveguides decorated with integrated nanometric grating arrays. The soft-lithography route overcomes key limitations of conventional fabrication by exploiting elastomeric replication, enabling a simple, low-temperature and non-destructive process. It eliminates the need for multi-step lithography, avoids postprocessing damages and refractive-index mismatches, while significantly reducing fabrication cost and time.
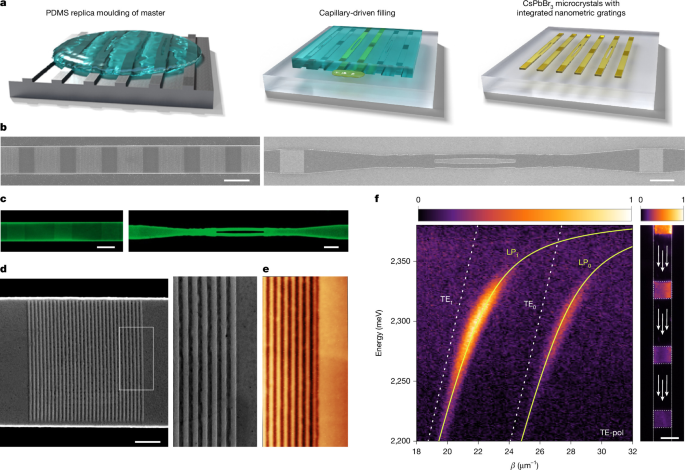
a, Schematic illustration of the fabrication process of CsPbBr3 waveguides by means of microfluidic surface-tension-driven lithography. The process follows three main steps: (1) replica moulding in PDMS of the waveguide master (left); (2) capillary-driven distribution of the precursor solution along the microstructured channels under saturated conditions and controlled temperature (centre) and (3) formation of CsPbBr3 microcrystals with the desired morphology and integrated nanometric optical gratings (right). b, Scanning electron microscope (SEM) images of representative waveguides with integrated optical gratings fabricated on the silicon master through electron-beam lithography (EBL). c, Confocal images of CsPbBr3 perovskite waveguides with integrated gratings produced by the modified single-step soft-lithography technique described in a. Its features reproduce closely those fabricated in the master. d, SEM image showing a complete grating coupler directly replicated onto the CsPbBr3 perovskite structure. Right inset shows high-resolution view of the grating from the white region in the left panel. e, High-resolution atomic force microscopy (AFM) measurement of a representative grating. f, TE-pol momentum-space photoluminescence map from one of the waveguide gratings. Here β denotes the waveguide momentum, related to the measured outcoupled wavevector by β = k ± 2π/a, where a is the grating pitch. For this specific grating, the pitch was measured to be 240 nm. Two polariton modes (yellow solid lines) are visible and marked as LP0 and LP1, respectively. The two polariton modes arise from strong coupling between two photonic modes (TE0 and TE1, white dashed lines) and the excitonic resonance. Right panel, real-space photoluminescence image of the waveguide in which the emission from several adjacent gratings is visible; the pumping spot is outside from the image in the top part. LP, lower polariton; TE-pol, TE-polarized. Scale bars, 10 μm (b,c,f); 2 μm (d).
To investigate the optical properties of the fabricated structures, we performed momentum-resolved photoluminescence and reflectivity measurements (Methods). The corresponding maps for both transverse-electric (TE) and transverse-magnetic (TM) polarizations and different pitches are shown in Supplementary Figs. 5–7. The momentum-resolved photoluminescence, obtained by spatially selecting the emission from one grating, is shown in Fig. 1f for TE polarization. Two strongly coupled modes are clearly visible (yellow solid lines), which we attribute to the fundamental (TE0) and first-order (TE1) lower polariton waveguide modes. Although the upper polariton branch is not visible31,32,33, the characteristic dispersion of the waveguide modes, which is approximated as linear in the weak coupling regime (white dashed lines), shows an increasing bending approaching the exciton resonance, providing clear evidence of the strong radiation-matter coupling. Reflectivity and photoluminescence data were fitted using a two-coupled-oscillator model yielding Rabi splitting energies of Ω = 140 ± 10 meV for both the TE1 and TE0 modes (Supplementary Figs. 5 and 6), consistent with previous reports23,34. The presence of these two modes is compatible with a waveguide thickness ranging between 250 nm and 290 nm, as confirmed by finite-difference time-domain simulations presented in Extended Data Fig. 1 for different grating pitches. It is important to note that the TE1 mode appears brighter because one of its electric-field maxima lies closer to the top surface of the waveguide, where the grating is patterned, resulting in more efficient coupling to free-space radiation and a larger momentum-space linewidth. The typical real-space photoluminescence emission is shown in the right part of Fig. 1f and the exciton/photon fraction for LPB1 is reported in Supplementary Fig. 8.
Engineered on-chip polariton lasing
In the absence of external optical resonators, lasing in perovskite microstructures can arise from optical feedback provided by sharp crystal facets acting as Fabry–Pérot cavities.23,24,35,36. In waveguide geometries, this feedback occurs predominantly in the transverse direction23, thus proving ineffective for photonic integrated circuits, which normally demand longitudinal propagation. Moreover, this lasing emission lacks spectral tunability, as it is governed by the intrinsic balance between optical gain and loss within the material. Alternative strategies based on isolated perovskite blocks evanescently coupled to active waveguides24 can promote in-plane propagation, but are limited by weak field overlap and inefficient coupling. Longitudinal polariton lasing assisted by integrated grating reflectors was demonstrated in a GaAs-based waveguide at cryogenic temperature17 and in gallium nitride (GaN)-based waveguide at room temperature37. However, in these systems the lasing mode remains confined within the reflective elements, without efficiently coupling into a propagating waveguide mode. By contrast, our approach integrates tunable lasing emission within a guided architecture, providing a direct route towards integrated polaritonic circuits. Moreover, it is achieved through a simple, scalable growth process yielding waveguides with embedded couplers, unlike the more complex fabrication required for GaAs or GaN platforms.
To verify the formation of such a longitudinal optical feedback, the perovskite waveguide was off-resonantly pumped between two couplers. The real-space TE-polarized photoluminescence maps at excitation powers (P) below (left) and above (right) the lasing threshold (Pth) are shown in Fig. 2a. At low pumping power, the two outcouplers are barely visible, as only a relatively small portion of the emitted light is effectively coupled into the waveguide modes. By contrast, at high excitation power, a pronounced signal emerges from both outcouplers, suggesting that a longitudinal feedback is taking place. Notably, the lasing signal extracted from the grating disappears in TM polarization (Supplementary Fig. 9), confirming the polarization sensitivity of the feedback mechanism. To further investigate the onset and evolution of the lasing emission, we performed a real-space energy-resolved measurement and evaluated the emitted intensity (Extended Data Fig. 2) collected from one of the two outcouplers for the lasing signal (integrated between 2.31 eV and 2.32 eV), as shown in Fig. 2b. A clear threshold is observed at roughly Pth = 55 µJ cm−2, consistent with previous reports on similar perovskite materials19,35,38,39. The transition is accompanied by a clear linewidth narrowing as reported in the inset. The energy-resolved momentum-space maps are shown in Fig. 2c for the below-threshold (left panel) and above-threshold (right panel) regimes, and the corresponding kx–ky maps are reported in Supplementary Fig. 10.
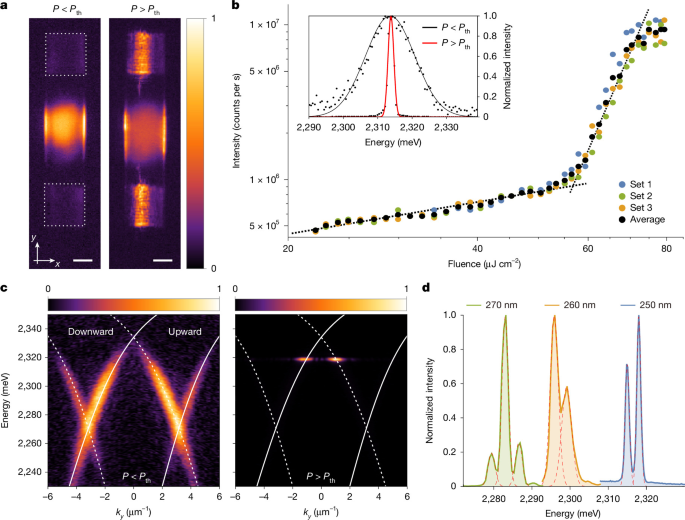
a, Real-space image of a Fabry–Pérot in-plane cavity formed by two gratings (highlighted by the dashed squares); below threshold (left) the emission is dominated by exciton recombination under the pump spot, whereas above threshold (right) the lasing mechanism takes place and the emission from the two gratings is stronger than the photoluminescence not coupled to the guided mode. b, Emitted intensity integrated at the grating position from real-space energy-resolved measurements as a function of pumping fluence. Data points are obtained from three consecutive power-dependence measurements performed on the same structure as shown in blue, green and orange dots. The black points represent the average of the three power-dependence measurements. Dashed black lines are guides for the eye. The inset shows the linewidth below (black line) and above threshold (red line) obtained from energy-resolved momentum-space measurements. c, Corresponding energy-resolved momentum-space emission below (left) and above threshold (right). The white dashed lines indicate the TE0 and TE1 polariton modes propagating downward (dashed lines) and upward (solid line). d, Lasing emission from three different cavities formed by couples of gratings having different pitches (270 nm, 260 nm and 250 nm, respectively); when the pitch is modified the energy of the lasing energy shifts. Scale bars, 5 μm.
Lasing occurs where longitudinal feedback selects a single mode due to the balance between gain and losses taking place at the reflectivity maximum induced by the grating, where losses are minimal. This point38,40 is slightly red-shifted and momentum-shifted with respect to the bandgap because finite-size and thickness variation in the grating profile cause new loss-favoured grating-to-waveguide backreflections15, as discussed in Supplementary Fig. 11. Lasing modes show a clear blueshift with increasing power, and more Fabry–Pérot modes emerge within the same spectral region (Extended Data Fig. 3). Notably, our configuration does not rely on large reflectivity or a strongly developed stop band; rather, a small but finite reflectivity is sufficient to enable cavity formation and mode selection, owing to the excellent gain properties of CsPbBr3. To demonstrate the spectral tunability of the lasing emission, we have tuned the periodicity within the integrated couplers by keeping their mutual distance constant. As shown in Fig. 2d, for three different grating geometries with pitches of 270 nm, 260 nm and 250 nm, a progressive blueshift is induced from roughly 2.28 eV to 2.315 eV. The below-threshold and above-threshold dispersions for all the measured gratings are reported in Extended Data Fig. 4. It is important to note that in the present device geometry, longitudinal feedback from the grating couplers coexist with transverse feedback from the waveguide edges. Above-threshold spatially resolved measurements confirm this coexistence, showing a roughly doubled mode spacing for edge emission, consistent with two cavity lengths of roughly 25 μm and 10 μm, respectively (Extended Data Fig. 5 and Supplementary Fig. 12). Efficient propagation of the lasing signal along the waveguide allows its collection from the first outcoupler next to the grating-pair cavity element (Extended Data Fig. 6). From these data, together with further resonant propagation measurements, we estimate propagation losses, outcoupler attenuation and optical gain (Supplementary Figs. 13 and 14).
Optical amplification of propagating polaritons
In the following section we demonstrate another key functionality of our system: the optical amplification, which has not been previously achieved in similar polaritonic platforms at room temperature. This is essential for integrated photonic circuits as it compensates for propagation and coupling losses, thus enabling efficient on-chip light transport. We resonantly injected a pulsed beam (signal) through the input grating on the LPB1 mode and monitored the transmitted signal at the output located 25 µm away. A second pulsed beam (amplifier) was off-resonantly exciting the centre of the waveguide between two outcouplers where it generates an incoherent exciton population, as schematically shown in Fig. 3a. The signal beam was kept in the linear regime, thereby avoiding self-phase-modulation effects41 (Supplementary Fig. 15). We recorded the output intensity by scanning the time delay between the two pulses, keeping the signal with a constant intensity and changing the fluence of the amplifier. Figure 3b shows the collected intensity as a function of time delay for three different amplifier fluences, 3 μJ cm−2, 20 μJ cm−2 and 38 μJ cm−2, indicated by the blue, orange and green curves, respectively (Methods). At low pump fluences, the output signal remains unchanged, whereas at higher amplifier fluences it is strongly enhanced at 0 delay (Δt = 0 ps) and then decays within roughly 50 ps, demonstrating amplification once a sufficient particle density is reached. The decay follows a single-exponential fit with a characteristic time of 20.5 ± 1.2 ps, more than 1 order of magnitude shorter than the bare photoluminescence decay (Supplementary Fig. 16). To further explain the effect, power-dependent measurements at Δt = 0 ps were performed, as shown in Fig. 3c. Here the bottom panel represents the photoluminescence intensity generated by the off-resonant amplifier alone, which increases quadratically with pump fluence (Supplementary Fig. 17), whereas the top panel corresponds to the intensity measured in the presence of both the signal and the amplifier beams, showing clear amplification with a marked threshold-like behaviour. This trend confirms optical amplification and is consistent with stimulated emission, where the probe stimulates particles from the incoherent exciton reservoir created by the amplifier, possibly assisted by acoustic phonons, recently shown to play a key role in perovskites42. The amplification threshold is found to occur at roughly Pth,Amp = 10 μJ cm−2, that is, well below the lasing threshold.
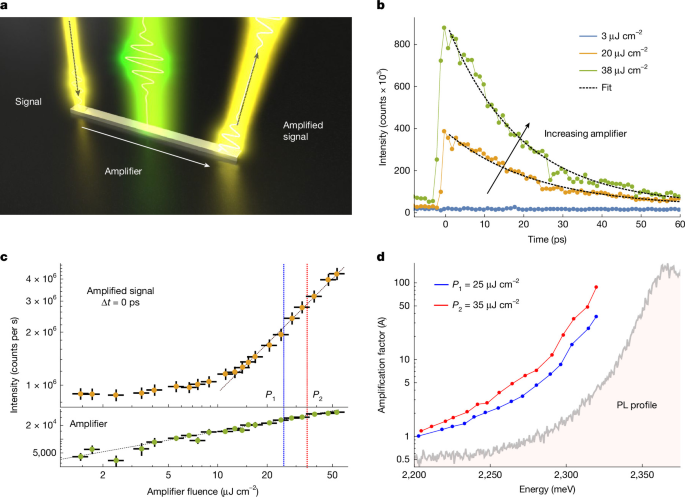
a, Sketch of the integrated optical circuit used to measure polariton amplification: the off-resonant beam (amplifier) creates an exciton reservoir whereas the resonant beam (signal) excites a polariton state propagating along the waveguide. At the output grating the signal is amplified (amplified signal) thanks to stimulation from the exciton reservoir. Amplifier energy is Eamplifier = 2.58 eV in all the measurements. b, Collected intensity of the amplified signal as a function of time delay for three different amplifier fluences, 3 μJ cm−2, 20 μJ cm−2 and 38 μJ cm−2; black dashed line indicate the exponential fit. The signal energy is Esignal = 2.31 eV. A positive Δt corresponds to the case in which the signal arrives after the non-resonant pump, allowing amplification to take place while the reservoir is present. The decay time, 20.5 ± 1.2 ps, is the average of the exponential-fit values obtained at pump fluences of 20 μJ cm−2 and 38 μJ cm−2, which yield 22.1 ± 1.4 ps and 18.8 ± 0.9 ps, respectively. c, Power-dependent measurements at time delay 0 ps. Bottom: green dots represent the intensity of the amplifier alone; top, orange dots show the intensity of the amplified signal as a function of the amplifier fluence. The signal energy is Esignal = 2.26 eV. The horizontal error bars represent the power fluctuations of the amplifier, whereas the vertical error bars reflect the standard deviation derived from the signal evaluation across slightly different spectral regions, providing an estimate of the systematic uncertainty. d, Amplification factor as a function of the signal energy for two different amplifier fluences (P1 = 25 μJ cm−2 and P2 = 35 μJ cm−2) as indicated in c by the blue and red dashed lines. The amplification closely follows the photoluminescence spectral profile, increasing with the photoluminescence intensity. The photoluminescence spectrum, shown in arbitrary units, is included for qualitative comparison.
To test the spectral efficiency, we selected two amplifier fluences (P1 and P2, blue and red dashed vertical lines in Fig. 3c), both kept between the amplification and the lasing threshold, and scanned the signal energy, keeping its fluence constant. Figure 3d shows the amplification factor as a function of the signal energy, defined as \(A=\frac{({S}_{{\rm{out}}}-{A}_{0})}{{S}_{0}}\), where Sout is the total output signal, and A0 and S0 are the independently measured amplifier and signal contributions, respectively. Clear amplification is observed over a broad energy range, with a superlinear dependence on signal energy and increasing spectral efficiency due to more efficient scattering and reduced group velocity, which enhances the interaction time with the reservoir. Crucially, amplification is observed even at energies well outside the narrow spectral region where lasing occurs (Supplementary Fig. 18) thus ruling out a cavity-mode feeding mechanism, which would instead be confined to the narrow spectral region defined by the lasing modes. In Supplementary Fig. 19, we present representative real-space maps of the signal, the amplifier and the amplified signal. Moreover, at the highest signal energy for which propagation is still sustained in the system the amplification factor approaches two orders of magnitude. Taking into account the spatial extension of the reservoir (Supplementary Fig. 18), we estimate the optical gain within a simple one-dimensional model as g = ln(A)/L, where A is the measured amplification factor and L is the effective interaction length, approximated by the amplifier full-width at half-maximum (13–15 µm). This yields values in the range of 5 × 10²–3 × 103 cm−1 depending on the signal energy. Moreover, above the lasing threshold, the amplified signal saturates (Extended Data Fig. 7), consistent with reservoir depletion induced by the self-oscillating mode. Combining room-temperature operation with liquid-phase synthesis, our results represent a great advance over GaAs-based or ZnO-based platforms, which instead require cryogenic operation and demanding epitaxial growth16,43. In addition, the strong-coupling regime enables amplification through bosonic stimulation rather than population inversion, allowing operation at lower pump powers than conventional gain media.
All-optical phase control of propagating polaritons
We then exploit the complex geometries enabled by our fabrication approach to demonstrate nonlinear phase control in a guided polariton system. A resonant signal beam (Eres = 2.265 eV) is injected through the input grating, propagates along the structure and is subsequently split into the two arms of an interferometric Y-splitter. At the end of each arm, the waveguide edges act as outcouplers, allowing for the formation of an interference pattern in the momentum space, directly accessing the relative phase difference between the two arms. A non-resonant pulse is then introduced in only one arm of the Y-splitter. A schematic of the configuration is shown in Fig. 4a, and the reflectivity image of the Y-splitter termination and the corresponding outcoupled signal are shown in Fig. 4b. A representative momentum-space map recorded with only the propagating signal shows the expected interference pattern (Fig. 4c), whose origin is confirmed by selectively removing one output from the detection path (Supplementary Fig. 20). We then monitor the interference fringe shift as a function of the phase-shifter pulse energy at zero delay Δt = 0 ps between the optical shifter and the propagating signal beam. As shown in Fig. 4d, where the intensity profile along kx is plotted as a function of the optical-shifter fluence, a pronounced shift is generated. The phase shift, extracted from sinusoidal fits of the interferograms, reaches up to 2π with increasing pump pulse energy (Fig. 4e). As a consistency check, moving the phase-shifter beam to the opposite arm reverses the fringe shift direction (Extended Data Fig. 8), whereas amplification is observed only in the pumped arm (Supplementary Fig. 21). We model the experiment using two polaritonic waveguides described by the same light–matter coupled dispersion, with one incorporating a small shift of the exciton resonance, as described in the Methods. At fixed probe frequency, this shift produces a change in the polariton wavevector and the corresponding phase accumulated over the propagation length is reported in Fig. 4f as a function of the exciton resonance shift.
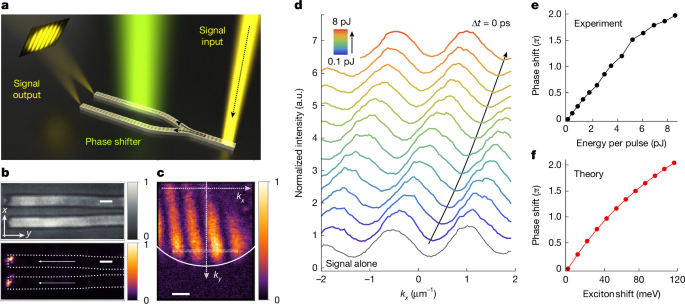
a, Schematic of the Y-splitter device with an integrated input grating used to split a propagating resonant signal inside the structure while a non-resonant phase shifter (EPS = 2.58 eV) is applied only on one of its two arms. The ends of the two arms outcouple the propagating signal and behave as spatially separated coherent emitters, generating an interference pattern in momentum space that provides direct access to the relative phase. b, Real-space image of the Y-splitter termination (top) and the corresponding outcoupled signal (bottom) when only the resonant beam is present. c, Representative momentum-space map showing the interference pattern arising from coherent out-coupling of the two arms. d, Evolution of the interference fringes for increasing phase-shifter fluence. The direction of the fringe shift is highlighted by the black arrow. Bottom black profile represents the signal alone. Note that the incident pulse energy per operation is used here as the relevant metric (rather than fluence), as appropriate for single-device operation. The device footprint is roughly 20 μm2. e, Phase shift as a function of energy per pulse, showing a continuous increase reaching 2π. f, Calculated phase shift considering two polaritonic waveguides described by the same light–matter coupled dispersion, with one incorporating a small shift of the exciton resonance. Scale bars, 2 μm (b), 1.5 μm–1 (c).
Finally, after establishing the presence of a suitable π-phase shift in the Y-splitter geometry, we extend this functionality to a full Mach–Zehnder interferometer. The polariton mode is resonantly excited at 2.265 eV through the input grating, while the transmitted signal is collected at the output, with the phase shifter applied to one arm of the interferometer, as illustrated in Fig. 5a,b. The output intensity is extracted from a fixed spatial region at the grating outcoupler and is shown in Fig. 5c after background subtraction (Supplementary Fig. 22). As the phase-shifter energy increases, the signal evolves from a maximum to a minimum and then back to a maximum, demonstrating a full 2π response well reproduced by a sine-squared fit. Notably, this sizable phase shift is achieved within an ultra-compact guided footprint (roughly 20 µm2, Fig. 5b), compared with millimetre-scale lithium-niobate phase shifters44,45. The large modulation is enabled by the polaritonic nature of the guided mode that enhances the nonlinear response to the pump-induced reservoir. Beyond its compactness, the direct use of polaritonic nonlinearities, with a residual contribution from the excitonic reservoir due to the off-resonant excitation, offers a route towards ultrafast integrated circuitry compared with thermo-optic nonlinearities46,47,48.
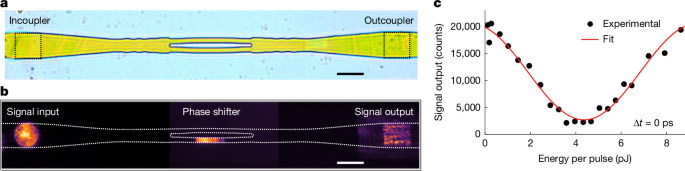
a, Microscope image of the Mach–Zehnder interferometer with an integrated input and output grating. b, Example of the experimental configuration adopted: a resonant beam with a full-width at half-maximum comparable to the size of the grating coupler is focused on the input grating (left, signal input), propagates along the structure and is outcoupled at the output grating (right, signal output). The phase-shifter beam was pumping one arm of the interferometer. The images of the signal input, phase shifter and signal output regions were acquired separately and subsequently rescaled in intensity. c, Signal output as a function of the phase-shifter energy: black dots represent the experimental data, and the red line indicates the fitted curve. The data are collected at Δt = 0 ps, corresponding to temporal synchronization between the travelling signal beam and the phase-shifter beam at the phase-shifter spatial position. Scale bars, 10 μm.
Conclusions
In summary, we demonstrate a fully integrated perovskite polariton waveguide platform operating at room temperature, combining strong nonlinear propagation, tunable polariton lasing, optical amplification and nonlinear phase control within a single device. Our approach introduces a hybrid and high-throughput soft-lithography method that combines surface-tension–guided assembly with microfluidics, enabling single-step direct fabrication of active waveguides with integrated grating couplers. This provides a straightforward, cost-effective and scalable route for realizing self-assembled complex polaritonic architectures without the need for specialized vacuum equipment or epitaxial reactors. The developed architecture supports on-chip polariton lasing, with wavelength-selective emission enabled by longitudinal feedback from the integrated gratings and efficient propagation along the waveguide. Beyond lasing, we demonstrate room-temperature amplification of guided polariton signals by nearly two orders of magnitude. The threshold-like amplification and nonlinear response suggest potential for neuromorphic polariton devices, in which tailored excitation geometries and pulse sequences could enable neuron-like operations such as signal integration and threshold-triggered emission.
Furthermore, we demonstrate nonlinear phase control in a guided polariton configuration, achieving phase shifts exceeding π within an ultra-compact footprint. Crucially, we harness this capability in a fully integrated Mach–Zehnder interferometer, enabling direct conversion of phase modulation into intensity modulation. The ability to coherently control the phase of propagating signals, combined with intrinsic ultrafast polaritonic nonlinearities, establishes this platform as a promising route towards ultrafast on-chip interferometric devices. These features—combining room-temperature operation, material tunability, scalable and cost-effective fabrication, and rich nonlinear functionalities—establish perovskite polariton waveguides as a versatile and promising platform for next-generation integrated photonic and polaritonic technologies.
Methods
Fabrication of the silicon master
The grating and waveguide nanostructures and microstructures were fabricated on 25 × 25 mm Si(100) substrates using EBL (RAITH Voyager) followed by reactive ion etching. The grating pattern was defined using a 130-nm-thick poly(methyl methacrylate) (PMMA) electron-beam resist layer spin-coated onto the silicon substrate and exposed by EBL at a dose of 580 μC cm−2. The exposed resist was developed in a MIBK:IPA (1:3) solution. A 40-nm-thick chromium film, serving as an etch hard mask, was subsequently deposited by electron-beam evaporation, and the remaining resist was removed in acetone. The pattern was transferred for 50 nm into the silicon substrate using fluorine-based reactive ion etching (CF4, CHF3, O2, Ar). The chromium mask was then removed by wet chemical etching. An analogous process was used for the fabrication of the waveguide structures, with optimized parameters as follows: PMMA resist thickness of 360 nm, EBL exposure dose of 280 μC cm−2, chromium mask thickness of 60 nm and reactive ion etching etching depth of 250 nm. Following chromium mask removal, the silicon master was cleaned in a piranha solution for 15 min to eliminate any residual organic contamination. The final silicon master featured microwire waveguides and interferometer-like geometries with lateral dimensions from 2 µm to 30 µm, and a height of 250 nm. Each waveguide incorporated nanometre-scale grating arrays covering areas of roughly 10 × 10 µm2, with a height of 50 nm, pitches between 240 nm and 300 nm and varying filling factors, directly etched onto the surface. The aspect ratios (height/width) of the patterned structures, including both the waveguides and the gratings, ranged from approximately 0.01 to 0.60. The grating width was intentionally designed to be smaller than the waveguide width (Supplementary Figs. 3 and 4), so that the grating lines remain confined within the inner region of the waveguide and do not overlap with the waveguide borders in the etch mask, thereby avoiding local sidewall indentations during the two-step dry-etching process and preserving a more uniform waveguide geometry for crystal growth. For the interferometer, the structure includes a sequence of lateral modulations before the Y-splitter, efficiently redistributing the guided mode into the two branches (Supplementary Fig. 4).
Fabrication of multiscale CsPbBr3 perovskite waveguides
Perovskite devices were fabricated using a modified soft-lithography approach that combined surface-tension-driven lithography with microfluidic processing of a liquid precursor solution, using PDMS replicas moulded from silicon masters with predefined multiscale geometries. A mixture of PDMS prepolymer and curing agent (10:1, Sylgard 184, Dow Corning) was cast onto the Si master and cured at 140 °C for 10 min. The polymerized PDMS layer was then carefully detached from the master before the use. A 0.42 M precursor solution was prepared by dissolving 106 mg of CsBr and 183.5 mg of PbBr2 (1:1 molar ratio) in 1.2 ml of dimethylsulfoxide. The mixture was stirred at 80 °C on a hotplate inside a nitrogen-filled glove box for 2 h, yielding a clear solution. Immediately before use, the precursor solution was diluted to concentrations in the range 0.05–0.1 M for the CsPbBr3 crystal growth. The precursor solution was deposited in contact with the patterned PDMS replica until the capillary pressure required for complete imbibition of the microstructures and nanostructures was reached. Once nucleation began, with the liquid meniscus pinned to the sidewalls of the nanoscale features, the PDMS replica was placed in conformal contact with a glass substrate to seal the microwire waveguides26,27. At this stage, capillary forces and surface interactions guided the solution through the microfluidic channels. Within the confined geometry, the reduced precursor volume and the progressively increasing concentration and viscosity gradients promoted perovskite nucleation through surface-tension-driven self-assembly precisely at the elastomer–air interface of each microstructure and nanostructure28,49,50,51. Crystallization inside the microchannels was optimized by imposing controlled temperature ramps (from 4 °C to room temperature) and by maintaining controlled vapour saturation and a pressure of 0.02 N cm−2 (refs. 52,53). After complete solvent evaporation, the PDMS replica was removed, yielding CsPbBr3 positive structures directly on the glass substrate that faithfully reproduced the microscale and nanoscale features of the original Si master. To assess fabrication reproducibility, we report in Supplementary Fig. 23 a set of nominally identical microwire arrays fabricated under the same conditions. The samples showed a consistent optical response, with only minor detuning variations. It is important to note that the grating width was intentionally designed to be smaller than the waveguide width, see Supplementary Figs. 3 and 4, to preserve continuous sidewalls in the elastomeric microchannels used for soft-lithography growth, ensuring uniform capillary filling and crystallization conditions while avoiding sidewall discontinuities that could introduce structural defects or make the crystal more fragile during replica peeling. The accessible limits of the proposed fabrication approach were determined by the fidelity of pattern transfer from the master mould to the elastomeric replica and subsequently to the perovskite crystal. On the basis of the aspect ratios demonstrated here (0.01–0.6), we anticipate that perovskite waveguides with thicknesses of roughly 100–150 nm and lateral dimensions of roughly 250–400 nm should be feasible. For periodic nanostructures, we note that some of the geometries investigated in this work (Supplementary Fig. 2) already contain lateral features as small as 50–80 nm, approaching the practical resolution limit of standard PDMS-based replication. Further reduction of the feature size would probably require optimization of the elastomeric replica itself.
Confocal microscopy
Confocal images were acquired using a Zeiss LSM 980 confocal microscope in high-resolution mode (1,024 × 1,024 pixel). Samples were prepared on microscope slides and characterized using a 488-nm excitation laser and a main beam splitter (MBS 488/639-nm) with appropriate photomultiplier tube (PMT) and gallium arsenide phosphide (GaAsP) detectors. All samples were imaged at various magnifications using Plan-Apochromat objectives of ×10 with a numerical aperture of NA = 0.45, ×20 NA = 0.8 and ×40 NA = 0.95. Three-dimensional images were obtained using the Z-stack scanning mode, which generated optical slices at various depths. Image analysis across different acquisition channels, tomographic reconstructions, spectral profiles and three-dimensional rendering were performed using the dedicated ZEN BLUE software.
AFM and SEM
AFM measurements were performed with a Dimension Icon (Bruker AXS) instrument, equipped with the Nanoscope V controller. Images were acquired in air, at room temperature, in Tapping Mode to protect the samples from damage. A rotated tapping etched silicon probe (Bruker) with a nominal radius of curvature R ≤ 8 nm was used. The morphology of the Si masters was investigated using a Sigma 300 (Zeiss) field emission SEM operated at an acceleration voltage of 5 kV and with an in-lens detector.
Optical measurements
All the optical measurements were performed by using microscope objectives at ×100 magnification and a numerical aperture of 0.9 (Zeiss) in a reflection configuration. The pumping lasers were taken from a pulsed source (Pharos, Light Conversion) with a tunable repetition rate and a pulse duration of <290 fs, which drove two computer-controlled optical parametric amplifier (OPA) stages (Orpheus OPA, Light Conversion). The OPA outputs were independently tunable in wavelength and, depending on the specific measurement (single-beam or double-beam excitation), were used either simultaneously or individually. In all the experiments, the repetition rate was set to 10 kHz. Energy-resolved momentum-space maps were collected by imaging the back focal plane of the objective onto the entrance of a spectrometer (Andor, Kymera 328i Spectrograph), equipped with three gratings (150 lines per mm, 300 lines per mm, 600 lines per mm) and coupled to a two-dimensional charge-coupled device (CCD camera, Andor, iStar 334T). For photoluminescence off the resonance pump, the laser was set to 480 nm and the emitted photoluminescence signal was filtered using an edgepass filter (Thorlabs, FELH0500) to suppress the residual excitation laser and isolate the emission. TE and TM polarizations were defined with the waveguide axis aligned to the entrance slits of the spectrometer, such that the electric field was parallel (TE) or perpendicular (TM) to the grating periodicity. The two polarizations were selectively monitored by using a half-wave plate (AHWP10M-600) and a linear polarizer (GTH10M-A) along the detection line. The laser pumping power was controlled by using a variable neutral-density wheel filter. For double-beam experiments, the two OPA outputs were temporally matched by using a delay line (Newport, M-ILS 150CC DC Servo Linear Stage). Reflectivity measurements shown in Supplementary Fig. 5 were performed by using a broadband white-light illumination in a reflection configuration, with a spot diameter of roughly 10 μm on the grating coupler. For the photoluminescence measurements shown in Supplementary Fig. 7, the waveguide was excited between two gratings whereas for Supplementary Fig. 6 the emission from a single grating was spatially selected. With reference to Fig. 3b, the temporal profiles were obtained by subtracting the residual photoluminescence signal generated by the amplifier alone, which remained constant across all temporal scans. The amplifier-only signal was collected separately using the same exposure time and then subtracted from the measurements in which both beams were simultaneously present. The same procedure was applied to the measurements in Fig. 4c,d, for which the signal obtained with the phase shifter alone was recorded under identical conditions and subtracted from the corresponding datasets. For the amplification measurements, Δt = 0 ps is defined as the relative amplifier-signal delay that maximizes the amplified signal intensity at the pumped region. This delay was experimentally optimized at each amplifier power, thereby inherently accounting for the relaxation dynamics leading to the population responsible for amplification and their possible dependence on the amplifier power.
Theoretical part
Infinitely periodic dispersions have been calculated taking into account fully dispersive experimental literature values for the real and imaginary parts of the refractive index54. To quantitatively relate the measured phase difference to a microscopic excitonic energy shift, we consider two waveguides governed by the same light–matter coupled dispersion, with one of them subjected to a small blueshift of the exciton resonance. To relate to this experiment, this blueshift came from the interaction between the signal and the reservoir created by the non-resonant pump. The system was probed at a fixed frequency (ω), such that the effect of the perturbation would not change the frequency of the mode, but rather modify its propagation constant. The observable phase difference after a propagation length L therefore directly reflected the difference in wavevectors between the two configurations, (Δɸ = ΔkL). We consider the propagation of a waveguided mode in the strong-coupling regime described by the lower polariton dispersion relation. For a reference waveguide, the dispersion reads:
Here k denotes the in-plane wavevector (propagation constant) of the guided mode and c represents the slope of the bare photonic dispersion, such that \({E}_{{\rm{ph}}}(k)\approx {ck}\). The parameter Ω corresponds to the Rabi splitting energy whereas ωx is the exciton resonance energy. The non-resonant pump on the second waveguide creates an exciton reservoir inducing a blueshift of the exciton, therefore the dispersion of the waveguide under the non-resonant pump reads:
where gsat accounts phenomenologically for a possible saturation-induced reduction of the light–matter coupling strength and is included for completeness. However, in the following, we set gsat = 0 for simplicity, as the overall trend of the shift is captured. Because ω is fixed between the two waveguides, the phase difference reduces to:
Substituting Δk yields: