 Newshot
Main
Unconventional symmetry breaking in itinerant fermion systems has revealed some of the most remarkable phases of quantum matter. A celebrated example is p-wave superfluidity in helium-3, where odd-parity Cooper pairing generates emergent orders beyond conventional paradigms1,2,3. Its magnetic analogue, the p-wave magnet, is characterized by an odd-parity spin-polarized electronic structure that preserves the combined symmetry of time reversal and lattice translation while breaking inversion symmetry5,6.
Recently, spin group theory has provided a framework for identifying such magnetic states5, extending concepts developed for altermagnets12. Whereas ferromagnets exhibit conventional s-wave-like spin splitting and altermagnets exhibit even-parity d-, g- or i-wave spin order12,13, p-wave magnets are characterized by odd-parity spin polarization associated with commensurate coplanar magnetic order that breaks inversion symmetry while preserving a combined time-reversal and translation symmetry5,14. The resulting electronic structure can exhibit a single symmetry-allowed spin component, symmetry-enforced nodal planes and a characteristic momentum-dependent spin texture. Candidate p-wave magnetism has recently been explored in insulating NiI2 (ref. 8) and metallic Gd3(Ru1−δRhδ)4Al12 (ref. 9). However, spin-resolved spectroscopic evidence for the characteristic odd-parity electronic spin texture remains limited8,9.
Here we present evidence for p-wave magnetism in the near-Fermi-level (near-EF) electronic structure of stoichiometric metallic EuSi by combining symmetry analysis, first-principles calculations, neutron scattering and photoemission spectroscopy. Neutron diffraction reveals a commensurate spiral phase with propagation vector (0, 1/3, 0) below the upper magnetic transition temperature, TN1 ≈ 62 K, followed by a transition to a conical phase at the lower magnetic transition temperature, TN2 ≈ 33.4 K. Magnetotransport measurements indicate strong coupling between magnetism and itinerant electrons. Below TN1, spin-integrated angle-resolved photoemission spectroscopy (ARPES) reveals a pronounced magnetism-driven reconstruction of the electronic structure, with energy separations exceeding 100 meV, associated with strong 4f–5d exchange coupling. Spin-ARPES provides spin-resolved spectroscopic evidence for the expected odd-parity Sy polarization in the near-EF spectral features: the extracted polarization changes sign across successive magnetic Brillouin zones and is suppressed near the nodal regions, consistent with the predicted p-wave spin texture and unfolded spin-polarization calculations. Because the near-EF spin-resolved features contain contributions from multiple folded bands with momentum-dependent spectral weights, the observed Sy modulation is best interpreted as a spectroscopic signature of the expected p-wave spin texture at the level of the reconstructed electronic structure. Magnetic force microscopy (MFM) and micro-ARPES further reveal approximately 10-µm chiral magnetic domains. Together, these observations identify EuSi as a stoichiometric metallic platform for investigating p-wave magnetism in electronic band structures and related spin-symmetry-based phenomena.
p-wave magnetism in EuSi
In conventional ferromagnets and altermagnets (Fig. 1a), broken time-reversal symmetry permits even-parity spin-polarized electronic structures12. In the non-relativistic limit, conventional ferromagnets exhibit s-wave-like spin splitting, whereas altermagnets can exhibit d-, g- or i-wave-like spin-splitting patterns12,13,15,16,17,18. By contrast, unconventional odd-parity magnets can host p-, f- or h-wave spin polarization that preserves time-reversal (\(\boldsymbol{\mathcal{T}}\))-related symmetry while breaking inversion (\(\boldsymbol{\mathcal{P}}\)) symmetry5. Commensurate chiral magnetic structures provide a natural route to such \(\boldsymbol{\mathcal{P}}\)-symmetry breaking. In particular, coplanar non-collinear exchange fields can generate odd-parity spin polarization in momentum space when the magnetic structure preserves the combined symmetry of time reversal and lattice translation, \(\boldsymbol{\mathcal{T}}{\boldsymbol{\tau }}\) (ref. 5). As in conventional antiferromagnets, this symmetry enforces zero net magnetization in the ideal p-wave magnetic state (Fig. 1a).
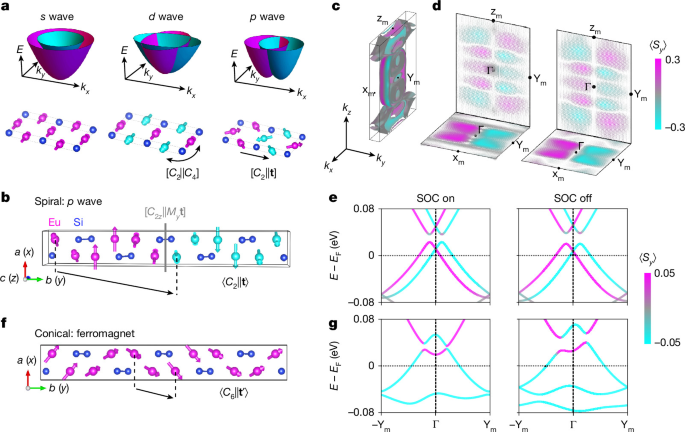
a, Schematic magnetic orders and their associated s-wave (ferromagnetic), d-wave (altermagnetic) and p-wave spin splitting in momentum space. Magenta and cyan spheres represent magnetic atoms with opposite spin orientations, related by the indicated combined spin–space symmetry operations in the d- and p-wave states, whereas blue spheres represent nonmagnetic atoms. b, Spiral magnetic structure of EuSi. The characteristic p-wave spin group symmetries are spin rotation combined with a glide mirror plane \([{C}_{2z}{||}{M}_{y}{\bf{t}}]\), and with a lattice translation \([{C}_{2}{||}{\bf{t}}]\), respectively. c, Calculated spin-polarized Fermi surface of the spiral phase, including SOC, showing p-wave spin polarization and spin splitting. d, Calculated spin textures near the top of the valence bands in the kz = 0 (bottom) and kx = 0 (top) planes, with (left) and without (right) SOC. e, Calculated spin-polarized band dispersion along the −Ym–Г–Ym (ky) direction in the spiral phase, with (left) and without (right) SOC. f, Conical magnetic structure of EuSi, with the combined spin-rotation and translation symmetry \([{C}_{6}{||}{{\bf{t}}}^{{\prime} }]\) indicated. g, Calculated spin-polarized band dispersions along the same momentum direction in the conical phase, with (left) and without (right) SOC.
We next consider the symmetry of the experimentally determined magnetic structures of EuSi. The crystal belongs to the point group D2h (space group Cmcm), and its magnetic states without (with) considering the effect of spin–orbit coupling (SOC) are described by the corresponding spin (magnetic) space group7. For the spiral state below TN1 ≈ 62 K, the spin space group is \({{}^{{2}_{y}}C}^{1}{m}^{{m}_{x}}{c}^{1}{m}^{{m}_{y}}1\), which satisfies the criteria for collinear p-wave spin polarization in momentum space. The spin space group breaks the \(\boldsymbol{\mathcal{P}}\) symmetry, thereby allowing odd-parity spin polarization. The coplanarity of the magnetic moments, together with the spin-only symmetry \({C}_{2y}{\mathcal{T}}=[{M}_{y}|1]\,{=}^{{m}_{y}}1\), constrains the spin polarization to the y direction in momentum space. Combined with the \(\boldsymbol{\mathcal{T}}{\boldsymbol{\tau }}\) symmetry, the spin group symmetry prohibits the spin components Sx and Sz, while allowing a \(\boldsymbol{\mathcal{T}}\)-symmetric Sy component satisfying:
The spin-degenerate nodal plane at ky = 0, where ky is the component of the electron crystal momentum k = (kx, ky, kz) along the reciprocal-space direction corresponding to the crystallographic b axis, is protected by the combined spin rotation, lattice mirror and translation symmetry \([{C}_{2z}{||}{M}_{y}t]\), as illustrated in Fig. 1b. The corresponding spin-polarized electronic-structure calculations are shown in Fig. 1c–e. Figure 1d illustrates the calculated p-wave spin–momentum locking near the top of the valence band in the (kx, ky, 0) and (0, ky, kz) planes. The calculated bands obey the symmetry relations:
Here, E(kx,ky,kz,Sy) denotes the electronic band energy at crystal momentum k for a state with spin polarization Sy along the b direction. Comparison of calculations with and without SOC (Fig. 1c–e) shows that the characteristic p-wave spin polarization and splitting arise predominantly from the non-relativistic magnetic exchange, with only minor modifications from SOC. These calculations therefore provide the symmetry and electronic-structure framework for the p-wave state expected from the spin and magnetic (\({P}_{C}{2}_{1}{2}_{1}{2}_{1}\)) space groups of the experimentally determined spiral magnetic structure.
We next consider the conical state below TN2 ≈ 33.4 K. Its spin space group takes the ferromagnetic form \({{}^{{2}_{y}}C}^{1}{m}^{{m}_{x}}{c}^{1}{m}^{{6}_{y}}{t}^{{\prime} }\), characterized by a symmetry combining a six-fold spin rotation with translation, [\({C}_{6y}{|}{t}^{{\prime} }\)], as shown in Fig. 1f. Figure 1g shows the calculated electronic structure without and with SOC. The calculated dispersions of the spiral and conical phases are similar over much of momentum space but differ near the Γ point (Fig. 1e,g). In the conical phase, broken \(\boldsymbol{\mathcal{T}}\) lifts the spin degeneracy at the Γ point that is protected in the spiral phase (see Supplementary Note 1 for further symmetry analysis). Accordingly, an anomalous Hall response is symmetry-allowed in the conical phase but prohibited in the spiral phase. The magnetic space groups of both phases are chiral.
Chiral magnetic order in EuSi
EuSi crystallizes in space group Cmcm (No. 63; Supplementary Tables 1–3). Single crystals were grown by the Bridgman method. Scanning transmission electron microscopy indicates high crystalline quality with few crystalline defects (Supplementary Fig. 2), and energy-dispersive X-ray spectroscopy analysis yielded an Eu:Si ratio of 50.2:49.8, consistent with stoichiometric EuSi within instrumental uncertainty (Supplementary Fig. 3). Two magnetic transitions occur at TN1 ≈ 62 K and TN2 ≈ 33.4 K, together with a weak structural distortion near the structural distortion temperature TS ≈ 60 K (Supplementary Fig. 4). Magnetization measurements along the three crystallographic axes show no pronounced hysteresis (Fig. 2b and Supplementary Fig. 6), indicating the absence of net magnetic moments at zero field. Upon cooling, these phase transitions define two boundaries: from the paramagnetic to the spiral magnetic phase, and subsequently to the conical magnetic phase (discussed later). Upon applying a magnetic field along the crystal’s a, b and c axes (Fig. 1f), the conical magnetic/spiral magnetic state exhibits metamagnetic transitions associated with spin-flop processes, and eventually evolves into a spin-polarized state at high fields (Supplementary Fig. 6c,f,i). Angular-dependent susceptibility further shows a pronounced two-fold magnetic anisotropy (Supplementary Fig. 7).
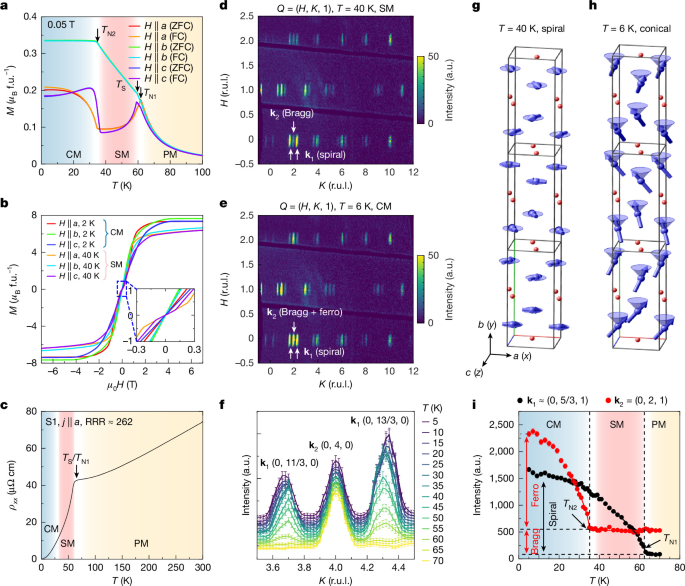
a, Temperature-dependent magnetic susceptibility measured along the a, b and c axes under zero-field-cooled (ZFC) and field-cooled (FC) conditions, respectively. The magnetic transitions at TN1 = 62 K and TN2 = 33.4 K, and structural distortion at TS = 59.7 K, are labelled. b, Magnetization versus magnetic field along the three crystallographic axes at 2 K and 40 K. The inset magnifies the low-field region, showing no distinct hysteresis. c, Resistivity of crystal S1 with current along a. The residual resistivity ratio, RRR = ρxx(300 K)/ρxx(2 K), is approximately 262. d,e, Neutron-diffraction patterns in the (H, K, 1) plane at 40 K (d) and 6 K (e). f, Temperature evolution of the (0, 4, 0) and adjacent k1 satellite peaks between 5 K and 70 K. g,h, Refined spiral and conical magnetic structures at 40 K (g) and 6 K (h). The reference Eu moment in the a–c plane is aligned along a. This convention differs from Fig. 1 by a global rotation within the a–c plane, preserving the relative moment configuration and magnetic symmetry. i, Temperature-dependent intensities of representative k1 and k2 peaks, (0, 5/3, 1) and (0, 2, 1). The dashed lines mark the magnetic transitions. CM, conical magnetic; SM, spiral magnetic; PM, paramagnetic. f.u., formula unit; r.u.l., reciprocal lattice units; Q, scattering vector; j, electrical current density.
The longitudinal resistivity is metallic, with a residual resistivity ratio (RRR = ρxx(300 K)/ρxx(2 K) ≈ 262), where ρxx is the longitudinal electrical resistivity (Fig. 2c). A sharp resistivity change near TN1 and pronounced transport anisotropy accompany the magnetic transitions (Supplementary Fig. 8). Magnetotransport measurements further reveal a large, non-saturating magnetoresistance at low temperature (reaching 4,600% at 2 K with a 9 T magnetic field along b) (Supplementary Figs. 9–12). With increasing temperature towards the spiral magnetic state, the magnetoresistance becomes negative and remains so up to room temperature, indicating strong magnetic scattering in both the spiral magnetic and paramagnetic states.
To determine the magnetic structures, we performed single-crystal neutron diffraction (Fig. 2 and Supplementary Note 5). At 40 K, satellite peaks appear at (H, K, L) ± (0, 1/3, 0) (Fig. 2d), corresponding to a magnetic propagation vector k1 = (0, 1/3, 0). Magnetic-structure refinement identifies an spiral magnetic order with moments rotating in the a–c (010) plane (Fig. 2g). The spins are approximately ferromagnetically aligned within each double layer and rotate by π/3 between adjacent double layers, corresponding to a threefold magnetic periodicity along b. This commensurate coplanar spiral is consistent with the symmetry requirements for the p-wave magnetic state discussed above.
On cooling to 6 K, the k1 satellite peaks remain, while additional magnetic intensity develops at the structural Bragg positions, corresponding to a second magnetic propagation vector k2 = (0, 0, 0) (Fig. 2e). Refinement shows that this component corresponds to a ferromagnetic moment along b, yielding the conical magnetic structure shown in Fig. 2h. The persistence of the k1 intensity across TN2 supports the coexistence of the spiral and b-axis components within the conical magnetic phase rather than macroscopic phase separation. The refined ordered moments are mac = 4.4(1) μB per Eu at 40 K and mac = 5.4(1) μB per Eu, mb = 4.1(1) μB per Eu at 6 K, where μB is the Bohr magneton, consistent with the Eu2+ valence inferred from X-ray absorption and X-ray magnetic circular dichroism measurements (Supplementary Fig. 14).
The temperature dependence of representative magnetic peaks further resolves the two transitions (Fig. 2f,i). The k1 order develops below TN1, whereas the k2 component appears below TN2. Critical exponent fits yield β = 0.32(2) for k1 and β = 0.33(3) for k2, slightly below the classical three-dimensional Heisenberg value (β = 0.365), possibly reflecting additional spin–lattice coupling.
Magnetism-driven band splitting
Before turning to the spin-resolved measurements relevant for p-wave magnetism, we first characterize the overall electronic structure of EuSi across the magnetic transitions (Fig. 3). The calculated three-dimensional Fermi surface in the spiral magnetic phase (Fig. 3b) contains several electron/hole pockets exhibiting strong anisotropy along the kx, ky and kz directions. Figure 3c shows the measured band structure in the kx–kz plane, corresponding to the cleaved a–c (010) plane in the conical magnetic phase. The constant-energy contours (Fig. 3c) show clear C2 symmetry and are broadly consistent with the calculated Fermi surface; similar dispersions are observed in the conical magnetic and spiral magnetic phases.
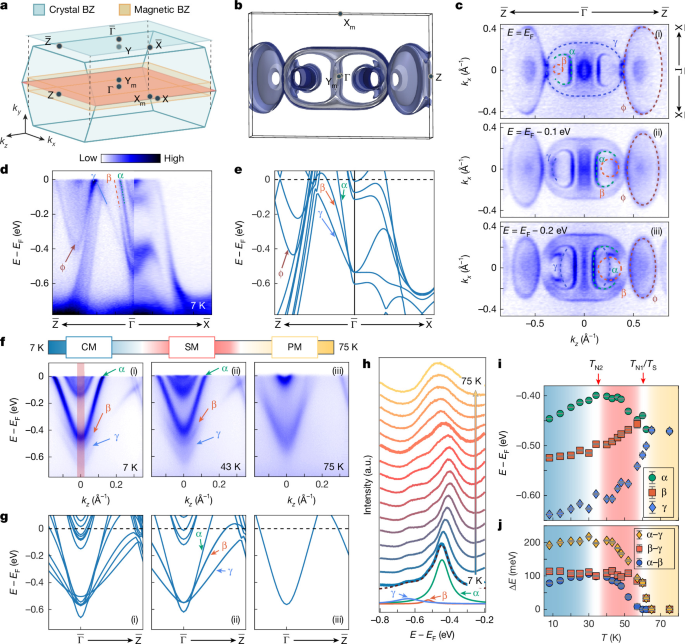
a, Crystal and magnetic Brillouin zones (BZs) of EuSi, with the projected surface BZ of the a–c (010) cleavage plane shaded above. High-symmetry points are labelled. b, Calculated three-dimensional Fermi surface in the magnetic BZ in the spiral magnetic phase. c, Constant-energy contours at EF (i), EF − 0.1 eV (ii) and EF − 0.2 eV (iii) in the kx–kz plane measured at 10 K. d,e, ARPES dispersion along the \(\overline{{\rm{Z}}}-\overline{\Gamma }-\overline{{\rm{X}}}\) direction, measured at 57 eV (ky ≈ 2π/b; d) and corresponding calculated bands (ky ≈ 2π/b; e). Here, b is the crystal lattice constant. f,g, ARPES dispersions measured with 7 eV photons (ky ≈ 2π/b; f) and corresponding DFT calculations at ky ≈ 2π/b (g) in the conical magnetic (i), spiral magnetic (ii) and paramagnetic (iii) phases. The α, β and γ bands are labelled. h, Temperature-dependent energy-distribution curves integrated near \(\overline{\Gamma }\) over the shaded region in f(i). Fitting resolves the peaks associated with α, β and γ. i, Temperature-dependent peak energies obtained from the energy-distribution curve fits. j, Corresponding energy separations between α and γ, β and γ, and α and β. Error bars in i represent energy uncertainties estimated from the energy resolution of the 7-eV laser-ARPES set-up at each temperature; those in j represent the corresponding propagated uncertainties in the energy separations.
The measured dispersion along the corresponding high-symmetry direction exhibits dispersive Eu 5d bands crossing EF (Fig. 3d). The measurement geometry, orbital-character analysis and determination of the high-symmetry points for the a–c cleavage plane are described in Supplementary Figs. 15 and 16. The bands near the \(\overline{\Gamma }\) point are labelled α, β and γ, and the band near the zone boundary is denoted φ, following comparison with the density functional theory (DFT) calculations in Fig. 3e. Differences in the number and precise positions of the calculated and measured bands may arise from the simplified treatment of magnetic structure, calculation parameters such as effective on-site Coulomb interaction U and lattice constant, and many-body effects (Supplementary Note 10).
Over a wider energy range, ARPES reveals the Eu 4f- and Si 3p-derived states (Supplementary Fig. 17). The Eu 4f flat bands, labelled FB1–FB3, lie approximately 1–2 eV below EF and are further identified by resonant ARPES measurements (Supplementary Fig. 18). These states are crossed by dispersive Si 3p bands, consistent with orbital-projected calculations. Their location well below EF is consistent with the localized 4f 7 configuration and large local Eu2+ moment.
The magnetic transitions are accompanied by a pronounced reconstruction of the near-EF electronic structure. High-resolution laser-ARPES demonstrates that the α, β and γ bands evolve strongly across the conical magnetic, spiral magnetic and paramagnetic phases (Fig. 3f). Their characteristic energies shift by approximately 50 meV between the conical magnetic and spiral magnetic phases, followed by a more pronounced reconstruction at TN1, where the three bands merge upon entering the paramagnetic phase (Supplementary Fig. 19). Tracking their energy positions from energy-distribution curve fits (Fig. 3h–j) shows that this reconstruction follows the temperature evolution of the in-plane magnetic order k1 determined by neutron diffraction (Fig. 2i). The calculations (Fig. 3g) reproduce the main evolution in the spiral magnetic and paramagnetic phases, whereas larger deviations occur in the conical magnetic phase, suggesting that the additional b-axis ferromagnetic component has a comparatively smaller influence on the near-EF electronic structure. Similar evolution of the α, β, γ and φ bands is observed at different photon energies and momentum directions (Supplementary Figs. 20 and 21), indicating a robust magnetism-driven reconstruction of the Eu 5d electronic structure.
We attribute this reconstruction to the strong 5d–4f exchange coupling between the localized Eu 4f moments and itinerant Eu 5d electrons through intra-atomic exchange19,20. This exchange lifts the spin degeneracy and accounts for the large band splitting with a gap of approximately 100 meV (ref. 21). Once the spiral magnetic/conical magnetic order develops, the enlarged magnetic unit cell also imposes a periodic exchange potential that folds the reconstructed 5d bands. This interpretation is consistent with the observed substantial Eu moment22. The Si p bands also show reconstruction across TN1, whereas the Eu 4f bands remain nearly unchanged in energy, although the intensity of FB1 starts to decrease at TN2 (Supplementary Fig. 22).
The dominant effect of the a–c-plane magnetic moments is further reflected in the reconstructed electronic structure across multiple momentum planes, arising from the combined effects of exchange splitting and magnetic-zone folding. Consistent reconstruction is observed by ARPES on both the cleaved b–c (100) and a–b (001) surfaces (Supplementary Note 8).
Spin-resolved p-wave evidence
We probe the predicted p-wave symmetry using spin-resolved ARPES on the a–c cleavage plane at 40 K. The relevant symmetry relations predict opposite Sy polarization under \({k}_{y}\to -{k}_{y}\), \(E(0,{k}_{y},{k}_{z},{S}_{y})\,=\) \(E(0,-{k}_{y},{k}_{z},-{S}_{y})\) and unchanged Sy under the corresponding \({k}_{x}\to -{k}_{x}\), \(E({k}_{x},{k}_{y},{k}_{z},{S}_{y})=E(-{k}_{x},{k}_{y},{k}_{z},{S}_{y})\) operation. By varying the photon energy, we sample a series of ky values across successive magnetic Brillouin zones (Fig. 4a,b; additional measurements from an independent facility are shown in Supplementary Fig. 34). At \(({k}_{x},{k}_{y},{k}_{z})\,=\) \((0,0.3\times 2{\rm{\pi }}/b,0)\) (cut 1 in Fig. 4d; b is the magnetic-supercell lattice constant), the spectral features associated with the δ, α and γ regions show negative, positive and negative Sy polarization of approximately 5%, respectively. At the corresponding negative-ky position (cut 4 in Fig. 4d; see Supplementary Note 9 for the band assignment), the extracted polarizations show the opposite signs. For intermediate ky values approaching the nodal plane ky ≈ 0, (also −0.5 × 2π/b) the net Sy polarization is strongly suppressed (cuts 2 and 3 in Fig. 4d), consistent with the node-like behaviour expected for an odd-parity spin texture.
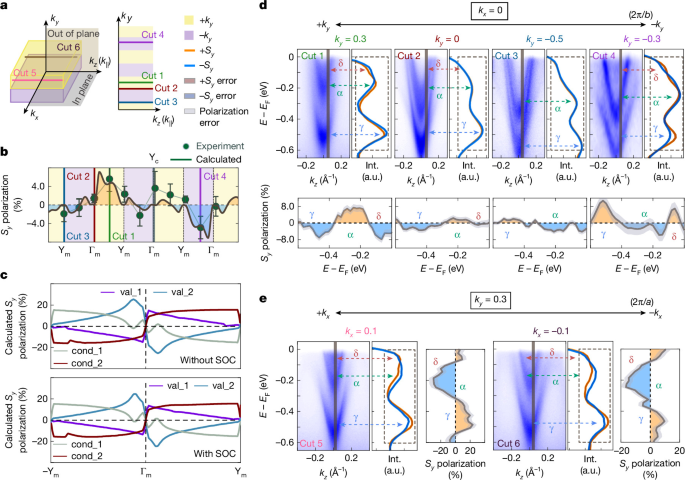
a, Measurement geometry on the a–c (010) cleavage plane. Cuts 1–4 (right) sample momenta along kz at different ky, accessed by varying photon energy; cuts 5 and 6 (left) compare symmetry-related momenta under \({k}_{x}\to -{k}_{x}\). Yellow and purple indicate positive and negative reduced ky, respectively, relative to each magnetic-zone centre. b, Extracted Sy polarization of spectral feature labelled α across successive magnetic Brillouin zones. The sign-changing modulation and suppression near nodal regions are consistent with the predicted p-wave spin texture. The solid curve shows calculated unfolded Sy polarization in the lattice Brillouin zone for qualitative comparison. Vertical lines mark cuts 1–4; high-symmetry points are labelled. c, Calculated Sy polarization of representative valence (val_1 and val_2) and conduction (cond_1 and cond_2) bands along ky in the magnetic Brillouin zone, shown without (top) and with (bottom) SOC. d, Spin-resolved ARPES spectra for cuts 1–4 at kx = 0. Each cut shows the spin-integrated spectrum (left), spin-resolved energy-distribution curves (right) and extracted Sy polarization (below). Dashed arrows mark the δ, α and γ spectral regions. The polarization reverses between positive and negative reduced-ky regions and is suppressed near predicted nodes (ky = 0 and −0.5 × 2π/b). b is the magnetic-supercell lattice constant. e, Spectra for cuts 5 (left) and 6 (right) at fixed ky. The extracted Sy polarization is unchanged within statistical uncertainty under \({k}_{x}\to -{k}_{x}\). Error bars in b and shaded envelopes in d and e represent one standard deviation propagated from Poisson counting statistics. These observations are consistent with the predicted spin symmetry but do not establish an eigenstate-resolved test because the measured features contain unresolved band contributions with momentum-dependent spectral weights.
To examine the momentum dependence more systematically, we extract the energy-integrated Sy polarization of the feature labelled α within the fitting-defined integration window at photon energies from 13 eV to 23 eV, sampling successive magnetic Brillouin zones. The extracted polarization exhibits a sign-changing modulation and is strongly suppressed near the ky = 0 nodal regions (Supplementary Fig. 33 and Supplementary Note 9). Despite the finite out-of-plane momentum resolution, the observed modulation is consistent with the odd-ky spin texture expected for p-wave magnetism and with the calculated spin-polarization patterns in both the lattice and magnetic Brillouin zones (Fig. 4b,c and Supplementary Figs. 35 and 36). The variation in modulation amplitude across successive zones is also consistent with momentum-dependent unfolded spectral weights, which redistribute contributions from folded magnetic-supercell states at different extended-zone momenta (Fig. 4b and Supplementary Fig. 36). The persistence of the same sign-reversal pattern in calculations with and without SOC (Fig. 4c) further indicates that the dominant spin texture originates from magnetic symmetry rather than SOC.
In addition, we find that the Sy polarization of the spectral features associated with the δ, α and γ regions remains unchanged within statistical uncertainty for symmetry-related points (kx, ky) and (−kx, ky), consistent with \(E({k}_{x},{k}_{y},{k}_{z},{S}_{y})=E(-{k}_{x},{k}_{y},{k}_{z},{S}_{y})\) (Fig. 4e).
We note two limitations of the spin-ARPES analysis. First, the measured polarization is small, approximately 5%, compared with the calculated maximum contrast of about 25% (Fig. 4c), and the clearest spin-resolved features occur at finite binding energies within the near-EF electronic structure rather than at EF. The measured spin polarization may be reduced by finite energy and momentum resolution and by partial cancellation between unresolved contributions with opposite spin polarizations. Averaging over oppositely chiral magnetic domains could further reduce the signal if such domains are sampled within the illuminated area. Second, the near-EF features contain contributions from multiple folded bands with momentum-dependent spectral weights, and the cuts at positive and negative reduced ky were acquired using different photon energies and sample different extended-zone momenta, so the relative spectral weights contributing to a measured feature may differ. The measurements therefore do not constitute a one-to-one, eigenstate-resolved test of the calculated symmetry relations. In particular, the present data do not uniquely separate the momentum dependence of individual-band spin polarization from changes in the relative spectral weights of unresolved components. Within these limitations, the sign-changing Sy modulation and its suppression near the predicted nodal regions provide spin-resolved spectroscopic evidence consistent with the predicted odd-parity p-wave spin texture of the reconstructed near-EF electronic structure of EuSi.
Chiral magnetic domains in EuSi
The large local magnetic moment and its strong coupling with the electronic structure enable the measurement of the magnetic domains with different chiralities using complementary probes23,24. Figure 5a shows the magnetic domains on the a–c plane measured by MFM in the conical magnetic phase, revealing a bubble-in-stripe pattern with a characteristic width of approximately 10 μm, corresponding to opposite spiral configurations. Similar stripe-like magnetic domains are observed by circularly polarized micro-ARPES with a submicrometre beam spot (Fig. 5b).
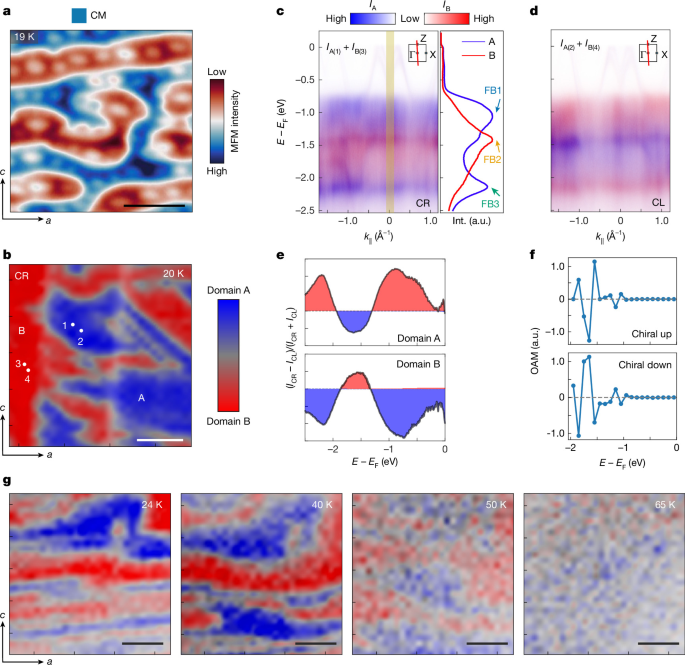
a, MFM image of the a–c (010) plane at 19 K. Blue and red indicate domains with downwards and upwards magnetization, respectively. The lift height is 200 nm and the colour scale is 5 Hz. b, Micro-ARPES domain map of the same crystallographic plane at 20 K using circularly right-polarized (CR) light. c, Left: composite band spectra from domains A (point 1) and B (point 3), marked in b, measured with CR light. IA and IB denote the photoemission intensities from domains A and B, respectively, displayed in blue and red channels. IA(1) and IB(3) represent the intensities measured at points 1 and 3 marked in b, respectively. Right: energy-distribution curves from A (blue) and B (red), integrated over the yellow rectangle. d, Composite spectra from domains A (point 2) and B (point 4), measured with circularly left-polarized (CL) light. IA(2) and IB(4) denote the intensities measured at points 2 and 4 marked in b, respectively. Insets in c and d indicate the dispersion direction in the Brillouin zone. e, Circular-dichroic (CD) intensity extracted from the CR and CL energy-distribution curves for domains A and B. f, Calculated orbital angular momentum (OAM) along the b axis near Γ versus energy for chiral up and down domains in the conical magnetic phase (Supplementary Fig. 39). g, Temperature-dependent micro-ARPES maps acquired with CR light. Maps in b and g combine spectral weights integrated near E − EF = −1 eV (FB1, blue) and E − EF = −1.5 eV (FB2, red). Composite spectra in c and d overlay intensities from domains A and B in blue and red, respectively. Scale bars, 10 μm (a), 5 μm (b,g).
Figure 5c,d shows the band dispersions along the \(\overline{\Gamma }-\overline{{\rm{Z}}}\) direction measured in domains A and B using right-handed and left-handed polarized light. Under circularly right-polarized illumination, FB1 and FB3 exhibit stronger spectral weight than FB2 in one domain and weaker spectral weight in the other, generating a clear domain contrast (Fig. 5c). Reversing the light polarization from circularly right-polarized to circularly left-polarized reverses this contrast, producing opposite circular-dichroism signals in domains A and B (Fig. 5e). The circular dichroism is associated with the orbital angular momentum of the Eu 4f bands with b-axis net moment25,26 (Fig. 5f and Supplementary Note 11). The calculated orbital angular momentum reverses between opposite magnetic chiralities, consistent with the observed reversal of the circular-dichroism signal. Thus, the micro-ARPES measurements reveal domains with opposite magnetic chirality and opposite b-axis moment.
The temperature-dependent spatial maps in Fig. 5g show that the domain contrast persists in the conical magnetic phase, weakens in the spiral magnetic phase above TN2 and disappears in the paramagnetic phase. In contrast, MFM no longer resolves the domains in the spiral magnetic phase because of the absence of a net magnetic moment detectable by this probe. The remaining circular-dichroism contrast in the spiral magnetic phase may originate from domains with different chirality, although its microscopic origin requires further scrutiny. Overall, the domain-dependent circular-dichroism demonstrates the coupling between magnetic chirality and the electronic structure. Reversing the magnetic chirality therefore reverses the circular-dichroism response of the electronic states, providing a means to probe the chirality-dependent electronic structure associated with the p-wave magnetic state.
Discussion
We now discuss the similarities and differences between p-wave magnetic spin splitting and the previously studied f-wave11 spin splitting in transition-metal dichalcogenides. Previous theoretical and experimental studies have demonstrated that in monolayer transition-metal dichalcogenides (for example, MoS2), SOC induces odd-parity spin splitting in the valence bands27,28,29. Because this splitting is of relativistic origin in a non-magnetic crystal, it is relatively weak and cannot be easily tuned30. By contrast, first-principles calculations predict p-wave spin splitting in EuSi arising predominantly from non-relativistic exchange, whereas ARPES reveals a substantial magnetism-driven reconstruction of the electronic structure (Supplementary Table 6). Because this p-wave state originates from the chiral magnetic order, the calculated dependence of the spin texture on magnetic chirality suggests a possible route to controlling the associated spin polarization.
Compared with previously discussed ‘p-wave’ magnetic candidates8,9, EuSi provides a particularly clean realization of the archetypal p-wave symmetry setting8. In the spiral phase, the refined magnetic structure of stoichiometric EuSi preserves the combined \(\boldsymbol{\mathcal{T}}{\boldsymbol{\tau }}\) symmetry and has zero net magnetization, providing the symmetry setting for the predicted odd-parity p-wave spin texture without complications from finite magnetization. This combination has not been achieved in earlier candidate materials such as NiI2 or Gd3(Ru1−δRhδ)4Al12. In NiI2, \(\boldsymbol{\mathcal{T}}{\boldsymbol{\tau }}\) symmetry is broken by the incommensurate non-collinear spin structure8, whereas in Gd3(Ru1−δRhδ)4Al12 a weak magnetization breaks time-reversal symmetry and generates a large anomalous Hall effect9.
Furthermore, EuSi serves as an advantageous material platform because of its stoichiometric and metallic nature, and a relatively high temperature window (33.4–62 K) compared with those of low-ordering-temperature metallic counterparts such as CeNiAsO and Gd3(Ru1−δRhδ)4Al12 (approximately 8 K; see Supplementary Table 7 for detailed comparison). Taken together, these attributes position EuSi as a particularly promising material platform for exploring and ultimately harnessing p-wave magnetism in electronic structures.
Conclusion
Metallic p-wave magnets are predicted to host unconventional responses, including field-free spin-polarized transport, a large non-relativistic Edelstein effect10 and non-relativistic Ising superconductivity11. When the spiral order is canted and forms a conical state, an unconventional and large anomalous Hall effect can be observed. Analogous effects, such as the magneto-optical Kerr effect, are expected to be pronounced as well. Through combined theoretical and experimental approaches, our results provide evidence for p-wave magnetism in the electronic structure of stoichiometric metallic EuSi, associated with its chiral magnetic order and combined time-reversal and lattice-translation symmetry in the spiral phase (33.4–62 K). EuSi therefore provides a realistic and accessible platform for investigating symmetry-protected transport and optical responses driven by magnetism. Beyond fundamental interest, the controllability of its metallic and chiral magnetic states may enable field-free spintronic functionalities and pave the way towards engineering p-wave-correlated and topological electronic phases in itinerant systems.
Methods
Sample growth and X-ray diffraction
EuSi single crystals were grown using the Bridgman method with an Eu:Si elemental ratio of 1:1. Eu (99.95% purity) and Si (99.99% purity) were mixed and placed in a tantalum crucible. The crucible was sealed in vacuum. The sealed tube was heated to 1,450 °C for over 12 h and maintained at that temperature for 24 h. The solution was then slowly cooled to room temperature. Owing to the sensitivity of the investigated phase to oxygen and moisture, the specimen used for the single-crystal diffraction experiment was prepared (mounted) in a protective atmosphere (an argon-filled glovebox). The single crystal used for this experiment was mechanically detached (cut) from the grown single crystal and mounted in a glass capillary (0.2 mm diameter) to prevent reaction with air and moisture during the data collection. Details regarding data collection and the refinement of the crystal structure are listed in the Supplementary Tables 1–3. Low-temperature X-ray powder diffraction was carried out at beamline ID22 of the European Synchrotron Radiation Facility (ESRF). For this purpose, a portion of the grown single crystal was powdered, sieved through a 32-µm sieve and placed into a 0.3-mm glass capillary. The data were collected at specific temperatures using a helium-cooled cryostat and a multi-analyser stage for recording of the diffraction pattern. At temperatures below 45 K, the intensity of the beam was reduced using an attenuator to prevent the sample from heating up. The results of the low-temperature X-ray powder diffraction are shown in Supplementary Fig. 4.
X-ray absorption spectroscopy and X-ray magnetic circular dichroism measurements
X-ray absorption spectroscopy and X-ray magnetic circular dichroism measurements were performed at the high-field magnet endstation of beamline I10 at Diamond Light Source, UK, with a base temperature of 5 K and magnetic field up to ±14 T along the direction of the incident beam. The crystals were cleaved in situ along the a–c (010) plane under ultrahigh vacuum, and the angle between the incident beam and the crystal (010) plane was kept at either 0° (normal incidence) or 70° (grazing incidence). X-ray absorption spectroscopy was carried out in total-electron-yield mode at the Eu M4,5 edges. X-ray magnetic circular-dichroism spectra were obtained by subtracting the absorption spectra measured with opposite helicities of the incident X-ray beam, which was aligned either parallel or antiparallel to the applied magnetic field.
ARPES measurements
High-resolution ARPES measurements were performed at beamlines BL5-2 of the Stanford Synchrotron Radiation Lightsource (SSRL), A-branch of the Bloch beamline at MAX IV, and BL03U of the Shanghai Synchrotron Radiation Facility (SSRF). At BL5-2, a Scienta Omicron DFS30 analyser was used, achieving an overall energy and angular resolution of 20 meV and 0.2°. At Bloch and BL03U, a Scienta Omicron DA30L analyser was used, achieving an overall energy and angular resolution of 20 meV and 0.2°. High-resolution laser-based ARPES measurements were performed on home-built set-up (hν = 6.994 eV) at ShanghaiTech University. Data were collected using an electron analyser (DA30L Scienta Omicron). The total convolved energy and angle resolution were 5 meV and 0.1°, respectively. Micro-ARPES measurements were performed at BL07U of SSRF. The beam with photon energy from 88 eV to 102 eV was focused using a Fresnel zone plate and a spatial resolution of approximately 400 nm was achieved. The data were collected by a hemispherical Scienta Omicron DA30L electron analyser. The instrument energy and momentum resolution were approximately 15 meV and 0.01 Å−1, respectively. In all set-ups, the samples were cleaved in situ at approximately 10 K and measured under ultrahigh vacuum below 5 × 10⁻¹¹ torr.
Spin-ARPES measurements
The spin-resolved ARPES experiments were performed using a Scienta DA30L analyser integrated with a very-low-energy-diffraction spin detector at the National Synchrotron Radiation Laboratory (NSRL) BL13U. The samples were cleaved in situ at approximately 40 K and measured under ultrahigh vacuum below 2 × 10⁻¹⁰ torr. For these experiments, an effective Sherman function of 0.25 was used. Spin-resolved ARPES measurements at the U125-PGM beamline of BESSY II were performed using the spin-ARPES endstation equipped with a Scienta R4000 analyser coupled to two Mott-type spin detectors. The samples were also cleaved in situ at approximately 50 K and measured under ultrahigh vacuum below 2 × 10⁻¹⁰ torr. For these experiments, an effective Sherman function of 0.16 was adopted. The spin polarization was determined from \(\mathrm{Polarization}=(1/{S}_{\mathrm{eff}})\times ({I}_{\mathrm{up}}-{I}_{\mathrm{down}})/({I}_{\mathrm{up}}+{I}_{\mathrm{down}})\), in which Iup and Idown are the measured photoelectron intensities in the two spin channels and Seff is the effective Sherman function.
The statistical uncertainties were estimated from the counting statistics of the two spin-detector channels. Assuming independent Poisson statistics, the measured counts Iup and Idown have standard deviations \({\sigma }_{{I}_{\mathrm{up}}}=\sqrt{{I}_{\mathrm{up}}}\) and \({\sigma }_{{I}_{\mathrm{down}}}=\sqrt{{I}_{\mathrm{down}}}\), respectively. Standard error propagation gives \({\sigma }_{{S}_{y}}=\frac{2}{{S}_{\mathrm{eff}}}\sqrt{\frac{{I}_{\mathrm{up}}{I}_{\mathrm{down}}}{{({I}_{\mathrm{up}}+{I}_{\mathrm{down}})}^{3}}}\). For energy-dependent polarization curves, this expression was applied separately to each energy bin; for the integrated polarization of a spectral feature, Iup and Idown represent the total counts accumulated within the corresponding energy-integration window. All shaded uncertainty envelopes and error bars in the spin-ARPES figures denote one standard deviation.
Neutron diffraction
Neutron-diffraction experiments were conducted at the HB-3A DEMAND in the High-Flux Isotope Reactor at Oak Ridge National Lab. A piece of a EuSi single crystal with dimensions of approximately 4 × 3 × 0.1 mm3 was aligned in the (0KL) scattering plane and cooled. The wavelength used was 1.541 Å. The data were reduced using MANTID31 and ReTIA32. Symmetry analysis was performed using SARAh33, and magnetic-structure refinement was performed using FullProf34,35.
DFT calculations
The first-principles calculations of the band structures and Fermi surface were performed by using the first-principles DFT methods implemented in the Vienna Ab initio Simulation Package (VASP)36,37. The exchange-correlation and the ion-electron interactions are treated by the Perdew–Burke–Ernzerhof functional38 and the projector augmented-wave method39,40 under the generalized gradient approximation. Throughout all calculations, the convergence criteria for energy are less than 2 × 10⁻⁵ eV, and the plane-wave energy cut-off is set to 400 eV. The k-point sampling uses a Monkhorst–Pack scheme41 with an accuracy of 0.02π Å−1 for self-consistent electronic calculations. To correctly describe the strong correlation effects of the Eu f orbitals, the on-site Coulomb interaction was treated using an effective Hubbard U of 5 eV.
Transport and thermodynamics
For electrical-transport measurements, a single crystal was cut into a bar shape. A standard six-probe method was used for longitudinal resistivity and transverse Hall measurements. Electrical-transport data were collected using a physical-property measurement system (PPMS; Quantum Design). Magnetic-susceptibility and specific-heat measurements were performed using a magnetic property measurement system (MPMS; Quantum Design) and PPMS. Thermal-expansion measurements were conducted in the PPMS using a homemade capacitive dilatometer.
MFM measurements
The MFM experiments were performed with a homemade helium-3 atomic force microscopy system using commercial piezoresistive cantilevers (spring constant k ≈ 3 N m−1 and resonant frequency approximately 43 kHz). The tips were coated with a nominally 100-nm-thick cobalt layer by magnetron sputtering. The MFM data were acquired by Nanonis SPM Controllers (SPECS) with a phase-locked loop. The MFM signal, the resonant frequency shift of the cantilever, is proportional to the out-of-plane stray field gradient generated by the sample. By using the constant-height mode, MFM images are acquired on a scanning plane approximately 200 nm above the surface.