 Newshot
Main
Inflammasomes are cytoplasmic organelles that mediate inflammatory responses to infection and injury, primarily through the cleavage and release of the interleukin-1 (IL-1) family of cytokines3. Diverse proteins can seed inflammasome assembly, with NLRP3 being the best characterized and most commonly associated with human disease. NLRP3 activation in vitro requires two signals1. Signal 1 is provided by pathogen-associated molecular patterns such as bacterial lipopolysaccharide (LPS), which sensitizes (that is, primes) the NLRP3 pathway for responsiveness to subsequent stimuli. Signal 2 can be provided by a diverse set of stimuli, all of which induce interactions between NLRP3 and the protein ASC, which leads to the recruitment and activation of caspase-1 (refs. 1,4). The NLRP3–ASC–caspase-1 complex represents the minimal components of the NLRP3 inflammasome. Activated caspase-1 in the inflammasome cleaves pro-IL-1β and the pore-forming protein gasdermin D (GSDMD), which leads to the release of bioactive IL-1β (IL-1β p17) and pyroptosis5,6,7,8.
Although this two-signal model holds true for NLRP3 activation in vitro, LPS alone is sufficient to activate NLRP3 in vivo9,10,11,12,13,14,15,16. An explanation for the discrepancy between in vitro and in vivo NLRP3 activation remains elusive and was investigated herein.
ECM stiffness controls NLRP3 inflammasome activity
We investigated the kinetics of NLRP3 activation in vivo after intraperitoneal (i.p.) injection of LPS into mice. LPS injection induced the NLRP3-dependent accumulation of IL-1β in the serum within 3 h (Extended Data Fig. 1a,b). Caspase-11 is a regulator of LPS-induced IL-1β production in vivo. Caspase-11 was dispensable for IL-1β accumulation in the serum 3 h after LPS injection but was required for IL-1β production 6 h after LPS injection (Extended Data Fig. 1c). These data indicate that LPS can activate NLRP3 rapidly and independently of caspase-11. Within 1 h of LPS injection, cleaved IL-1β was detected in the peritoneal fluid (Fig. 1a,b). Nlrp3−/− mice did not accumulate IL-1β in the peritoneal fluid after LPS injection (Extended Data Fig. 1d). The speed of IL-1β p17 production observed in the peritoneal fluid suggested that a pool of resident cells is responsible. We depleted peritoneal macrophages using clodronate liposomes17, which led to the loss of 99.8% of these cells (Extended Data Fig. 1e). Under these conditions, i.p. LPS injections induced minimal production of IL-1β (Fig. 1c). However, ex vivo LPS stimulations of isolated resident peritoneal macrophages did not induce IL-1β production from these cells (Extended Data Fig. 1f). By contrast, LPS induced the secretion of TNF from ex vivo cultured peritoneal macrophages (Extended Data Fig. 1g). These data suggest that peritoneal macrophages secrete IL-1β in vivo in response to LPS treatment but lose this capability ex vivo.
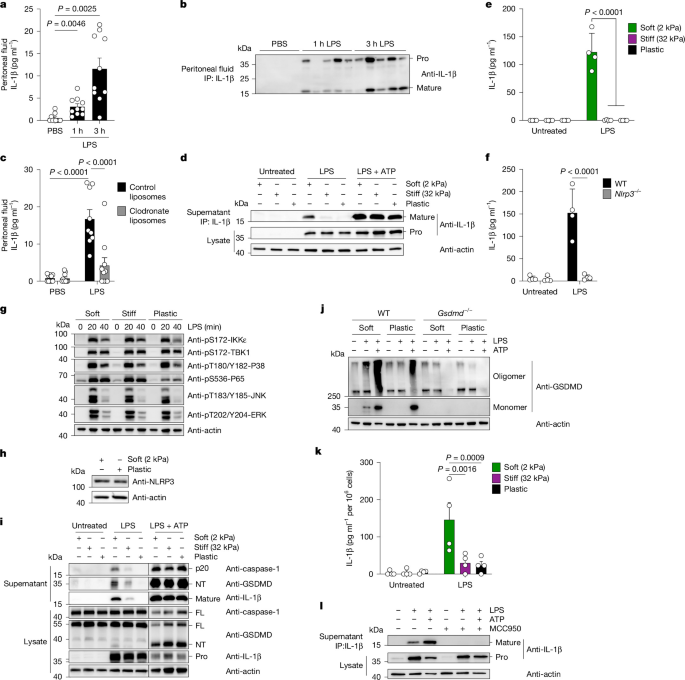
a,b, Quantification of IL-1β ELISA (a) and immunoprecipitation (IP) blots (b) of peritoneal fluid from mice treated with i.p. injections of LPS or PBS (n = 10 mice per group). Each lane represents one mouse (the blot is representative of two independent experiments). c, Quantification of IL-1β ELISA of peritoneal fluid from mice treated with clodronate or control liposomes followed by treatment with PBS or LPS for 3 h (n = 9 for control liposomes + LPS; n = 10 mice for all other conditions). d, IL-1β IP blot from culture supernatants of peritoneal macrophages cultured on plates of variable stiffness and treated with LPS for 6 h with or without ATP for 30 min (one representative experiment is shown out of four). e,f, Quantification of IL-1β ELISA of culture supernatants of BMDMs grown on indicated ECM stiffness (e) or obtained from mice with the indicated genotypes (f) and treated with or without LPS for 6 h (n = 4 independent experiments). g, BMDMs on variable stiffness plates were treated with LPS, and various components of TLR signalling were examined by immunoblotting (one representative experiment is shown out of three). h, BMDMs cultured on the indicated ECM conditions were examined for NLRP3 expression (one representative experiment is shown out of three). i,j, BMDMs cultured on the indicated ECM conditions (i) or obtained from mice of the indicated genotypes (j) were treated with or without LPS for 4 h followed by ATP for 2 h. Supernatants and lysates were assayed for the proteins indicated in the immunoblot (one representative experiment is shown out of three or four). k, Quantification of IL-1β ELISA of culture supernatants of human MDMs cultured on variable stiffness plates and treated with LPS for 6 h (n = 4 separate donors). l, IL-1β IP of culture supernatants of human MDMs plated as in k and treated with or without MCC950 (one representative experiment is shown out of three). Data are the mean ± s.e.m. (a,c,e,f,k). Significance was determined using analysis of variance (ANOVA) with Dunnett’s T3 multiple-comparison test (a), two-way ANOVA with Fisher’s least-significant difference test (c,f) or two-way ANOVA with Tukey’s multiple-comparison test (e,k). FL, full length; NT, N terminus.
One distinction between the experimental methodologies used in vitro and in vivo is the ECM. Normal tissue has a stiffness of 1–10 kilopascals (kPa), whereas plastic Petri dishes have a stiffness of 3,000,000 kPa18,19,20. Macrophages have the ability to sense and adapt to ECM stiffness21,22,23,24,25,26. To determine the effect of ECM stiffness on NLRP3 inflammasome activities, we varied the ECM stiffness on which macrophages are cultured. We selected plastic Petri dishes overlaid with polydimethylsiloxane to model the stiffness of normal tissue (soft plates, 2 kPa) and fibrotic tissue (stiff plates, 32 kPa), and used plastic Petri dishes as a control (plastic plates, 3,000,000 kPa)19,27. Plates were functionalized through the adsorption of fibronectin onto the surface. Isolated resident peritoneal macrophages cultured on surfaces mimicking normal tissue stiffness displayed the in vivo-like ability to release cleaved IL-1β in response to LPS alone (Fig. 1d). This ability to produce IL-1β was reduced as ECM stiffness increased (Fig. 1d). Similar findings were observed with mouse bone-marrow-derived macrophages (BMDMs). BMDMs cultured on soft plates (but not plastic) induced NLRP3-dependent IL-1β release (Fig. 1e,f). No effect of ECM stiffness was observed on NLRP3 protein abundance or on the LPS-stimulated activation of MAP kinase pathways (Fig. 1g,h). There was an increase in phosphorylation of NF-κB p65 in BMDMs grown on both soft and stiff ECM compared with plastic, but this result did not correlate with IL-1β secretion (Fig. 1e,g).
In BMDMs cultured on soft ECM, LPS was sufficient to stimulate the production and cleavage of pro-IL-1β, the cleavage of caspase-1 and the cleavage and oligomerization of GSDMD (Fig. 1i,j). With the exception of pro-IL-1β production (which proceeds via TLR4), all these inflammasome-associated activities were reduced or non-existent as the stiffness of the ECM was increased to that of plastic. LPS-induced IL-1β release on soft ECM required NLRP3 but not caspase-11 (Fig. 1f and Extended Data Fig. 1h). These data highlight the selective sensitivity of the NLRP3 pathway to changes in ECM stiffness.
Similar assays were performed using human monocyte-derived macrophages (MDMs). Human MDMs cultured on soft ECM produced cleaved IL-1β in response to LPS (Fig. 1k and Extended Data Fig. 1i). Inhibition of NLRP3 using the chemical MCC950 (ref. 28) prevented the production of cleaved IL-1β (Fig. 1l and Extended Data Fig. 1j). In human monocytes, LPS can promote IL-1β production via NLRP3 through a process that is insensitive to potassium efflux inhibition29. LPS stimulations were performed in the presence of high concentrations of extracellular potassium, a method to prevent potassium efflux30. Under these conditions, LPS-induced IL-1β production was inhibited (Extended Data Fig. 1k). The means by which macrophages link soft ECM to NLRP3 activation is therefore distinct from the behaviours of human monocytes.
NRF2 links ECM stiffness sensing to NLRP3 activation
We determined how long macrophages must adapt to ECM stiffness before LPS-induced IL-1β production is observed. LPS stimulation of BMDMs cultured on soft ECM for 16 h induced IL-1β production (Fig. 1e,f), whereas stimulation of BMDMs cultured on soft ECM for 2 h did not (Extended Data Fig. 2a). To determine whether macrophages require integrin-mediated interactions, we cultured BMDMs on soft ECM coated with either fibronectin (to facilitate integrin interactions) or poly-l-lysine (to facilitate charge-based interactions). Macrophages cultured on poly-l-lysine did not produce IL-1β when stimulated with LPS, despite secreting IL-6 (Extended Data Fig. 2b,c). To determine whether adhesion is required, we cultured BMDMs in suspension and compared them to cells adhered to plastic plates. Cells in suspension did not secrete IL-1β when stimulated with LPS but maintained their responsiveness to LPS + ATP (Extended Data Fig. 2d). Macrophages may therefore require hours-long, integrin-mediated adhesion to adapt to ECM stiffness.
We performed RNA sequencing of BMDMs cultured on ECM of variable stiffness for 2 h or overnight (16 h). BMDMs cultured for 2 h were transcriptionally similar regardless of ECM stiffness (Extended Data Fig. 2e). BMDMs cultured overnight demonstrated stiffness-dependent differences in gene expression (Extended Data Fig. 2e). Differential gene expression analyses of BMDMs cultured overnight revealed several hundred genes induced on soft ECM and suppressed on plastic (Fig. 2a). Ingenuity pathway analysis of genes induced only on soft ECM identified the NRF2-mediated stress response pathway as a top hit (Fig. 2b,c).
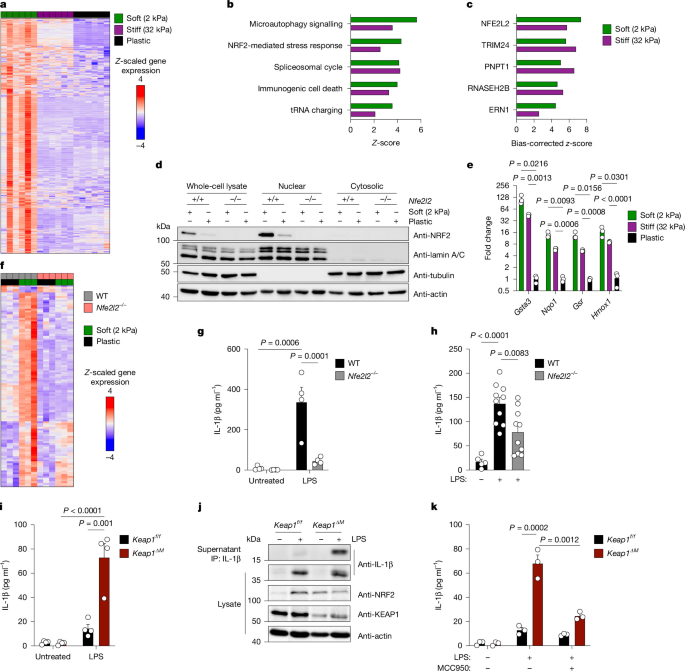
a, Heatmap of z-scaled significantly upregulated genes from RNA sequencing of BMDMs cultured on variable stiffness plates (n = 5–6 technical replicates per condition). b,c, Canonical pathways (b) and upstream regulators (c) identified using ingenuity pathway analysis of genes from a. d, Blots of proteins from WT and Nfe2l2−/− BMDMs plated on soft and plastic plates and subjected to nuclear–cytoplasmic fractionation (blot shown is representative of three independent experiments). e, RT–qPCR of NRF2 target genes in BMDMs plated on variable stiffness plates (n = 3 per group, results representative of three independent experiments). f, Heatmap of z-scaled significantly differentially expressed genes from RNA sequencing of WT and Nfe2l2−/− BMDMs plated on soft and plastic plates (n = 3 independent experiments). g, Quantification of IL-1β ELISA of cell culture supernatants from WT and Nfe2l2−/− BMDMs plated on soft plates and treated with LPS for 6 h (n = 4 independent experiments). h, Quantification of IL-1β ELISA of serum from WT and Nfe2l2−/− mice treated with PBS or LPS for 3 h (n = 5 mice for WT mice treated with PBS, n = 10 mice for each other condition). i, Quantification of IL-1β ELISA of cell culture supernatants from Keap1f/f and Keap1∆M BMDMs plated on plastic plates and treated with LPS for 24 h (n = 4 independent experiments). j, IL-1β IP from cell culture supernatants of Keap1f/f and Keap1∆M BMDMs from i (one representative experiment is shown out of three). k, Quantification of IL-1β ELISA of cell culture supernatants from Keap1f/f and Keap1∆M BMDMs plated on plastic plates and treated with LPS for 24 h with or without MCC950 (n = 3 independent experiments). Data are the mean ± s.e.m. (e,g–i,k). Significance was determined using two-way ANOVA with Tukey’s multiple-comparison test (e,g,i,k) or one-way ANOVA with Tukey’s multiple-comparison test (h).
Although we did not observe ECM stiffness-dependent changes in the expression of Nfe2l2 (which encodes NRF2), BMDMs cultured on soft ECM contained the highest amount of nuclear NRF2 compared with cells cultured on high stiffness ECM (Fig. 2d and Extended Data Fig. 2f). Increased NRF2 nuclear accumulation was associated with the highest expression of NRF2 target genes (Fig. 2e). YAP and TAZ are mechanosensitive transcriptional coactivators21,22,23, yet we could not identify expression of Yap1 or Wwtr1 (which encodes TAZ) in BMDMs, nor visualize YAP1 protein in BMDM lysates. Furthermore, analysis of YAP target genes did not indicate an association between ECM stiffness and gene expression (Extended Data Fig. 2g). NRF2, but not YAP or TAZ, can therefore be considered an ECM stiffness response factor in macrophages. We performed RNA sequencing of BMDMs obtained from wild-type (WT) and Nfe2l2−/− mice and cultured on soft or plastic ECM. The entire stiffness-dependent transcriptional program (n = 231 genes) in BMDMs required Nfe2l2 except for two genes, Egr2 and Trim30c (Fig. 2f). NRF2 is therefore required for macrophage adaptation to changes in ECM stiffness.
Studies that have examined the role of NRF2 in NLRP3 activities have been reported. For example, small-molecule NRF2 agonists can negatively regulate IL-1β production31,32,33,34,35,36,37,38,39,40,41,42,43,44,45, and genetic data have suggested that NRF2 is required for IL-1β production46,47,48. We examined the effects of five chemical activators of NRF2 (4-octyl itaconate, dimethyl fumarate, sulforaphane, tert-butylhydroquinone and KI696) on gene expression. All the NRF2 agonists suppressed a portion of LPS-stimulated genes (Extended Data Fig. 3a). However, this suppressive activity on LPS-induced gene expression occurred in WT and Nfe2l2−/− BMDMs. For example, treatment with NRF2 agonists decreased LPS-induced expression of Il1b equally in WT and Nfe2l2−/− BMDMs (Extended Data Fig. 3b). NRF2 activators may therefore display off-target effects.
Analyses of Nfe2l2−/− BMDMs showed that NRF2 was required for IL-1β release (but not pro-IL-1β production) by LPS-stimulated BMDMs grown on soft ECM (Fig. 2g and Extended Data Fig. 3c). Moreover, i.p. injection of LPS in Nfe2l2−/− mice led to reduced IL-1β levels in the serum, whereas TNF accumulation was unaffected (Fig. 2h and Extended Data Fig. 3d). Nfe2l2−/− mice also demonstrated reduced peritoneal neutrophil recruitment after i.p. injection of NLRP3 agonistic alum, whereas no difference was seen after i.p. injection of monosodium urate (MSU) crystals, which also agonizes NLRP3 (Extended Data Fig. 3e,f). These data indicate that in most, but not all, scenarios, NRF2 is required for NLRP3 activation.
NRF2 abundance and nuclear localization is controlled by KEAP1, a ubiquitin ligase that constitutively directs NRF2 ubiquitination and degradation49. Consistent with this idea, treatment of immortalized BMDMs (iBMDMs) with the proteasome inhibitor MG132 increased the abundance of NRF2 in macrophage lysates (Extended Data Fig. 4a). We examined the effect of ECM stiffness and LPS priming on KEAP1 and NRF2 interactions, their abundance and their nuclear localization. KEAP1 abundance in cell lysates was not affected by LPS or high or low ECM stiffness culture conditions (Extended Data Fig. 4b). The majority of KEAP1 was found in the cytosol and not the nucleus (Extended Data Fig. 4b). By contrast, NRF2 abundance and subcellular distribution were sensitive to these changes in culture conditions. High ECM stiffness (that is, plastic) was associated with the lowest abundance of NRF2 and the least amount of nuclear NRF2 (Extended Data Fig. 4b). Low ECM stiffness, and to a greater extent LPS treatments under plastic culture conditions, led to an increase in NRF2 abundance (Extended Data Fig. 4b). This increase in NRF2 abundance correlated with nuclear translocation. Co-immunoprecipitation of KEAP1 and NRF2 demonstrated an interaction between these proteins at steady state and after LPS stimulation. The extent of interactions correlated with NRF2 abundance and was maintained with activation, a finding consistent with previous reports50 (Extended Data Fig. 4c). These data suggest that even under conditions of NRF2 activation, KEAP1 maintains its inhibitory activities for a large amount of total cellular NRF2.
If this model is correct, then one would expect that eliminating KEAP1 from cells would increase NRF2 activities beyond what is achieved by culturing cells on low ECM. To test this idea, we crossed LysM-cre mice to Keap1f/f mice to generate macrophage-specific Keap1-deficient (Keap1∆M) mice. BMDMs from these mice were examined for LPS responses. Keap1 deletion in BMDMs was approximately 75% (Extended Data Fig. 4d). When plated on plastic, Keap1∆M BMDMs displayed increased abundance of NRF2 protein and an increase in NRF2 target gene expression compared with WT BMDMs (Extended Data Fig. 4e,f). Elevated NRF2 in Keap1∆M BMDMs also increased LPS-stimulated Il1b transcription (Extended Data Fig. 4g). LPS was sufficient to induce IL-1β p17 production from Keap1∆M BMDMs cultured on plastic through a process sensitive to MCC950 (Fig. 2i–k). Thus, NRF2 expression is sufficient to enable BMDMs to activate the NLRP3 inflammasome in response to LPS.
To determine whether NRF2 contributes to the regulation of other macrophage responses, we polarized WT, Nfe2l2−/−, Keap1f/f and Keap1∆M BMDMs towards an M1 phenotype (using IFNγ and LPS) and an M2 phenotype (using IL-4 and IL-13). NRF2 was required for M1 and M2 polarization in BMDMs (Extended Data Fig. 5a–f). Furthermore, elevated NRF2 in Keap1∆M BMDMs modestly enhanced M1 polarization without effects on M2 polarization (Extended Data Fig. 5g–l).
NRF2 is a general regulator of NLRP3
Using experimental conditions commonly associated with NLRP3 activation (culturing cells on plastic and priming with LPS before NLRP3 stimulation51,52,53), the following NLRP3 agonists were identified as dependent on NRF2: nigericin, ATP, CL097 and electroporated LPS. After priming with LPS, these stimuli required NRF2 for maximal IL-1β production and pyroptosis, the latter assessed by the release of cytoplasmic lactate dehydrogenase (LDH) (Fig. 3a–c and Extended Data Fig. 5m–q). Pyroptosis induced by electroporated LPS, an NLRP3-independent process10,54, was unaffected by NRF2 deficiency (Extended Data Fig. 5r). For stimulations using both LPS and nigericin, NRF2 was not required for pro-IL-1β production (Fig. 3c). Visualization of ASC, a protein in the core of NLRP3 inflammasomes55, revealed defects in inflammasome assembly induced by LPS + nigericin in Nfe2l2−/− BMDMs (Fig. 3d,e).
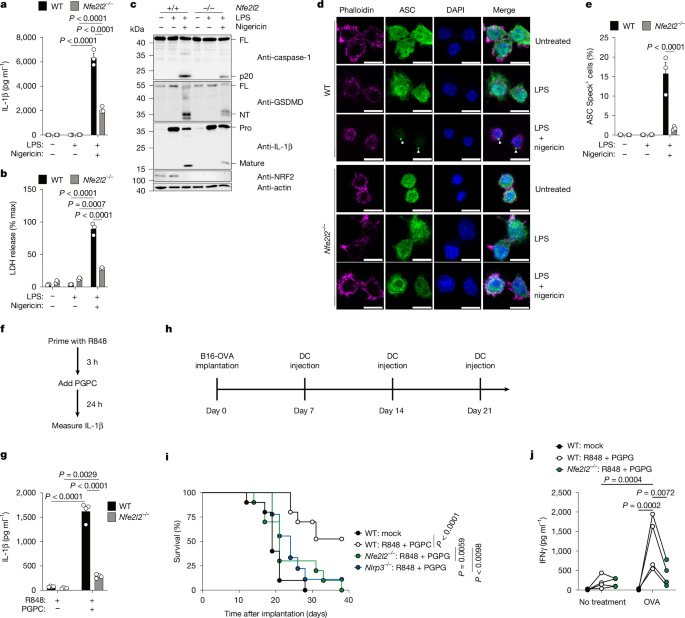
a, Quantification of IL-1β ELISA of cell culture supernatants from WT and Nfe2l2−/− BMDMs primed with LPS for 4 h and stimulated with nigericin for 2 h (n = 3, 1 representative experiment is shown out of 3). b, Quantification of LDH release into cell culture supernatants from BMDMs in a (n = 3, 1 representative experiment is shown out of 3). c, Blots of WT and Nfe2l2−/− BMDMs primed with LPS for 4 h and stimulated with nigericin for 1 h followed by in-well lysis and analysis (one representative experiment is shown out of three). d, Representative images of ASC specks from WT and Nfe2l2−/− BMDMs primed with LPS for 4 h and stimulated with nigericin for 30 min in the presence of zVAD-FMK. Phalloidin, magenta; ASC, green; DAPI, blue. Arrowheads indicate ASC specks. Scale bar, 10 µm. e, Quantification of ASC specks from cells in d (n = 3 independent experiments). f, Schematic of the hyperactivation protocol. g, Quantification of IL-1β ELISA of cell culture supernatants from WT and Nfe2l2−/− BMDMs in f (n = 4, 1 representative experiment is shown out of 3). h, Schematic of tumour implantation and BMDC immunization experimental plan. i, Survival of WT mice implanted with B16-OVA cells and treated with injections of WT, Nfe2l2−/− or Nlrp3−/− BMDCs pretreated as in f and loaded with OVA as in h (n = 10 mice per condition). j, Quantification of IFNγ ELISA of cell culture supernatants from WT and Nfe2l2−/− BMDCs in i and co-cultured for 7 days with WT splenic CD8+ T cells isolated from mice immunized with OVA and incomplete Freud’s adjuvant. Lines denote samples from the same experiment (n = 3 independent experiments per condition). Data are the mean ± s.e.m. (a,b,e,g). Significance was determined using two-way ANOVA with Tukey’s multiple-comparison test (a,b,e,g,h).
NLRP3 can mediate IL-1β release in the absence of cell death through a process called cellular hyperactivation56,57. Stimuli that promote dendritic cell (DC) hyperactivation are vaccine adjuvants that induce NLRP3-dependent antitumour immunity58,59. To determine whether NRF2 regulates cell hyperactivation and its effects on antitumour immunity, we first examined DC activities in vitro. Bone-marrow-derived DCs (BMDCs) and BMDMs were treated with the TLR7 and TLR8 ligand R848 and then treated with the NLRP3 stimulatory hyperactivator 1-palmitoyl-2-glutaryl-sn-glycero-3-phosphocholine (PGPC)56,58 (Fig. 3f). Under these conditions, BMDMs and BMDCs produced IL-1β through a process that depended on NRF2 (Fig. 3g and Extended Data Fig. 5s).
To determine the role of NRF2 in antitumour immunity, WT and Nfe2l2−/− mice were immunized prophylactically with both R848 and PGPC along with the antigenic protein ovalbumin (OVA). Mice were boosted 2 weeks later and subsequently subcutaneously implanted with B16F10 melanoma cells expressing OVA (hereafter B16-OVA). Immunized WT mice were protected against tumorigenesis, whereas immunized Nfe2l2−/− mice did not exhibit control of tumour growth (Extended Data Fig. 6a). No genotype-specific differences in tumour growth were observed in the absence of immunization (Extended Data Fig. 6b).
To determine whether NRF2 is required in DCs for effective antitumour immunity, we used a model of adoptive DC therapies58. DCs were differentiated from the bone marrow of WT, Nlrp3−/− and Nfe2l2−/− mice, treated ex vivo with R848 and PGPC and loaded with the OVA antigen. B16-OVA cells were subcutaneously implanted into WT mice, and beginning 7 days after implantation, the mice with tumours were subcutaneously immunized with the stimulated DCs (Fig. 3h). Mice that received WT DCs exhibited restricted tumour growth and survived, whereas mice receiving Nlrp3−/− or Nfe2l2−/− DCs did not (Fig. 3i). The role of NRF2 in DC-mediated tumour control correlated with DC-mediated CD8+ T cell activation. WT DCs induced the production of OVA-specific IFNγ-secreting CD8+ T cells, whereas Nfe2l2−/− DCs did not (Fig. 3j). These data suggest that NRF2 has an important role in DCs and the induction of protective immunity.
ROS mediates ECM stiffness control of NRF2 activity
Reactive oxygen species (ROS) activates NRF2 transcriptional activity by preventing the KEAP1–NRF2 interaction60. We observed increased ROS generation in BMDMs grown on soft ECM without any differences in Keap1 transcript levels (Extended Data Figs. 7a and 8a). A source of ROS in macrophages is NADPH oxidase (NOX) enzymes61. Although we did not observe changes in the expression of NOX enzymes in BMDMs grown on soft ECM, inhibition of NOX1 and NOX2 reduced ROS in BMDMs grown on soft ECM (Extended Data Fig. 8b,c). Despite this reduction in ROS, NOX inhibition did not affect the induction of NRF2 target genes or LPS-induced IL-1β production (Extended Data Fig. 8d,e).
We next examined antioxidants that target total cellular ROS (the glutathione precursor N-acetylcysteine (NAC)) or mitochondrial ROS (MitoTEMPO). Incubation of BMDMs grown on soft ECM and treated with NAC prevented maximal ROS accumulation, NRF2 target gene transcription and IL-1β production after LPS stimulation, whereas MitoTEMPO treatment did not (Extended Data Fig. 7b–d). There was no effect of NAC or MitoTEMPO on TNF secretion (Extended Data Fig. 7e). Soft ECM regulates mitochondrial fission60. We performed transmission electron microscopy to visualize these organelles. BMDMs grown on soft ECM did not display differences in mitochondrial morphology or size compared with BMDMs grown on plastic (Extended Data Fig. 8f,g). Furthermore, inhibition of the mitochondrial fission protein DRP1 with Mdivi-1 or Drpitor1a62 did not affect NRF2 accumulation in BMDMs cultured on soft ECM (Extended Data Fig. 8h). These data suggest that soft ECM induces ROS from multiple sources to control NRF2 activity, which contributes to maximal LPS-induced IL-1β production.
Actin links ECM stiffness to macrophage NRF2 activity
F-actin bundles are formed as ECM stiffness increases63. Therefore, we examined the effect of actin dynamics on NRF2. We used small molecules that inhibit actin polymerization (cytochalasin D) or nucleate disorganized actin polymerization (jasplakinolide)64,65,66. Treatment of BMDMs cultured on plastic with these inhibitors induced NRF2 target gene transcription (Extended Data Fig. 9a). Notably, when cultured on plastic, BMDMs treated with cytochalasin D or jasplakinolide produced cleaved IL-1β and underwent pyroptosis in response to LPS alone via a process that depended on NLRP3 and NRF2 (Extended Data Fig. 9b–e). Treatment of BMDMs with inhibitors that disrupt actin contractility but not actin directly (blebbistatin, Y-27632 or ML-7) did not affect IL-1β production in BMDMs treated with LPS (Extended Data Fig. 9b–f). Previous work has implicated NRF2 in mediating actin cytoskeleton and contractility in ECM stiffness in epithelial cells60. Our findings indicate that macrophages use a distinct mechanism whereby high F-actin abundance, not contractility, inhibits NRF2 and thereby limits NLRP3 activities.
NRF2 target Panx1 drives one-signal NLRP3 activation
As potassium efflux controls NRF2-dependent NLRP3 activation on soft ECM (Extended Data Fig. 1k), we examined our RNA sequencing data for changes in the expression of membrane channels. Panx1 (which encodes pannexin-1) was induced in BMDMs cultured on soft ECM compared with plastic, and this induction required NRF2 and ROS (Fig. 4a,b and Extended Data Fig. 10a).
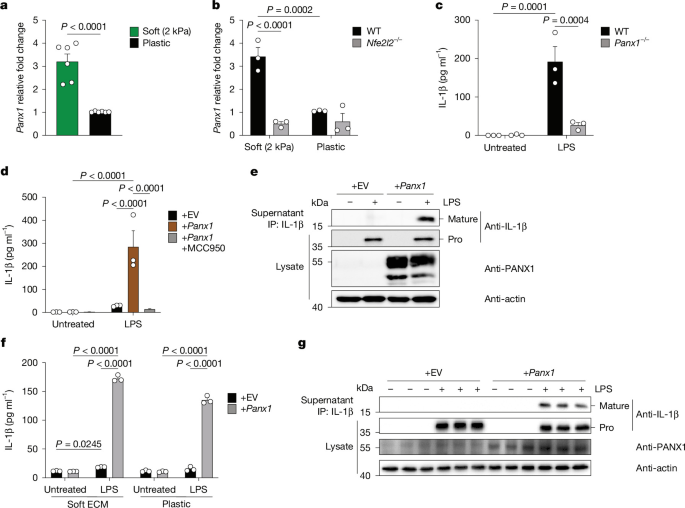
a, RT–qPCR of Panx1 expression in BMDMs cultured on soft or plastic plates (n = 5 independent experiments). b, RT–qPCR of Panx1 expression in WT and Nfe2l2−/− BMDMs cultured on soft or plastic plates (n = 3 independent experiments). c, Quantification of IL-1β ELISA of cell culture supernatants from WT and Panx1−/− BMDMs cultured on soft ECM and then treated with LPS (100 ng ml–1) for 6 h (n = 3 independent experiments). d, Quantification of IL-1β ELISA of cell culture supernatants from iBMDMs cultured on plastic plates and overexpressing empty vector (+EV) or Panx1 (+Panx1) and treated with LPS (100 ng ml–1) for 24 h in the presence or absence of MCC950 (10 µM) (n = 3 independent experiments). e, IL-1β was immunoprecipitated from cell culture supernatants of iBMDMs cultured on plastic plates and overexpressing empty vector or Panx1 and treated with LPS (100 ng ml–1) for 24 h and subjected to immunoblotting (one representative experiment is shown out of three). f, Quantification of IL-1β ELISA of cell culture supernatants from Nfe2l2−/− BMDMs cultured on soft ECM or plastic plates and overexpressing empty vector or Panx1 and treated with LPS (100 ng ml–1) for 24 h (n = 3 independent experiments). g, IL-1β was immunoprecipitated from cell culture supernatants of Nfe2l2−/− BMDMs cultured on plastic plates and overexpressing empty vector or Panx1 and treated with LPS (100 ng ml–1) for 24 h and subjected to immunoblotting (the figure represents three independent experiments). Data are the mean ± s.e.m. (a–d,f). Significance was determined using two-sided Student’s t-test (a) or two-way analysis ANOVA with Tukey’s multiple comparison test (b–d,f).
PANX1 is a channel that can conduct ions and other small molecules67,68. Previous work has implicated Panx1 in NLRP3 activation in vivo69; however, in vitro studies have discounted a role for Panx1 in NLRP3 activation69,70,71,72. To investigate a link to ECM stiffness, we used macrophages generated from WT and CMV-cre;Panx1f/f (Panx1−/−) animals73. WT BMDMs produced IL-1β when cultured on soft ECM, whereas Panx1−/− BMDMs cultured on soft ECM were defective for IL-1β (but not pro-IL-1β) production (Fig. 4c and Extended Data Fig. 10b). We confirmed previous results of the effects of Panx1 on macrophages grown on plastic plates72, as Panx1−/− BMDMs retained normal two-signal activation of NLRP3 (Extended Data Fig. 10c). Similar results were obtained when cells were treated with the Panx1 inhibitors probenecid and trovafloxacin69,72 (Extended Data Fig. 10d–f). Panx1 conducts ATP; however, culturing cells with oxidized ATP (oxATP; which blocks ATP signalling via P2X7) did not affect LPS-stimulated IL-1β release (Extended Data Fig. 10g). As a control, oxATP suppressed the effects of exogenous ATP on IL-1β production by these cells (Extended Data Fig. 10h). To determine whether increased Panx1 expression is sufficient to enable macrophages to activate NLRP3 in response to LPS, we overexpressed Panx1 in iBMDMs and cultured the cells on plastic plates. Notably, LPS stimulated the production of IL-1β from Panx1-overexpressing iBMDMs but not in control cells (Fig. 4d,e). MCC950 inhibited LPS-stimulated production of IL-1β in Panx1-overexpressing iBMDMs (Fig. 4d). Overexpression of Panx1 did not affect two-signal activation of the NLRP3 inflammasome when cells were treated with LPS + nigericin (Extended Data Fig. 10i). To determine whether Panx1 overexpression can bypass the requirement of NRF2 for NLRP3 activation, we overexpressed Panx1 in Nfe2l2−/− BMDMs. Overexpression of Panx1 in Nfe2l2−/− BMDMs enabled LPS to stimulate production of IL-1β when BMDMs were cultured on soft ECM or plastic plates (Fig. 4f,g). Overexpression of Panx1 minimally increased IL-1β release induced by treatment with LPS and ATP (Extended Data Fig. 10j). No genotype-specific differences in pro-IL-1β production were observed (Fig. 4g). The induction of Panx1 by NRF2 is therefore necessary and sufficient for one-signal activation of NLRP3.
NRF2 mediates reduced NLRP3 activity in osteoclasts
Our findings suggest that macrophages that exist in high stiffness organs should display functional NRF2 and NLRP3 deficiencies. On the basis of this prediction, we examined NRF2 functions in osteoclasts, as bone is the stiffest organ in the body. RNA sequencing analysis was performed on osteoclasts and BMDMs. Osteoclasts displayed lower Nfe2l2 expression and NRF2 target gene expression than BMDMs (Extended Data Fig. 11a). To confirm these findings, we re-analysed a publicly available RNA sequencing dataset74 and similarly found that osteoclasts had lower Nfe2l2 expression and NRF2 target gene expression than BMDMs (Extended Data Fig. 10k). Osteoclasts also had reduced NRF2 protein levels (Extended Data Fig. 10l). Activation of NLRP3 in osteoclasts through LPS + nigericin treatment led to minimal IL-1β release (Extended Data Fig. 11b) compared with BMDMs. Osteoclasts therefore display a functional deficiency in NRF2 and consequently NLRP3.
As KEAP1 does not control Nfe2l2 expression, yet osteoclasts display low Nfe2l2 transcript abundance, KEAP1 may not regulate NRF2 or NLRP3 activities in osteoclasts as it does in BMDMs. Consistent with this idea, Keap1∆M osteoclasts did not display increased NRF2 protein levels, and Keap1∆M osteoclasts did not display increase NLRP3 inflammasome activities (Extended Data Figs. 10l and 11c). Thus, although BMDMs control NLRP3 via KEAP1-mediated NRF2 regulation, osteoclasts regulate NRF2 at the level of Nfe2l2 expression.
Mutations in NLRP3 bypass the NRF2 checkpoint
Mutations in NLRP3 cause systemic autoimmune diseases, the most severe of which is neonatal-onset multisystem inflammatory disease (NOMID)75,76. We recognized the similarity between macrophages with NOMID NLRP3 mutations and WT macrophages cultured on low-stiffness ECM. In both instances, LPS is sufficient to promote IL-1β production. This symmetry in phenotypes raised the possibility that disease-associated NLRP3 mutants may be prone to autoactivation because they bypass the NRF2 checkpoint.
To address this possibility, we investigated NRF2 activity in BMDMs from mice with macrophage-specific expression of one allele of the NOMID NLRP3 mutation: D301N (Nlrp3CA/+)77. As previously reported, Nlrp3CA/+ BMDMs cultured on plastic plates activated the NLRP3 inflammasome in response to LPS alone77, as evidenced by IL-1β secretion and cleavage of IL-1β, caspase-1 and GSDMD (Extended Data Fig. 11d,e). WT and Nlrp3CA/+ BMDMs did not differ in NRF2 protein abundance or the expression of NRF2 target genes, nor did they show any difference in the ability of LPS to regulate the known NRF2 target gene Slc7a11 (Extended Data Fig. 11e–g). These data demonstrate that despite the low NRF2 activities in Nlrp3CA/+ BMDMs, these cells can activate NLRP3 inflammasomes in response to LPS. Consistent with the insensitivity of NLRP3D301N cells to low NRF2 activities, ECM stiffness did not affect NLRP3 activities in Nlrp3CA/+ BMDMs (Extended Data Fig. 11h). On the basis of these data, we reasoned that NOMID mutant cells may retain NLRP3 stimulatory activities under conditions of NRF2 deficiency. To address this possibility, we generated mice with macrophages expressing NLRP3(D301N) and deficient in NRF2 (Nlrp3CA/+;Nfe2l2∆M mice) (Extended Data Fig. 10m). Nlrp3CA/+;Nfe2l2∆M BMDMs retained the ability to release IL-1β after LPS stimulation (Extended Data Fig. 11i). Consistent with these in vitro data, in vivo analysis demonstrated no difference in survival in Nlrp3CA/+;Nfe2l2∆M mice compared with Nlrp3CA mice (Extended Data Fig. 11j). These data suggest that NOMID mutations bypass NRF2 regulation of NLRP3.
NRF2 activity is reduced in fibrotic lungs
Interstitial lung disease (ILD) is a chronic, fibrotic disease of the lung that increases tissue stiffness27. Idiopathic pulmonary fibrosis (IPF) is a subtype of ILD characterized by increased ECM protein abundance, thickened alveolar septa and stiffening alveoli78. We obtained publicly available spatial transcriptomic and single-cell RNA sequencing datasets of lung tissue explanted from patients with ILD and from individuals without lung disease79,80,81. In the spatial transcriptomic dataset79, several subsets of macrophages from patients with fibrosis had lower NRF2 transcriptional activity than macrophages from individuals without lung disease (Fig. 5a). Similar findings were made after pseudobulk analysis followed by gene set variation analysis (GSVA) using NRF2 target genes as the gene set82,83 (Extended Data Fig. 12a). Further analysis determined that patients with ILD had increased fibroblast COL1A1 and COL3A1 expression, which indicated increased collagen production and tissue stiffness (Extended Data Fig. 12b). SPP1+ macrophages from patients with ILD did not show differences in expression of TNF, IL1A or IL1B (Extended Data Fig. 12c). In both single-cell RNA sequencing datasets80,81, alveolar macrophages from patients with IPF demonstrated a reduction in NRF2 transcriptional activity compared with alveolar macrophages from individuals without lung disease (Extended Data Fig. 12d,e).
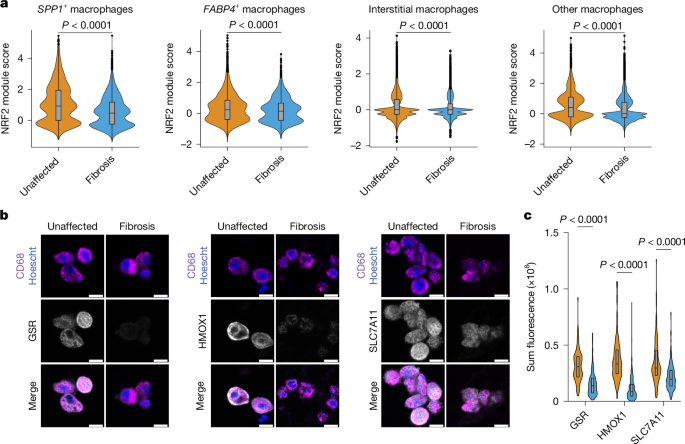
a, NRF2 module score calculations from a previous study79 in four macrophage subtypes in patients with pulmonary fibrosis and from individuals without lung disease (unaffected). The grey box represents 25–75% the interquartile range (IQR) with the line at the median, and whiskers represent the minima and maxima. The total number of cells analysed was as follows: SPP1+ macrophages n = 2,909 (unaffected) and n = 12,492 (fibrosis); FABP4+ macrophages, n = 5,546 (unaffected) and n = 4,079 (fibrosis); interstitial macrophages, n = 25,097 (unaffected) and n = 10,497 (fibrosis); other macrophages, n = 7,975 (unaffected) and n = 25,892 (fibrosis). b, Representative immunofluorescent images of the NRF2 transcriptional targets GSR, HMOX1 and SLC7A11 in human lung tissue from unaffected individuals and patients with lung fibrosis. Scale bar, 10 µm. c, Quantification of alveolar macrophage sum of cellular fluorescence for each NRF2 target. The grey box represents 25–75% the IQR with the line at the median, and whiskers represent the minima and maxima. Data were quantified from five fields of view for two unaffected individuals and two patients with lung fibrosis. The total number of alveolar macrophages analysed was as follows: GSR, n = 83 (unaffected) and n = 138 (fibrosis); HMOX1, n = 119 (unaffected) and n = 292 (fibrosis); and SLC7A11, n = 104 (unaffected) and n = 271 (fibrosis). Data are the median with IQR (a,c); for a, lines were calculated using the Tukey method. Significance was determined using two-sided Mann–Whitney U-test (a) or two-sided Mann–Whitney U-test with Holm–Šídák multiple-comparison test (c).
To validate these findings, we obtained tissue samples from individuals without lung disease and from individuals with IPF and performed immunofluorescence for three NRF2 targets in macrophages: GSR, HMOX1 and SLC7A11 (Extended Data Fig. 12f). Alveolar macrophages from patients with fibrosis had reduced expression of each NRF2 target (Fig. 5b,c and Extended Data Fig. 12g). Similarly, analysis of interstitial macrophages revealed decreased expression of each NRF2 target (Extended Data Fig. 12h). These data suggest that macrophages exposed to high stiffness in vivo (from patients with fibrotic lung disease) have decreased NRF2 activity.
Discussion
On the basis of the data presented, we propose that the in vitro to in vivo disconnects long associated with NLRP3 biology can be explained, at least in part, by differences in ECM stiffness. Underlying NLRP3 regulation is the mechanistic link between ECM stiffness, the actin cytoskeleton, and ROS generation, which regulates NRF2 activity and the induction of Panx1. All of these factors promote one-signal activation of the NLRP3 inflammasome. Our finding that NRF2 supports NLRP3 activation is consistent with previous reports that used genetic deficiency to assess the effect of NRF2 on NLRP3 activity46,47,48. However, previous work using chemical activators of NRF2 reported that NRF2 has anti-inflammatory effects. Although our transcriptional data suggest that some effects of NRF2 activators may be off target, both models can co-exist, and we propose that the relationship between NRF2 and inflammation depends on the context. Indeed, our finding that NRF2 is required for alum-induced peritonitis and for hyperactivator-mediated antitumour immunity (both NLRP3-dependent processes) contrasts with the NRF2-independence of MSU-crystal-induced peritonitis. The contexts in which NRF2 are most important for regulation of NLRP3 require further investigation, and there may be scenarios in which different NRF2 regulators control pathway function. For example, although KEAP1 (and its oxidation state) is likely to be a general regulator of NRF2, other factors such as GSK3 may regulate NRF2 in specific contexts84. Regardless of the mechanism of NRF2 regulation, our findings highlight ECM stiffness as a foundational regulator of NRF2 functions in macrophages. NRF2 may therefore operate as a mechanosensitive checkpoint that controls one-signal NLRP3 activation. The evidence presented herein provides a mandate to consider ECM stiffness as a determinant of immune cell functions in diverse contexts of health and disease.
Methods
No statistical methods were used to predetermine sample sizes. Experiments were not randomized, and investigators were not blinded during experiments or during outcome measurements. Details of specific statistical tests are included in the figure legends. All unique and newly generated materials (cell lines and mice) are available from the authors upon request. All other materials are commercially available.
Mice
All mice used in these studies were on the C57BL/6J background. Both male and female mice were used throughout the studies and no differences were noted based on sex. WT C57BL/6J (000664), Nlrp3−/− (021302), Casp11−/− (024698), Casp1−/−;Casp11−/− (016621), Gsdmd−/− (032410), Nfe2l2−/− (017009), LysM-cre (004781), Keap1f/f (037075), Nlrp3D301NneoR (017971) and Nfe2l2f/f (025433) mice were obtained from The Jackson Laboratory. LysM-cre;Keap1f/f mice were generated in the Kagan Laboratory; LysM-cre;Nlrp3D301NneoR and LysM-cre; Nlrp3D301NneoR;Nfe2l2f/f mice were generated in the Mbalaviele Laboratory. Bone marrow samples from CMV-cre;Panxf/f mice were provided by H.B.d.S.73. Mice were maintained on regular chow and in a specific pathogen-free environment on a 12-h light–dark cycle with continuous access to food and water in a room at approximately 22 °C and 35–70% relative humidity. All animal studies were approved by the Boston Children’s Hospital Institutional Animal Care and Use Committee and conducted under the supervision of the department of Animal Resources at Children’s Hospital.
Ligand and chemical reconstitution
E. coli LPS (serotype O:111 B4) was purchased from Enzo Biosciences as a ready-to-use stock solution of 1 mg ml–1 or purchased from Invivogen and reconstituted in LAL water at a stock concentration of 1 mg ml–1 and used at a working concentration of 100 ng ml–1 for in vitro experiments. R848 was purchased from Invivogen and resuspended in LAL water to a concentration of 1 mg ml–1 and used at 1 µg ml–1. MCC950 was purchased from Invivogen and resuspended in sterile DMSO to a concentration of 20 mM and used at a final concentration of 10 µM. zVAD-FMK was purchased from Invivogen and resuspended in sterile DMSO to a concentration of 10 mg ml–1 and used at a final concentration of 10 µg ml–1. Nigericin was purchased from Invivogen and resuspended in sterile ethanol to a concentration of 6.7 mM and used at a final concentration of 5–15 µM. CL097 was purchased from Invivogen and resuspended in LAL water to a concentration of 1 mg ml–1 and used at a final concentration of 20 µg ml–1. OVA EndoFit was purchased from Invivogen and resuspended in sterile water to a concentration of 10 mg ml–1 and used as described below. IFNγ was purchased from Sino Biological and resuspended in sterile water to a concentration of 50 µg ml–1 and used at a final concentration of 50 ng ml–1. IL-4 was purchased from Sino Biological and resuspended in sterile water to a concentration of 20 µg ml–1 and used at a final concentration of 20 ng ml–1. IL-13 was purchased from Sino Biological and resuspended in sterile water to a concentration of 20 µg ml–1 and used at a final concentration of 20 ng ml–1. FLT3L was purchased from Miltenyi Biotec and resuspended in sterile water to a concentration of 100 µg ml–1 and used at a final concentration of 100 ng ml–1. ATP was purchased from Sigma-Aldrich, and fresh stock solutions were made at the time of each experiment by resuspending in PBS to a concentration of 100 mM and used at a final concentration of 5 mM. PGPC was purchased from Cayman Chemical as a solution in ethanol, solvent was evaporated under gentle nitrogen stream, dried lipids were resuspended in serum-free medium to a final concentration of 1 mg ml–1 and used at a final concentration of 100 µg ml–1 for in vitro experiments or 65 µg per mouse for in vivo experiments. Recombinant human M-CSF (CHO expressed, carrier-free) was purchased from R&D Biosystems and resuspended in sterile PBS pH 7.4 to a concentration of 100 µg ml–1. NAC was purchased from Sigma-Aldrich and resuspended in sterile PBS to a concentration of 500 mM, pH adjusted to 7.4 using sodium hydroxide and used at a final concentration of 5 mM. MitoTEMPO was purchased from Sigma-Aldrich and resuspended in sterile water to a concentration of 15 mM and used at a final concentration of 15 µM. Cytochalasin D was purchased from Cayman Chemicals and resuspended in sterile DMSO to a concentration of 20 mM and used at a final concentration of 20 µM. Jasplakinolide was purchased from Sigma-Aldrich as a stock solution of 1 mM in sterile DMSO and used at a final concentration of 1 µM. Y-27632 was purchased from Tocris Biosciences and resuspended in sterile DMSO to a concentration of 10 mM and used at a final concentration of 10 µM. ML-7 was purchased from Tocris Biosciences and resuspended in sterile DMSO to a concentration of 10 mM and used at a final concentration of 10 µM. 4-Octyl itaconate was purchased from Cayman Chemicals and resuspended in sterile DMSO to a concentration of 125 mM and used at a final concentration of 125 µM. Dimethyl fumarate was purchased from Cayman Chemicals and resuspended in sterile DMSO to a concentration of 25 mM and used at a final concentration of 25 µM. Sulforaphane was purchased from Cayman Chemicals and resuspended in sterile ethanol to a concentration of 25 mM and used at a final concentration of 5 µM. Tert-butylhydroquinone was purchased from MedChem Express and resuspended in sterile DMSO to a concentration of 100 mM and used at a final concentration of 100 µM. KI696 was purchased from MedChem Express and resuspended in sterile DMSO to a concentration of 1 mM and used at a final concentration of 1 µM. MDIVI-1 was purchased from Sigma-Aldrich and resuspended in DMSO to a concentration of 20 mM and used at a final concentration of 10 µM. Drpitor1a was purchased from MedChem Express and resuspended in sterile DMSO to a concentration of 10 mM and used at a final concentration of 0.5 µM. Probenecid was purchased from Sigma-Aldrich and resuspended in sterile PBS pH 7.4 to a final concentration of 100 mM, pH adjusted with NaOH, and used at a final concentration of 1 mM. Trovafloxacin was purchased from Sigma-Aldrich and resuspended in sterile H2O to a concentration of 25 mM and used at a final concentration of 25 µM. oxATP was purchased from Sigma-Aldrich and resuspended in sterile PBS pH 7.4 to a concentration of 100 mM and used at a final concentration of 300 µM. ML171 was purchased from Sigma-Aldrich and resuspended in sterile DMSO to a concentration of 20 mM and used at a final concentration of 1 µM. GSK2795039 was purchased from Tocris Biosciences and resuspended in sterile DMSO to a concentration of 20 mM and used at a final concentration of 10 µM. GKT137831 was purchased from Cayman Chemical and resuspended in sterile DMSO to a concentration of 20 mM and used at a final concentration of 10 µM. MG132 was purchased from Invivogen and resuspended in sterile DMSO to a concentration of 20 mM and used at a final concentration of 10 μM.
Antibodies for immunoblotting
The following primary antibodies for were used for immunoblotting: polyclonal goat biotinylated anti-mouse IL-1β and polyclonal goat biotinylated anti-human IL-1β (both from R&D Biosystems); polyclonal rabbit anti-mouse IL-1β and polyclonal rabbit anti-human IL-1β (both from GeneTex); monoclonal rabbit anti-mouse cleaved GSDMD-NT and monoclonal rabbit anti-NRF2 (both from Abcam); monoclonal mouse anti-mouse caspase-1 p20 and monoclonal mouse anti-NLRP3 (both from Adipogen); monoclonal rabbit anti-mouse NRF2, monoclonal rabbit anti-KEAP1, polyclonal rabbit anti-lamin-A/C, monoclonal rabbit anti-pS172 IKKε, monoclonal rabbit anti-pS172 TBK1, monoclonal rabbit anti-pT180/Y182 P38, polyclonal rabbit anti-pT183/Y185 JNK, monoclonal mouse anti-pT202/Y204 ERK and monoclonal rabbit anti-pS536 P65 (all from Cell Signaling); monoclonal mouse anti-β-tubulin (Developmental Studies Hybridoma Bank); and monoclonal mouse anti-actin (Sigma-Aldrich). All primary antibodies were used at a 1:1,000 dilution in TBS pH 7.4 and 0.1% Tween-20 and 5% BSA, except for mouse anti-actin, which was used at 1:5,000 in the same buffer. Uncropped and unprocessed scans of all western blots in this study are available in the Source Data.
Flow cytometry
For assessment of macrophage depletion, anti-mouse/human-CD11b (clone M1/70) and anti-mouse-F4/80 (clone BM8) were purchased from BioLegend, whereas mouse FC Block was purchased from BD Biosciences. In brief, 1 × 10⁶ peritoneal lavage cells were resuspended in 70 µl FACS buffer (PBS, 2.5 mM EDTA, 2% FBS) containing FC block and incubated on ice for 15 min. Subsequently, fluorescently conjugated primary antibodies were added to a final dilution of 1:200 and cells were incubated on ice for 30 min. Cells were washed with FACS buffer and resuspended in FACS buffer containing 1 µg ml–1 DAPI (Biotium) to stain dead cells and passed through a 30 µm strainer. Data were acquired on an LSR II flow cytometer (BD Biosciences) and analysed using FlowJo software (Tree Star). The gating strategy is presented in Supplementary Fig. 1.
In vivo LPS injection
Age-matched male or female C57BL/6J, Nlrp3−/−, Casp11−/−, Casp1−/−;Casp11−/− and Nfe2l2−/− mice were ear tagged and weighed the day before an experiment. The next day, mice were injected (i.p.) with E. coli LPS (serotype O111:B4) at a dose of 10 mg kg–1 in a final volume of 200 µl (or equal volume PBS pH 7.4 as a control). Plasma was collected by retroorbital bleeding using microhaematocrit heparinized capillary tubes (Fisher Sciences) and placed in microtainer tubes with lithium heparin (BD Biosciences). Red blood cells (RBCs) were pelleted by centrifugation at 6,000g for 5 min at 4 °C. Plasma was removed and stored at −80 °C until assay. To isolate peritoneal fluid, mice were euthanized by CO2 asphyxiation, sprayed with ethanol and the peritoneal cavity was lavaged with 5 ml ice-cold PBS pH 7.4. The peritoneal lavage was collected and cells were pelleted by centrifugation at 400g for 5 min at 4 °C. Peritoneal lavage supernatant was transferred to a separate tube and stored at −80 °C until assay.
Clodronate liposome depletion of peritoneal macrophages
Age-matched male or female C57BL/6J mice were ear tagged and injected (i.p.) with 100 µl Clodrosome or control Encapsome liposomes (Encapsula Nanosciences). Three days after injection of clodronate, mice were either injected with LPS as described above or euthanized, and peritoneal lavage cells were collected in PBS pH 7.4 with 2.5 mM EDTA as outlined above to assay macrophage depletion by flow cytometry.
Cell culture
All cells were cultured in humidified incubators at 37 °C and 5% CO2. Primary BMDMs, iBMDMs and HEK293T cells (obtained from the American Type Culture Collection, not authenticated and not tested for mycoplasma) were cultured in DMEM (Gibco) with 10% FBS (R&D Systems), penicillin–streptomycin (Gibco), l-glutamine (Gibco) and sodium pyruvate (Gibco), hereafter referred to as complete DMEM (cDMEM). BMDCs were cultured in IMDM (Gibco) with 10% FBS, penicillin–streptomycin, l-glutamine and sodium pyruvate, hereafter referred to as complete IMDM (cIMDM). Human monocytes and MDMs were cultured in RPMI supplemented with 10% FBS, penicillin–streptomycin, l-glutamine and sodium pyruvate, hereafter referred to as complete RPMI (cRPMI). Cytosoft plates corresponding to normal tissue (soft, 2 kPa, 5141) or fibrotic tissue (stiff, 32 kPa, 5144) were purchased from Advanced Biomatrix. Cytosoft plates and plastic tissue culture (TC) plates were coated with fibronectin (Advanced Biomatrix, 5050) at 1 µg cm–2 in PBS according to the manufacturer’s instructions. Plates were washed twice with PBS and cells were seeded in 3 ml medium.
Primary BMDM generation and immortalization, and primary BMDC generation
BMDMs were differentiated from whole bone marrow derived from tibia and femurs of C57BL/6J, Nlrp3−/−, Casp11−/−, Casp1−/−;Casp11−/−, Gsdmd−/−, Nfe2l2−/−, Keap1f/f, LysM-cre;Keap1f/f and CMV-cre;Panxf/f mice. In brief, mice were euthanized by CO2 asphyxiation and leg bones were surgically removed and cleaned of surrounding muscle and tissue. Bones were washed once in 70% ethanol, washed in PBS and 2.5 mM EDTA with penicillin–streptomycin and then stored in a solution of PBS, 2.5 mM EDTA and penicillin–streptomycin until processing. All future steps were undertaken in a Biosafety Cabinet. Bones were scraped clean of tissue using sterilized razor blades, the ends of the tibia and femurs were cut and bones were placed into a sterile 0.6 ml tube with perforations at the base. The 0.6 ml tube with bones was placed into a sterile 2 ml tube and the nested tubes were spun at 12,000g for 15 s in a tabletop centrifuge. Cell pellets were resuspended in PBS pH 7.4 and 2.5 mM EDTA and spun at 400g for 5 min followed by RBC lysis using ACK buffer (Gibco) for 1 min at room temperature. Lysis was stopped by adding a 10-fold volume of PBS and 2.5 mM EDTA and cells were pelleted at 400g for 5 min. A total of 4 × 10⁶ cells were seeded per 10 cm non-TC-treated plate and differentiated in cDMEM supplemented with 30% L929 supernatants containing M-CSF for 6 days. Immortalization of WT and Nfe2l2−/− BMDMs was performed using J2 virus supernatants as previously described85.
Primary BMDCs were differentiated from whole bone marrow derived from tibia and femurs of C57BL/6J, Nfe2l2−/−, Keap1f/f and LysM-cre;Keap1f/f mice isolated as described above. For in vitro experiments testing R848 and PGPC, a total of 4 × 10⁶ cells were seeded per 10 cm non-TC treated plate and differentiated in cIMDM supplemented with 30% B-16 supernatants containing GM-CSF for 6 days. For in vivo experiments using adoptive transfer of BMDCs, a total of 10 × 106 cells were seeded per non-tissue culture treated 6-well plate and cultured in cIMDM supplemented with 100 ng ml–1 FLT3L (Miltenyi) for 8 days.
Retroviral transduction of immortalized and primary BMDMs
Panx1 cDNA was ordered as a gBlock (IDT) and cloned using Gibson Assembly into pMSCV-IRES-GFP. Effective cloning was confirmed using restriction enzyme digestion and Sanger sequencing. Generation of retrovirus was done in 293T cells.
For transduction of iBMDMs, 293T cells were plated in a 6-well dish at one well per construct. Cells were then transfected with pMSCV-IRES-GFP or pMSCV-Panx1-IRES-GFP alongside the helper plasmid pCl-Eco and VSV-g. The next day, supernatants containing virus were collected, clarified by centrifugation at 400g for 5 min at room temperature and filtered through a 0.45 µm PVDF filter. Polybrene (Sigma-Aldrich) was added to the viral supernatants at a 1:2,000 dilution. Viral supernatants were then placed on top of iBMDMs in 12-well plates which were spinfected at 1,250g for 1 h at 30 °C. iBMDMs were transduced again the following day. iBMDM transduction was confirmed by fluorescence microscopy (evaluating for GFP expression) and by western blotting.
For transduction of primary Nfe2l2−/− BMDMs, primary BMDMs were generated from the bone marrow of Nfe2l2−/− mice as described above. Generation of virus was done in 293T cells plated in 10 cm dishes at one dish per 10 cm dish of differentiating BMDMs. 293T cells were transfected with pMSCV-IRES-GFP or pMSCV-Panx1-IRES-GFP alongside the helper plasmid pCl-Eco and VSV-g and viral supernatants were collected the next day, clarified by centrifugation, and filtered through a 0.45 µm PVDF filter. Viral supernatant was added to BMDM cultures on day 3 of differentiation alongside additional L929 supernatant. BMDMs were differentiated for another 3 days and BMDM transduction was confirmed by fluorescence microscopy (evaluating for GFP expression) and by western blotting. BMDMs were plated for experiments as described elsewhere.
Osteoclast generation
Bone marrow was isolated as described above and cultured in the presence of a 1:10 dilution CMG supernatant (a source of M-CSF) for 4–5 days. BMDMs were then seeded at the following concentrations: 1 × 10⁴ cells per well of a 96-well plate, 4 × 10⁵ cells per well of a 6-well plate or 8 × 10⁵ cells per P60 dish. Osteoclast differentiation was induced in a 1:50 dilution of CMG medium with addition of receptor activator of NF-κB ligand (RANKL) at 50–100 ng ml–1 for 5–6 days. For NLRP3 activation, cells were stimulated with 100 ng ml–1 LPS for 3 h followed by 15 µM nigericin for 1 h, after which supernatant was assayed for IL-1β.
Immunizations and B16 melanoma tumour model
For prophylactic immunization experiments, 7-week-old female C57BL/6J WT and Nfe2l2−/− mice were subcutaneously injected near the shoulders with 200 µg per mouse OVA (EndoFit OVA, Invivogen), 5 µg per mouse R848 (Invivogen) and 65 µg per mouse of PGPC (Cayman Chemical) emulsified in incomplete Freund’s adjuvant (Sigma-Aldrich). Mice received a booster dose 14 days later. Seven days after receipt of the booster immunization, mice had 3 × 10⁵ B16-OVA cells subcutaneously implanted on the flank.
For adoptive DC immunization experiments, 7-week-old female C57BL/6J WT mice had 3 × 10⁵ B16-OVA cells subcutaneously implanted on the flank. On day 8 of BMDC differentiation, FLT3L–BMDCs were stimulated with 500 ng ml–1 R848 for 3 h and then treated with 100 µg ml–1 PGPC for 18 h. BMDCs were subsequently loaded with 500 µg ml–1 OVA for 1 h, washed and resuspended in PBS. A total of 1 × 10⁶ DCs per mouse was subcutaneously injected between the shoulders. BMDC injections were performed 7, 14 and 21 days after implantation of B16-OVA cells.
For all experiments, tumour sizes were measured every other day by recording the length and width using a caliper. Mice were euthanized when the humane end point was reached, which was defined as tumour area >2 cm2 or tumour ulceration.
MSU and alum-induced peritonitis models
MSU-induced peritonitis was performed as previously described86. In brief, a 10 mg ml–1 solution of MSU (Invivogen; tlrl-msu) was prepared in sterile PBS. Mice were injected (i.p.) with 180 µl of 10 mg ml–1 MSU using a 29 G insulin syringe. Similarly, alum-induced peritonitis was performed by injecting mice (i.p.) with 200 µl of a 1:9 dilution of Alhydrogel (Invivogen; vac-alu-50) in PBS. At 3 h (MSU) or 16–24 h (alum) after injection, peritoneal lavage was performed on the mice using 5 ml sterile PBS. Lavage fluid was collected through a 25 G needle and immune cells were pelleted. Cells were stained with a Live/Dead fixable stain (Invitrogen) and Fc block (BioLegend; clone S17011E) according to the manufacturer’s recommendations. Cells were then stained with CD45 (BV711; clone 30-F11), Ly6G (FITC; clone 1A8) and Ly6B.2 (PE; clone REA115). Neutrophils were defined by flow cytometry as live, CD45+Ly6G+Ly6B.2+ and represented as a proportion of CD45+ cells. Alum-treated mice with <11% neutrophils (non-responders) were excluded from the analysis (two mice per group, four mice in total excluded).
Isolation and culture of peritoneal macrophages
Mice were euthanized by CO2 asphyxiation, sprayed with 70% ethanol and the peritoneal cavity was lavaged with 5 ml PBS containing 2.5 mM EDTA. The peritoneal lavage containing resident peritoneal macrophages was centrifuged at 400g for 5 min at room temperature and the pellet resuspended in cDMEM. For experiments evaluating the activation of the NLRP3 inflammasome in plastic TC plates, peritoneal lavages from 2–3 mice were pooled and cells were plated across 12 wells of a 96-well dish. For experiments evaluating the role of stiffness on inflammasome activation, peritoneal lavages from 5 mice were pooled and cells were plated across 9 wells of 6-well dishes (3 wells for each stiffness). After 2 h, cells were washed 3 times with PBS to remove contaminating non-macrophages and cultured in cDMEM overnight. Cells were then stimulated with 100 ng ml–1 LPS for 24 h followed by 5 mM ATP for 30 min. Cell culture supernatants were saved for ELISA and IL-1β immunoprecipitation. Cells were lysed in 1× SDS loading buffer containing 2% β-mercaptoethanol (β-ME) and heated at 65 °C for 10 min followed by separation by SDS–PAGE.
Human monocyte isolation and generation of MDMs
Human buffy coat was purchased from BioIVT and shipped on ice on the day of collection. All buffy coat samples were anticoagulated with EDTA and were confirmed to be free of common viral infections. Buffy coat was mixed 1:1 with PBS and 2.5 mM EDTA and overlaid on 15 ml Ficoll-Paque Plus (Cytiva). The sample was spun at 800g for 35 min at 22 °C without break. The plasma was aspirated and discarded. Peripheral blood mononuclear cells (PBMCs) were placed in a fresh conical tube and washed in MACS buffer (PBS, 2.5 mM EDTA, 2% FBS and penicillin–streptomycin). Cells were spun at 300g for 10 min, pooled together and washed a second time in MACS buffer. RBCs were lysed in ACK buffer for 5 min and the reaction was stopped with fivefold addition of MACS buffer. PBMCs were washed an additional time to remove residual ACK buffer and the final pellet was resuspended in 10 ml MACS buffer and filtered through a 30 µm filter. Monocytes were isolated using human anti-CD14 beads (Miltenyi Biotec) and MACS LS columns (Miltenyi Biotec). In brief, the pellet was resuspended in 80 µl MACS buffer per 107 PBMCs and 20 µl anti-CD14 beads were added per 107 PBMCs. Cells were incubated on ice in the dark for 15 min, washed with 20 ml MACS buffer followed by centrifuging at 300g for 10 min. The cell pellet was resuspended in 2.5 ml MACS buffer per buffy coat and applied to an equilibrated LS column. The column was washed 3 times with 2.5 ml ice-cold MACS buffer and cells were eluted in 5 ml ice-cold MACS buffer. Next, 2 × 10⁷ CD14+ cells were cultured on a tissue culture treated T75 flask in 15 ml cRPMI and 30 ng ml–1 recombinant human M-CSF. The medium was exchanged every 2 days and cells were considered differentiated into macrophages on day 6. Cells were lifted using Macrophage Detachment Solution DXF (PromoCell) per the manufacturer’s protocol and plated at 1 × 10⁶ cells per well in variable stiffness plates or 1 × 10⁵ cells per well in 96-well plates.
DC and T cell co-culture
C57BL/6J WT mice were subcutaneously immunized with 100 µg OVA emulsified 1:1 in incomplete Freud’s adjuvant (Invivogen) on one shoulder and boosted on day 7 on the opposite shoulder. On day 14 of immunization, spleens were collected and CD8+ T cells were isolated by negative selection (BioLegend) and resuspended in cRPMI containing 10% FBS, 1% penicillin–streptomycin and 10 µM β-ME. FLT3L-derived BMDCs were generated and activated overnight using R848 and PGPC as described above. Activated BMDCs were collected, counted and plated at 1 × 10⁴ cells per well in 96-well round-bottom plates, pulsed with 1 mg ml–1 OVA for 1 h and washed with PBS. Enriched CD8+ T cells from OVA-immunized mice were added at 1 × 10⁵ cells per well (10:1 ratio of CD8+ T cells to DCs) in a final volume of 100 µl and cultured for 7 days. Supernatants were collected, clarified by centrifugation and stored at −20 °C for IFNγ ELISA analysis.
Macrophage stimulation
Primary BMDMs or human MDMs were typically seeded at the following numbers according to the assay being performed: 1 × 10⁶ cells per well in fibronectin-coated 6-well Cytosoft or plastic TC plates or 0.5 × 10⁶ cells per well in 12-well TC plates for RNA isolation; 0.25 × 10⁶ cells per well in 24-well TC plates for ELISAs; or 0.1 × 10⁶ cells per well in 96-well TC plates for LDH assays. Cells were incubated overnight in cDMEM and 10% L929 supernatants or in cRPMI and 30 ng ml–1 human M-CSF for MDMs. iBMDMs were seeded at 0.5 × 10⁵ cells per well in a 96-well TC plate and incubated overnight in cDMEM. The next morning, the medium was exchanged to cDMEM with or without inhibitors (or vehicle control), and cells incubated for 30 min. A subset of cells were left unstimulated whereas others were stimulated with LPS at 100 ng ml–1 for up to 6 h followed by inflammasome activation with 5 mM ATP for 2 h (for LDH release or GSDMD oligomerization assays), 5 mM ATP for 30 min (for IL-1β ELISA and IP), 5 µM nigericin for 30 min (ASC specks), 5 µM nigericin for 2 h (for IL-1β ELISA and LDH release) or 20 µg ml–1 CL097 for 2 h.
For examination of oxidized lipid activation of the inflammasome, BMDMs or BMDCs were seeded at 1 × 10⁵ cells per well in 96-well TC plates and incubated overnight. Cells were primed with R848 at 62.5 ng ml–1 for 3 h followed by stimulation with PGPC at 100 µg ml–1 for an additional 24 h.
LDH assay
Lytic cell death was quantified using a LDH-release assay with a CyQuant LDH cytotoxicity assay kit (Thermo Fisher Scientific). In a 96-well plate, 25 µl cell-free supernatants was mixed with 25 µl LDH assay buffer and incubated for 15 min at 37 °C in the dark. The reaction was stopped by addition of 25 µl stop solution. Absorbance at 490 nm and 680 nm was measured on a Tecan Spark plate reader and the signal was normalized to equivalently treated control samples in which cells were lysed using a detergent-containing lysis buffer.
Cytokine measurements by ELISA
Cytokine release into cell culture supernatants, mouse plasma or mouse peritoneal fluid were assayed for mouse IL-1β and TNF using uncoated ELISA kits (Thermo Fisher Scientific), human IL-1β using a Lumit Human IL-1β Immunoassay kit (Promega) or human TNF using ELISA MAX Deluxe kit (BioLegend) according to the manufacturers’ protocols. For experiments using PGPC, mouse IL-1β was assessed using a Lumit Mouse IL-1β Immunoassay kit (Promega).
NRF2 immunoprecipitation
Primary mouse BMDMs were plated at 2 × 10⁶ cells per well on soft and plastic plates and cultured overnight. A total of two wells were used per stiffness and treatment condition. Cells were left untreated or treated with 100 ng ml–1 LPS for 6 h and then lysed in-well with 600 μl NP-40 lysis buffer (TBS pH 7.4, 1% NP-40, 5% glycerol and protease inhibitors) per well. The lysate was spun at 20,000g for 5 min. Next, 120 μl clarified lysate was saved as input whereas the rest was incubated protein G Sepharose beads (GE Healthcare) loaded with anti-NRF2 antibody (Cell Signaling Technology, 12721S) at 4 °C for 1 h. Afterwards, 2 µg NRF2 antibody was added to each sample. After incubation, the beads were washed 3 times with NP-40 lysis buffer, and bound proteins were eluted in 120 μl 1× sample buffer containing 2% β-ME. Samples were heated to 95 °C for 20 min followed by separation by SDS–PAGE.
IL-1β immunoprecipitation
Cell culture supernatants were transferred into microcentrifuge tubes and depleted of cells and debris by centrifuging at 400g for 5 min. Peritoneal lavage fluid was prepared as described above. Equal volumes of cell-free supernatants or peritoneal lavage fluid were mixed with 0.5 µg biotinylated goat anti-mouse IL-1β or anti-human IL-1β antibody and 20 µl dry weight neutravidin agarose beads (Thermo Fisher Scientific). Samples were incubated overnight at 4 °C while rotating, washed 3 times with PBS pH 7.4 and protein was eluted in 50 µl 1× sample buffer containing 2% β-ME. The remaining cells in the well were lysed in 1× sample buffer and served as lysate control. Samples were heated to 65 °C for 10 min followed by separation by SDS–PAGE. IL-1β was detected by immunoblotting using Bio-Rad Image Lab. Cell-associated actin was detected as the loading control.
Analysis of inflammasome activation by western blotting
For analysis of inflammasome activation in cells cultured on variable stiffness plates, primary mouse BMDMs were plated at 3 × 10⁶ cells per well and cultured overnight. The medium was exchanged for OptiMEM (Gibco) and cells were left untreated or treated with 100 ng ml–1 LPS for 6 h or 100 ng ml–1 LPS for 4 h followed by 5 mM ATP for 2 h. The cell culture supernatant was removed, cleared of debris by centrifugation at 400g for 5 min at room temperature and then protein was precipitated by adding trichloroacetic acid to a final concentration of 10%. Samples were incubated overnight at 4 °C while rotating, protein was pelleted by centrifugation at 13,000g at 4 °C for 15 min and was washed twice with 400 µl ice-cold acetone. Protein pellets were air dried at 65 °C for 5 min. Protein was solubilized in 1× sample buffer containing 2% β-ME. The remaining cells in the well were lysed in 1× sample buffer containing 2% β-ME and served as lysate control. All samples were heated to 65 °C for 10 min followed by protein separation by SDS–PAGE.
For analysis of inflammasome activation in WT, Nfe2l2−/−, Keap1f/f and LysM-Cre;Keap1f/f primary BMDMs, 1 × 10⁶ cells per well were plated in a 24-well dish and cultured overnight in cDMEM. For analysis of inflammasome activation in iBMDMs, 1 × 10⁶ cells per well were plated in a 24-well dish and cultured for 1 h in cDMEM. Cells were then left untreated or treated with 100 ng ml–1 LPS for 4 h, medium was removed and OptiMEM containing nigericin was added for 1–2 h. Cells and supernatant were lysed together by addition of 5× sample buffer containing 10% β-ME, lysates were needle homogenized and samples were heated to 95 °C for 5 min followed by protein separation by SDS–PAGE.
GSDMD oligomerization assay
Primary mouse BMDMs from WT and Gsdmd−/− mice were plated at 3 × 10⁶ cells per well in soft (2 kPa) or plastic plates and cultured overnight. The medium was exchanged for OptiMEM and cells were left untreated or treated with 100 ng ml–1 LPS for 6 h or 100 ng ml–1 LPS for 4 h followed by 5 mM ATP for 2 h. Protein was precipitated as outlined above and solubilized in 1× sample buffer without reducing agent. Protein was solubilized by incubating at 65 °C for 5 min, after which samples were split equally into two tubes and β-ME or an equal volume of ddH2O was added to generate reducing and non-reducing samples, respectively. Whole-cell lysate was generated by adding 1× sample buffer to the remaining cells, solubilizing at 65 °C for 5 min, splitting the sample equally and adding either β-ME or an equal volume of ddH2O to generate reducing and non-reducing samples. The final concentration of β-ME was 2%. Proteins were separated by SDS–PAGE on a 4–12% acrylamide gradient gel (Thermo Fisher Scientific) and GSDMD was detected by western blotting. The assembled GSDMD pore is resistant to SDS under non-reducing conditions and thus oligomerization was indicated by a gel shift towards a higher molecular weight. Cell-associated actin was detected as the loading control.
Nuclear–cytoplasmic fractionation
Fractionation was performed as previously described87. In brief, primary BMDMs derived from WT and Nfe2l2−/− mice were seeded in variable stiffness plates at 3 × 10⁶ cells per well. A total of 3 wells were used per genotype and stiffness and BMDMs were cultured overnight. Cells were placed on ice and washed once with ice-cold PBS. Cells were scraped into ice cold PBS, spun at 10,000g for 10 s, and PBS was aspirated. Cells were lysed in 900 µl PBS, 0.1% NP-40 and protease inhibitors by trituration with a P1000 pipette. A total of 300 µl of this was saved as whole-cell lysate. The remaining 600 µl lysate was spun at 10,000g for 10 s and 300 µl of the supernatant was saved as the cytoplasmic fraction. Next, 75 µl of 5× sample buffer containing 10% β-ME was added to the whole-cell lysate and cytoplasmic fractions to denature the protein. The remaining supernatant was aspirated, and the nuclear pellet was washed with 1 ml PBS, 0.1% NP-40 and protease inhibitors. The nuclear pellet was lysed in 300 µl 1× sample buffer containing 2% β-ME. All fractions were needle homogenized and then boiled at 100 °C for 5 min. Tubulin and lamin A/C served as markers for the cytosol and nucleus, respectively. Cell-associated actin was detected as the loading control.
Detection of cellular ROS
Cells were seeded at 1 × 10⁶ primary BMDMs per well in 6-well 2 kPa Cytosoft or plastic Petri dishes coated with fibronectin. One well was left without cells as a blank. Cells were cultured overnight in the presence or absence of NAC (5 mM, pH 7.4), MitoTempo (15 µM), ML171 (1 µM), GSK2795039 (10 µM) or GKT137831 (10 µM). The next morning, cells were incubated with 20 µM H2DCFDA in 1× HBSS without phenol red for 30 min. Cells were then washed 3 times with HBSS without phenol red and bottom read fluorescence was read using a TecanSpark with an excitation wavelength of 490 nm, emission wavelength of 535 nm and bandwidth of 20.0. Cells were then lysed in 350 µl RNA lysis buffer containing 1% β-ME and stored at −20 °C until further processing.
ASC speck assay
iBMDMs were seeded on glass coverslips at 2.5 × 10⁵ cells per well in 24-well dishes and left to adhere for 1 h. Primary BMDMs were seeded on glass coverslips at 1 × 10⁵ cells per well in 24-well dishes in cDMEM and 10% L929 supernatants, left to adhere overnight. The next morning, medium was removed and replaced with cDMEM. Cells were stimulated with 100 ng ml–1 LPS for 4 h, after which medium was aspirated and replaced with 450 µl OptiMEM containing zVAD-FMK with or without nigericin for 30 min. Cells were fixed by the addition of 150 µl of 16% EM-grade aqueous paraformaldehyde (Thermo Fisher Scientific). Cells were washed twice with PBS pH 7.4 and stored overnight at 4 °C. The next morning, cells were permeabilized and blocked for 30 min in PBS pH 7.4 containing 0.2% BSA and 0.05% saponin (blocking buffer). Cells were washed 3 times in PBS pH 7.4 and primary antibody staining was performed for 1 h in blocking buffer containing polyclonal rabbit anti-ASC antibody (Adipogen) at 1:100 dilution in a humidified chamber. Cells were washed 5 times in PBS pH 7.4 and secondary antibody staining was performed for 1 h in blocking buffer containing Alexa Fluor 488-tagged polyclonal goat anti-rabbit IgG (Thermo Fisher Scientific) at a 1:200 dilution, Alexa Fluor 647-tagged phalloidin (Thermo Fisher Scientific) at 1:400 dilution and DAPI (Biotum) at 1 µg ml–1 in a humidified chamber in the dark. Cells were washed 5–10 times in PBS pH 7.4, mounted on glass slides using prolong glass antifade mountant (Thermo Fisher Scientific) and left to cure overnight at room temperature in the dark. Images were acquired on a Zeiss LSM 880 with Airyscan and processed using Zeiss Zen Blue (v.2.3SP1). ASC specks were manually counted, and nuclei were counted in Fiji (v.2.16.0) using the Analyze particles algorithm.
Immunofluorescence of NRF2 targets in human lung tissue
Tissue samples for these experiments were isolated from discarded explanted human lung tissue specimens collected at Massachusetts General Hospital. Patients provided informed consent, and discarded tissue samples from non-diseased donors were collected under Massachusetts General Hospital IRB number 2016P001890. Discarded tissue from patients with ILD were collected under Massachusetts General Hospital IRB number 2013P002332. Samples were fixed in 4% buffered paraformaldehyde and then embedded in paraffin. The following primary antibodies were used for immunofluorescence: monoclonal mouse anti-human CD68 (Abcam, ab955), polyclonal rabbit anti-human SLC7A11 (Abcam, ab37185), polyclonal rabbit anti-human HMOX1 (Proteintech, 10701-1-AP) and polyclonal rabbit anti-human GSR (Proteintech, 18257-1-AP). Paraffin-embedded tissue was sectioned at 5 µm slices onto glass slides, deparaffinized and then rehydrated. Antigen retrieval was performed using Tris-EDTA pH 9 for 5 min in a pressure cooker, after which samples were cooled and tissue was circled using a hydrophobic pen. Sections were permeabilized and blocked using sterile filtered PBS, 1% BSA and 0.3% Triton X-100 (blocking-staining buffer). Sections were stained with primary antibody at 4 °C overnight at the following dilutions: CD68, 1:100; HMOX1, 1:50; GSR, 1:50; and SLC7A11, 1:100. Sections were washed 5 times in blocking–staining buffer and then left in blocking–staining buffer for 10 min. Secondary antibody staining was performed at room temperature in blocking–staining buffer containing Alexa Fluor 594-tagged polyclonal goat anti-rabbit IgG and Alexa Fluor 647-tagged polyclonal goat anti-mouse IgG (Thermo Fisher Scientific, 1:400) along with Hoechst (Thermo Fisher Scientific, 1:2,000) for 2 h. Samples were then washed 5 times with blocking–staining buffer, submerged in PBS pH 7.4 and 0.1% Triton X-100 for 30 min, dipped in deionized water and mounted with Fluoromount-G mounting medium (Southern Biotech). Samples were imaged on a Zeiss Axio Imager.M2 widefield microscope and a Zeiss LSM 780 confocal microscope.
Cells were detected using Cellpose (v.2.0) and the implemented model ‘Cellpose fluorescence’ (CP) with the following parameters: average cell diameter 50 pixels (12.2 µm), flow threshold 2.0 and cell probability threshold –3. Segmentation was performed on the stained cells using nuclei as a secondary channel for detection. The resulting labels were filtered for a minimum size of 600 pixels (35.4 µm2), and the resulting labels were used to calculate fluorescence values of the corresponding cells. An empirically determined threshold for the average CD68 fluorescence intensity was used to discriminate alveolar macrophages from interstitial macrophages and stromal cells following histogram normalization of the underlying imaging data. The mean fluorescence intensity and sum of fluorescence per cell were plotted in PRISM (GraphPad).
Transmission electron microscopy
BMDMs were grown on Cytosoft 2 kPa plates or glass cover slips, both coated with fibronectin as described above. BMDMs were immersion-fixed in 2.5% glutaraldehyde (Electron Microscopy Sciences), 2% paraformaldehyde (Electron Microscopy Sciences) and 0.3% picric acid (Sigma-Aldrich) in 0.1 M sodium cacodylate (Sigma-Aldrich) pH 7.4 for 1 h at room temperature. BMDMs were washed with 0.1 M sodium cacodylate and then post-fixed for 1 h at 4 °C in 1% osmium tetroxide (Electron Microscopy Sciences) in 0.1 M sodium cacodylate. BMDMs were then washed in DI water and incubated in 2% aqueous uranyl acetate (Electron Microscopy Sciences) overnight at 4 °C. The following day, BMDMs were washed with DI water and then dehydrated at 4 °C in a graded ethanol series. BMDMs were then brought to room temperature and dehydrated with 100% ethanol (Sigma-Aldrich). Infiltration with LX112 resin (Ladd Research) was followed by embedding in flat-bottom Beem capsules (Electron Microscopy Sciences) cut to form a cylindrical mould on the growing substrate. The resulting blocks were separated from the culture plates using liquid nitrogen and then sectioned using a Leica Ultracut E ultramicrotome (Leica Microsystems). Sections were then placed on formvar and carbon-coated grids (Electron Microscopy Sciences). The sections were contrast stained with 2% uranyl acetate followed by lead citrate (Sigma-Aldrich) and imaged in a Jeol 1400 transmission electron microscope (Jeol) equipped with a Gatan Orius SC1000 digital CCD camera (Gatan). Mitochondrial length was manually measured in Fiji (v.2.16.0).
RT–qPCR
RNA was isolated using a PureLink RNA Mini kit (Thermo Fisher Scientific). In brief, cells were collected in lysis buffer containing 1% β-ME and stored frozen at −20 °C until processing. Equal volumes of 70% ethanol were added to each sample, which were then applied to PureLink RNA columns and processed according to the manufacturer’s protocol. Total RNA was eluted using 50 µl RNAse-free H2O. RT–qPCR was performed using a Taqman RNA-to-Ct 1-step kit (Thermo Fisher Scientific) on equal amounts of RNA per the manufacturer’s protocol. The following Taqman probes were used: Gsta3 (Mm00494798_m1), Nqo1 (Mm01253561_m1), Gsr (Mm00439154_m1), Hmox1 (Mm00516005_m1), Gclm (Mm01324400_m1), Slc7a11 (Mm00442530_m1), Srxn1 (Mm00769566_m1), Txnrd1 (Mm00443675_m1), Nfe2l2 (Mm00477784_m1), Keap1 (Mm00497268_m1), Il1b (Mm00434228_m1), Panx1 (Mm00450900_m1), Il6 (Mm00446190_m1), Nos2 (Mm00440502_m1), Arg1 (Mm00475988_m1), Retnla (Mm00445109_m1), Nox1 (Mm00549170_m1), Cybb (Mm01287743_m1) and Tbp (Mm01277042_m1). Data were normalized to Tbp, analysed using Microsoft Excel and plotted in GraphPad Prism.
For determination of Nfe2l2 deletion, RNA was collected purified from cells using a PureLink RNA Mini kit (Life Technologies) and PureLink DNase I (Invitrogen) following the manufacturer’s instructions. The quality and quantity of RNA were assessed using a Nanodrop spectrophotometer (Thermo Scientific). cDNA was synthesized from 1 μg RNA using a High-Capacity cDNA Reverse Transcription kit (Applied Biosystems). Gene expression was analysed by qPCR using a SYBR Green gene expression assay (Applied Biosystems) and primers were synthesized from IDT. The following mouse Nfe2l2 primer sequences were used: forward 5′-TAGATGACCATGAGTCGCTTGC-3′, reverse 5′-GCCAAACTTGCTCCATGTCC-3′. The following mouse cyclophilin B primer sequences were used: forward 5′-AGCATACAGGTCCTGGCATC-3′, reverse 5′- TTCACCTTCCCAAAGACCAC-3′. Data were normalized to cyclophilin B, and relative mRNA expression was calculated using the \({2}^{\Delta \Delta {C}_{t}}\) method.
RNA sequencing and analyses of BMDMs on variable stiffness plates
BMDMs were seeded at 1 × 10⁶ cells per well in 6-well Cytosoft or plastic Petri dishes coated with fibronectin and cultured overnight. Cells were washed once with PBS, collected in lysis buffer containing 1% β-ME and stored frozen at −80 °C until processing. RNA was processed using the QIAsymphony RNA protocol according to the manufacturer’s instructions. In brief, RNA was extracted using QIAsymphony RNA Isolation kits (Qiagen) on a QIAsymphony SP instrument using the RNA CT 400 protocol. The elution volume for RNA samples was 100 µl. RNA sequencing libraries were constructed from 500 ng total RNA using a KAPA RNA HyperPrep kit (Kapa Biosystems). Library preparation was tested manually and subsequently fully automated on a Biomek i7 Workstation (Beckmen Coulter). Libraries underwent paired-end 75 base-pair sequencing on a NovaSeq6000 (Illumina) at a depth of 50 million reads per sample. Raw reads were aligned to the mouse genome (GRCm39) using the STAR aligner (v.-2.7.5c). Reads mapped to genomic features were counted using the FeatureCounts function from the subread package (v.1.6.0). The count matrix was imported into R (v.4.1.3) and low-expressed genes were filtered out (included genes required ≥1 CPM in at least 20% of samples). Trimmed mean of M-values was computed using edgeR (v.3.38.0). Differential gene expression analysis was computed using the limma package (v.3.52.0). Differentially expressed genes were loaded into ingenuity pathway analysis (Qiagen, v.01-22-01) and upstream regulator and canonical pathway analysis was conducted on samples with an absolute value log2 fold change > 1 and a corrected P < 0.05. Heatmaps were generated using ComplexHeatmap (v.2.18.0).
RNA sequencing and analysis of WT and Nfe2l2 −/− BMDMs
For effects of stiffness on the NRF2 transcriptional program, WT and Nfe2l2−/− BMDMs were seeded at 1 × 10⁶ cells per well in soft (2 kPa) or plastic 6-well dishes in cDMEM and 10% L929 supernatants and incubated overnight. For the effect of NRF2 activators on LPS-stimulated transcription, WT and Nfe2l2−/− BMDMs were seeded at 1 × 10⁶ cells per well in 12-well TC dishes in cDMEM and 10% L929 supernatants and incubated overnight. The next morning, medium was replaced with fresh cDMEM containing 1 µM KI696, 5 µM sulforaphane, 100 µM tert-butylhydroquinone, 25 µM dimethyl fumarate, 125 µM 4-octyl itaconate or DMSO as a control, and BMDMs were incubated for 30 min. Half of the cells were left unstimulated and the other half had LPS added to a final concentration of 100 ng ml–1 and were cultured for 6 h.
For all samples, supernatants were aspirated and cells were lysed in 350 µl RNA Lysis buffer from a PureLink RNA kit (Thermo Fisher Scientific). RNA was isolated as described in the RT–qPCR section above. Technical triplicates were combined to create one sample per condition per mouse, DNA was degraded using a TURBO DNA-free kit (Thermo Fisher Scientific), and RNA was quantified using a Nanodrop instrument. RNA was kept frozen at −80 °C and paired-end 150 base-pair sequencing was conducted by Azenta at a depth of 20 million reads per sample. Raw sequencing data processing was done with the Galaxy server, whereas differential gene expression analysis was performed in R (v.4.3.2). Raw reads were trimmed using fastp (Galaxy v.0.23.2) and aligned to the mouse genome (mm10) using RNA STAR aligner (Galaxy v.2.7.11a). Reads mapped to genomic features were counted using FeatureCounts (Galaxy v.2.0.3). Differential gene expression analysis was performed using DESeq2 (v.1.42.0) and heatmaps were generated using ComplexHeatmap (v.2.18.0).
RNA sequencing and analysis of BMDMs and osteoclasts
WT BMDMs were cultured for 5 days in 2% CMG, then left untreated or treated with RANKL to generate osteoclasts. On day 5, cells were treated with or without 100 ng ml–1 LPS for 3 h. RNA was extracted using a PureLink RNA Mini kit (Invitrogen) with on-column DNase treatment (Ambion). RNA quality and quantity were assessed using an Agilent Bioanalyzer 2100. Libraries were prepared using a NEBNext Ultra RNA Library Prep kit and sequenced on an Illumina platform to generate paired end reads. Raw reads were cleaned using fastp and aligned to the reference genome, mm10 using STAR. Gene expression was quantified with Feature Counts, and RPKM values were calculated. Differential expression was analysed using DESeq2 with Benjamini–Hochberg correction (adjusted P < 0.05). Heatmaps were generated using ComplexHeatmap. Three biological replicates were used per group.
Reanalysis of publicly available spatial transcriptomics and single-cell RNA sequencing data
Spatial transcriptomic data from human lung tissue were downloaded from the NIH Gene Expression Omnibus (GEO) platform (identifier GSE250346)79, whereas single-cell RNA sequencing data were downloaded from NIH GEO (identifiers GSE122960 and GSE136831)80,81. All analyses were performed using Seurat (v.5.0.1). Data from ref. 80 (GSE122960) required integration, which was performed using the IntegrateLayers pipeline in Seurat. Data from ref. 81 (GSE136831) were available as a sparse matrix and a Seurat object was manually created using these data. Data from ref. 79 (GSE250346) were available as a Seurat object. In brief, cells were re-clustered and individual cluster annotations were confirmed manually. NRF2 transcriptional targets were used to generate an NRF2 module score across all cell types using the AddModuleScore. The NRF2 activity score was then compared between samples from unaffected individuals and samples with more fibrosis on a per-macrophage-subtype basis. Significance was assessed using the Kruskal–Wallis test and Dunn’s multiple comparisons test, and P values were adjusted using Bonferroni correction. Violin plots were generated using scCustomize (v.2.0.1). Pseudobulk analysis was performed by creating an aggregated count matrix followed by differential gene expression analysis using DESeq2 (v.1.42.0). Normalized counts were extracted and GSVA (v.1.50.0) was performed using NRF2 target genes as the target gene set. Significance was assessed using the Mann–Whitney U-test. All data analyses were performed using R (v.4.3.2).
Reporting summary
Further information on research design is available in the Nature Portfolio Reporting Summary linked to this article.