 Newshot
Main
The NPC mediates molecular exchange between the nucleus and cytoplasm. Its central permeability barrier comprises intrinsically disordered proteins (IDPs) known as FG-NUPs, which allow passive diffusion of small molecules while enabling the selective translocation of larger cargos bound to nuclear transport receptors (NTRs)1,2,16,17,18. How this functional barrier forms inside the nanochannel of the NPC remains unresolved.
Direct measurements of local FG-NUP conformational dynamics inside living NPCs remain challenging. Single-molecule tracking, fluorescence correlation spectroscopy and fluorescence recovery after photobleaching can probe overall diffusion in live cells19,20 but do not resolve local conformational motions in tethered disordered chains. Atomic force microscopy (AFM) has shown dynamic properties of NPCs and FG assemblies at accessible surfaces3,21 but is not readily applicable to intact NPCs in live cells. Consequently, models have relied heavily on in vitro experiments and simulations4,22,23, ranging from flexible polymer chains24,25 and polymer brushes15 to liquid-, gel- and amyloid-like condensates4,5,11,12,13. Whether the native barrier is predominantly liquid-like or more solid-like therefore remains debated.
Our previous fluorescence lifetime imaging microscopy–Förster resonance energy transfer (FLIM–FRET) measurements defined conformational preferences of FG-NUPs in permeabilized cells26 but did not directly report dynamics in live NPCs. We therefore combined site-specific genetic-code-expansion labelling with picosecond time-resolved fluorescence anisotropy (TRFA) to monitor apparent segmental motion in live mammalian cells. Focusing on the vital FG-NUP98, we find that FG domains remain liquid-like in living cells, whereas reconstituted FG condensates undergo a time-dependent liquid-to-solid transition in vitro.
We further identify importin-β, an abundant NTR, and O-linked β-N-acetylglucosamine (O-GlcNAc), a key post-translational modification (PTM) of metazoan FG-NUPs, as cellular factors that tune FG-domain liquidity. In vitro, either factor suppresses FG-NUP ageing, whereas together they closely reproduce the apparent segmental motion observed in cells. In live cells, reduced cellular O-GlcNAcylation slows apparent FG-domain segmental motion and nuclear transport, whereas importin-β overexpression partially restores both. These findings indicate that PTM-dependent tuning of FG–FG interactions and importin-β–FG binding jointly maintain a dynamic permeability barrier. These interactions also shape barrier organization. Simulations predict peripheral enrichment of importin-β, whereas FG domains extend towards the centre, forming an effective transport barrier. This radial organization is consistent with recent MINFLUX tracking showing rim-biased trajectories of NTR-bound cargos in permeabilized cells14 and is supported here by two-colour DNA-PAINT MINFLUX imaging of importin-β in fixed mammalian cells.
Together, our measurements and multiscale simulations show how nanoconfinement, scaffold tethering, PTMs and NTR binding tune the material state and spatial organization of the native NPC barrier. The combined in-cell fluorescence and computational framework should also be applicable to other IDPs in nanocavities or biomolecular condensates in living cells, enabling their conformational dynamics to be probed in native settings at the nanoscale.
Site-specific labelling of NUP98 in live cells
High-precision measurements of NUP98 dynamics in live mammalian cells require a labelling strategy that provides single-site precision without substantially altering protein behaviour. Building on our previously established synthetic orthogonally translating organelles-enabled genetic code expansion approach26,27, we selectively reassigned the amber stop codon (TAG) to incorporate the non-canonical amino acid (ncAA) bicyclo[6.1.0]nonyne-lysine (BCN) at specific sites in NUP98 (Fig. 1a). The incorporated BCN allowed site-specific attachment of a small organic fluorophore by means of click chemistry.
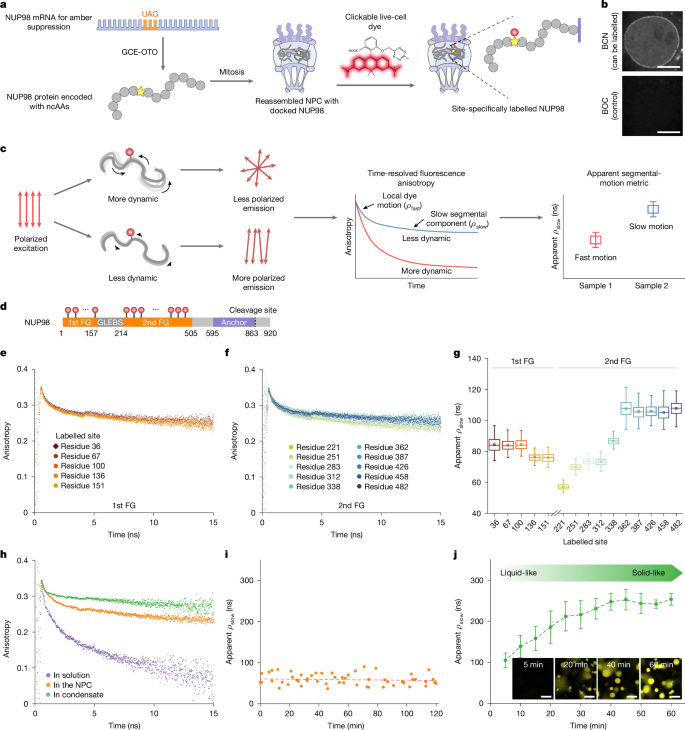
a, Site-specific labelling of NUP98 using synthetic orthogonal translating organelle-enabled genetic code expansion (GCE-OTO) and click chemistry. b, Fluorescence microscopy of COS-7 cells expressing NUP98A221TAG shows labelling with HD653 after incorporation of BCN (a reactive ncAA) but not with non-reactive BOC. c, Schematic of picosecond TRFA. Local dye motion contributes to the fast anisotropy-decay component, whereas slower chain dynamics contribute to the fitted slow component, ρslow, used here as an apparent segmental-motion metric. d, Labelled sites spanning the first and second FG domains. e,f, Representative TRFA decay curves for selected sites in the first (e) and second (f) FG domains. g, Apparent segmental motion across labelled sites, quantified by the fitted slow-component timescale ρslow. From left to right, n = 41, 44, 45, 45, 44, 58, 69, 60, 57, 46, 42, 47, 57, 43 and 53 cells, respectively, across three independent experiments. Because of noisy single-cell fits, 200 bootstrap resamples were used for curve fitting (Methods); box plots display the median (centre line), mean (central square), interquartile range (IQR; box) and whiskers extending to data points within 1.5× IQR. h, Representative anisotropy-decay curves at residue 221 in live-cell NPCs, low-concentration FG chains in solution and freshly formed FG condensates. i, Apparent segmental motion at residue 221 remains stable over a 2-h imaging window in live cells. n = 54 cells across five independent experiments. j, The fitted slow-component timescale ρslow at residue 221 increases during in vitro condensate maturation over 1 h, indicating progressively slower apparent segmental motion and a liquid-to-solid-like transition. Data represent mean ± s.d. from n = 3 independent replicates. Inset, thioflavin-T staining of amyloid-like structures during condensate ageing. Scale bars, 10 μm. Schematics in a,d adapted from ref. 26, Springer Nature Limited.
Our earlier attempts to label NUP98 with various live-cell dyes were hindered by low signal-to-noise ratios, limiting measurement accuracy26. The recently developed silicon rhodamine derivative HDye653 (HD653) features a self-quenching tetrazine moiety that is activated on reaction with BCN28, reducing background fluorescence from unreacted or non-specifically bound dye. Its short linker also makes HD653 suitable for anisotropy measurements.
To validate this approach, we expressed NUP98 bearing BCN at residue 221 (NUP98A221TAG; Methods) in COS-7 cells. On reaction with HD653, a distinct nuclear rim signal was observed (Fig. 1b and Extended Data Fig. 1a,b), confirming efficient incorporation and labelling. By contrast, substituting BCN with a non-clickable ncAA, t-butyloxycarbonyl-l-lysine (BOC) abolished the signal.
The short linker of HD653 minimizes independent rotational motion of the dye29, increasing sensitivity to local segmental motion of the labelled FG-NUP. TRFA measurements of purified enhanced green fluorescent protein (EGFP) site-specifically labelled with HD653 or the established anisotropy dye Cy3B30,31 yielded hydrodynamic radii consistent with wild-type EGFP (Extended Data Fig. 1c and Methods), supporting HD653 as a reliable anisotropy probe for FG-NUP dynamics.
Segmental motion of NUP98 in live cells
TRFA resolves a fast local dye-motion component and a slower anisotropy-decay component in an IDP such as NUP98 (Fig. 1c and Methods)32,33. We denote the fitted timescale of the latter as ρslow and use it as an apparent segmental-motion metric, rather than as a precise conventional rotational correlation time. Because the fluorescence lifetime of HD653 is about 4 ns, the longer-timescale anisotropy component is estimated by model-based fitting rather than directly resolved in the fluorescence decay (Methods). Accumulating photon counts from many cells at each labelling site, together with multi-exponential fitting, enabled reproducible estimation of this component for relative comparison. Accordingly, lower ρslow values indicate faster apparent segmental motion, whereas higher values indicate progressively more restricted motion.
Using this framework, we systematically introduced BCN at 15 sites spanning the first and second FG domains of NUP98 and labelled them in live COS-7 cells with HD653 (Fig. 1d). TRFA decays were collected using a custom-built single-photon-counting confocal microscope (Methods), yielding fitted slow-component timescales, ρslow, ranging from 57 ± 2 to 108 ± 5 ns (Fig. 1e–g, Extended Data Fig. 1d and Supplementary Figs. 1 and 2). Interestingly, a position-dependent trend emerged along the FG domains (Fig. 1g): sites closer to the N terminus, which extend towards the pore centre, exhibited faster apparent segmental motion, whereas those near the anchoring domain were more restricted. This spatial gradient is consistent with previous findings that FG regions tethered near the NPC scaffold experience greater confinement3,34.
Together, these measurements capture the apparent segmental motion of NUP98 FG domains on the tens-of-nanoseconds timescale. Probing slower motions, for example on microsecond timescales, would require complementary techniques such as polarized fluorescence correlation spectroscopy35. In spatial terms, structural correlations in IDPs typically extend over no more than about 50 residues31,33, indicating that this readout primarily reflects local segmental dynamics in this range.
Segmental motion of FG domains in vitro
To compare the dynamics of NUP98 FG domains in vitro with those observed in live cells, we performed TRFA measurements on purified NUP98 FG domains labelled with Cy3B at the corresponding site in two states: isolated FG chains in solution and phase-separated FG condensates (Figs. 1h and 2a,b, Extended Data Fig. 1e and Methods). For the same labelling site tested in cells (residue 221), isolated FG chains exhibited considerably faster anisotropy decay (Fig. 1h), reflecting their higher flexibility. By contrast, freshly formed FG condensates (in the first 5 min) initially exhibited apparent segmental motion similar to that observed in live cells but gradually transitioned to a more solid-like state over an hour (Fig. 1j and Supplementary Video 1; compare the stable live-cell measurements in Fig. 1i). This was accompanied by a progressive slowdown in apparent segmental motion, consistent with previous observations that FG condensates undergo molecular ageing, eventually forming a solid-like hydrogel4. Supporting this, thioflavin-T staining of the condensates showed no signal initially but intensified over time (Fig. 1j), indicating the emergence of amyloid-like structures during maturation.
Analysis of further labelling sites in NUP98 confirmed that all tested residues exhibited slower apparent segmental motion as the condensates matured into a hydrogel state (Fig. 2c). Notably, residue 100 showed the most pronounced reduction in apparent segmental motion. This residue lies in a region recently identified by nuclear magnetic resonance spectroscopy as a particularly aggregation-prone FG-rich segment (amino acids 85–124)11. Thus, rather than being an outlier, this result aligns with the high propensity of this region to form amyloid-like assemblies. By contrast, no such transition was observed in live cells, even over extended measurement windows (for example, 2 h in Fig. 1i). These findings underscore a critical difference between the stable liquid-like dynamics of NUP98 observed in the cell and its time-dependent aggregation seen in vitro, raising the important question of what physiological factors prevent FG-NUPs from maturing into a gel-like state in their native environment.
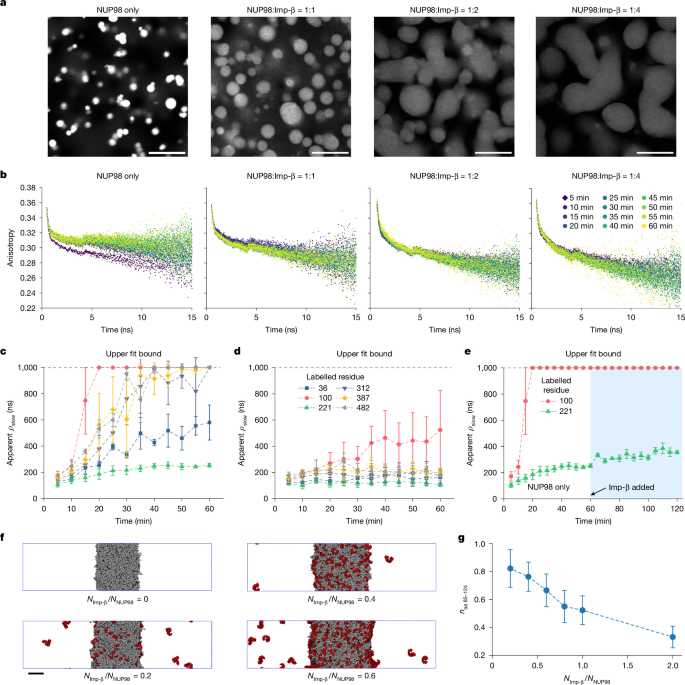
a, Phase separation of purified NUP98 FG domains with increasing concentrations of importin-β (Imp-β). All images use identical intensity scaling. b, Representative TRFA anisotropy-decay curves over 1 h showing faster decay with increasing importin-β concentrations. c, Apparent segmental motion, quantified by the fitted slow-component timescales ρslow, at several labelled sites in FG condensates. Values reaching the upper fit bound indicate very slow apparent segmental motion rather than a quantitatively resolved absolute timescale. d, The same sites as in c, measured in FG condensates cophase-separated with importin-β, show lower ρslow, corresponding to faster apparent segmental motion. e, Apparent segmental motion for FG condensates to which importin-β was added 1 h after formation, showing that mature condensates cannot be fully reliquefied. Data in c–e represent mean ± s.d. from n = 3 independent replicates. f, Molecular-dynamics simulation showing importin-β (red) partitioning into NUP98 FG condensates (grey) and inducing condensate swelling. Final configurations are shown for different molar ratios, NImp-β/NNUP98, as indicated. The FG–importin-β interaction strength was tuned to match the experimental binding affinity, \(\widetilde{{\epsilon }}\)FG–Imp-β = 0.42, and FG–FG interactions were set to reproduce in vitro behaviour26, \(\widetilde{{\epsilon }}\)FG–FG = 0.5. g, Importin-β dilutes the aggregation-prone segment of NUP98 (residues 85–124)11. Shown is the density of these segments, naa 85–124, relative to that in a pure FG condensate within a probe sphere of 15 nm radius placed at the condensate centre. The symbols and error bars denote mean ± s.d. from n = 300 simulation snapshots sampled every 500 τ over the final 15 × 104 τ of each simulation. Scale bars, 10 μm (a) and 20 nm (f).
Importin-β tunes segmental motion of NUP98
Importin-β is abundant at the NPC (Extended Data Fig. 2a), interacts with FG motifs and has been proposed to exhibit chaperone-like properties36,37,38. In vitro, phase separation of purified NUP98 FG domains with importin-β yielded larger, more liquid-like condensates with reduced local FG concentration (Fig. 2a). TRFA measurements showed a dose-dependent increase in apparent segmental motion; as the importin-β-to-FG domain molar ratio increased from 1:1 to 4:1, the fitted slow-component timescale ρslow at residue 221 decreased from 120 ± 24 to 80 ± 7 ns, moving towards the live-cell value (59 ± 14 ns; Fig. 2d and Extended Data Fig. 2b–e). This effect on apparent segmental motion was observed across all tested sites, including residue 100, which lies within the particularly aggregation-prone region spanning residues 85–124 (ref. 11) (Fig. 2d and Extended Data Fig. 2f–j), indicating a generalized role for importin-β in mitigating intermolecular FG–FG interactions. However, once condensates had matured for 1 h, subsequent addition of importin-β failed to restore liquid-like dynamics (Fig. 2e).
To gain mechanistic insights into how importin-β modulates FG-NUP dynamics, we extended our residue-level NPC model26 to include importin-β and the nuclear envelope based on the human NPC structure39. Amino acids are modelled as single beads, the nuclear envelope is represented by fixed membrane particles, and the solvent is treated implicitly (Supplementary Text). Similar residue-based NPC models have been developed for yeast and Xenopus oocyte NPCs22,23,40. We parameterized the FG-NUP–importin-β interaction strength against experimentally measured importin-β partitioning into NUP98 FG condensates at varying molar ratios (Extended Data Fig. 3), obtaining \(\widetilde{{\epsilon }}\)FG–Imp-β = 0.42. This value also reproduced importin-β partitioning into cellular NPCs inferred from proteomics (Extended Data Fig. 4 and Supplementary Text)41 and was equal to the effective FG–FG interaction strength used for FG-NUPs in the NPC (\(\widetilde{{\epsilon }}\)FG–FG = 0.42), but it was weaker than the interaction (\(\widetilde{{\epsilon }}\)FG–FG = 0.5) required for isolated chains and bulk condensates26.
Using these experimentally matched interaction strengths (Extended Data Fig. 3c–e), we simulated the bulk FG–importin-β condensates. Increasing importin-β concentration caused the condensates to swell (Fig. 2f and Supplementary Video 2), consistent with the reduced FG concentration observed experimentally (Fig. 2a). In the simulations, importin-β preferentially engaged FG domains and reduced local contacts between aggregation-prone NUP98 segments spanning residues 85–124 (ref. 11) (Fig. 2g). The dilution and statistical separation of amyloid-prone regions provide a mechanistic explanation for the importin-β-dependent delay in the liquid-to-solid transition observed in vitro (Fig. 2c,d).
Importin-β shapes NPC permeability barrier
To further examine how importin-β contributes to NPC function, we analysed its transport kinetics in the simulated pore. Using the diffusion coefficient estimated from importin-β dynamics in FG condensates (Extended Data Figs. 4 and 5 and Supplementary Fig. 3), we calculated mean first-passage times for importin-β translocation through the NPC. The resulting timescales, on the order of 1–10 ms, align well with experimentally measured nuclear transport rates24,42,43,44,45,46. Interestingly, we observed that the interactions between FG-NUPs and importin-β seem to be optimized to enhance the net rate of cargo transport (Extended Data Fig. 6), maintaining a balance between sufficient binding (to maintain selectivity) and rapid mobility (to allow efficient transport).
We then asked how importin-β is spatially organized in this transport-competent FG-NUP network. Simulations of importin-β-loaded NPCs using experimentally matched interaction strengths (\(\widetilde{{\epsilon }}\)FG–FG = \(\widetilde{{\epsilon }}\)FG–Imp-β = 0.42) showed a striking radial organization (Fig. 3a). Importin-β preferentially accumulated near the pore periphery, whereas its density was reduced along the central axis of the channel (Fig. 3b left, Supplementary Fig. 4 and Supplementary Video 3). Importantly, this relative importin-β depletion did not correspond to an empty pore centre. Instead, the central channel remained populated by highly dynamic and expanded FG domains (Fig. 3b right), with their root-mean-square inter-residue distances, RE, closely matching previous in-cell FLIM–FRET measurements26 (Supplementary Fig. 6). Moreover, while all principal classes of FG-NUPs interpenetrate the FG–importin-β network (Supplementary Fig. 7), their grafting positions generatean inhomogeneous, peripherally enriched FG-rich barrier in which importin-β accumulates preferentially closer to the NPC wall (Fig. 3b).
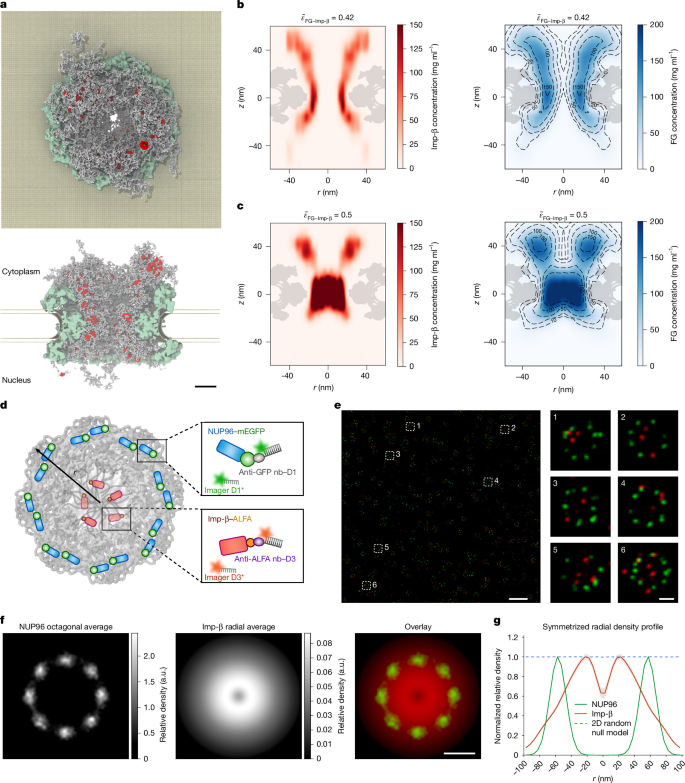
a, Final configuration of molecular-dynamics simulation of an NPC with 100 importin-β molecules (\(\widetilde{{\epsilon }}\)FG–FG = \(\widetilde{{\epsilon }}\)FG–Imp-β = 0.42). Top, cytoplasmic side view; bottom, cross-sectional side view, showing importin-β molecules (red) close (\(|z|\) < 66 nm) to NPC (scaffold, green; FG-NUPs, grey; nuclear envelope, gold). b,c, Concentration map of importin-β (left) and FG-NUPs (right) in cylindrical coordinates (r, radial distance from the symmetry axis; z, axial height from nuclear envelope centre with cytosol at z > 0) for interaction strength \(\widetilde{{\epsilon }}\)FG–Imp-β = 0.42, matched to the experimental affinity (b) and for artificially increased attractions, \(\widetilde{{\epsilon }}\)FG–Imp-β = 0.5 (c), with \(\widetilde{{\epsilon }}\)FG–FG = 0.42 fixed. The maps were averaged over the last 5 × 10⁴τ sampled at intervals of 102τ. Further simulations are shown in Supplementary Fig. 4. d, Schematic of the labelling and imaging strategy. Endogenous NUP96-mEGFP and Tet-on-inducible importin-β–ALFA were labelled with anti-GFP and anti-ALFA nanobodies conjugated to DNA docking strands D1 and D3, respectively, and sequentially imaged by DNA-PAINT using two-dimensional MINFLUX in fixed U-2 OS cells. e, MINFLUX imaging of NUP96 and importin-β. Left, several NPCs (green, NUP96; red, importin-β). Right, magnified views of individual NPCs. f, Averaged localization density maps from n = 460 NPCs, showing NUP96 (octagonal average), importin-β (radial average) and the merged overlay. g, Symmetrized radial density profiles of NUP96 and importin-β, normalized to their respective maxima. Solid lines indicate the mean, and shaded regions represent s.e.m. The blue dashed line shows the matched two-dimensional (2D) random null model, indicating that central importin-β depletion cannot be explained by radial geometry alone. Scale bars, 20 nm (a), 500 nm (e, left), 50 nm (e, right) and 50 nm (f). a.u., arbitrary units.
To test the predicted radial organization in cells, we performed two-colour DNA-PAINT MINFLUX imaging of endogenous NUP96 and doxycycline-induced importin-β in U-2 OS-CRISPR-NUP96-mEGFP cells (Fig. 3d). NUP96 localizations aligned individual NPCs into a common eightfold reference frame, after which importin-β was analysed relative to the NUP96-defined pore centre (Fig. 3e). Importin-β localizations peaked at an intermediate radius of about 20 nm and decreased towards the central axis (Fig. 3f,g), agreeing with the simulated peripheral enrichment and recent three-dimensional MINFLUX tracking of annular NTR-bound cargo trajectories in permeabilized cells14. We noted that small regions of high importin-β density on the distal cytoplasmic side reported by three-dimensional astigmatism microscopy14 were not captured in our molecular-dynamics simulations. Further experimental characterization of the long NUP358 chains, with their ordered domains interspersed throughout extensive disordered regions, may thus be required to build a refined model.
The emergence of this radial organization depended on a fine balance of FG–importin-β interactions: when made 20% stronger in the simulations, the importin-β molecules condense into the pore centre (Fig. 3c left; \(\widetilde{{\epsilon }}\)FG–Imp-β = 0.5, Supplementary Video 4); made 20% weaker, the importin-β molecules delocalize across the entire pore (Supplementary Fig. 5; \(\widetilde{{\epsilon }}\)FG–Imp-β = 0.35, Supplementary Video 5). These findings indicate that small changes in FG–importin-β affinity can shift importin-β localization and affect transport efficiency (Extended Data Fig. 6c). Future experiments that selectively alter FG–importin-β interactions could directly test these predictions.
We next examined the dynamic consequences of this organized barrier. Tracking individual importin-β molecules along simulated transport trajectories showed pronounced dynamic heterogeneity within the pore (Supplementary Fig. 8). Importin-β motion was fastest towards the centre, consistent with previous MINFLUX tracking14. This faster mobility probably reflects more rapid exchange between FG-binding sites in the more dilute and extended FG-NUP network near the pore centre.
Finally, we asked whether the simulation framework captures the relative segmental-dynamics trends measured by TRFA. The simulations showed that the bond-vector correlations decayed fastest in isolated chains and slower in bulk condensates and the NPC, reflecting the increased confinement imposed by neighbouring chains (Extended Data Fig. 7 and Supplementary Figs. 9 and 10). These relative trends parallel the experimental apparent segmental-motion trends (Fig. 1h). We did not include molecular ageing in simulations of FG condensates, so we did not reproduce their long-time slowing; nevertheless, the relative hierarchy indicates that the model captures the principal effects of confinement, FG–FG interactions and FG–importin-β binding.
O-GlcNAcylation tunes NUP98 dynamics
The partial ability of importin-β to delay, but not completely prevent, the solidification of FG condensates in vitro (Fig. 2d) indicated that further mechanisms must contribute to maintaining FG-domain dynamics in the NPC. Among potential candidates, O-GlcNAcylation is particularly compelling because FG-NUPs are among the most heavily O-GlcNAc-modified proteins in metazoan cells, and NUP98 is itself heavily O-GlcNAcylated47,48. O-GlcNAcylation is a reversible PTM in which a single GlcNAc moiety is attached to serine or threonine residues by O-GlcNAc transferase (OGT) and removed by O-GlcNAcase. O-GlcNAcylation has been implicated in modulating FG-hydrogel material properties48 and nuclear transport rates49, yet its effect on nanosecond-scale FG-domain dynamics has remained unknown. To address this gap, we perturbed O-GlcNAc levels in live cells and in vitro.
Pharmacological inhibition of OGT with OSMI-4 reduced global O-GlcNAc levels, as confirmed by RL2 immunoblotting, and slowed apparent segmental motion at several positions in the second FG domain of NUP98 (Fig. 4a,b). The spatial pattern broadly followed predicted O-GlcNAcylation propensities (Extended Data Fig. 8a). By contrast, O-GlcNAcase inhibition with Thiamet-G produced little further increase in apparent segmental motion (Fig. 4a), indicating that endogenous O-GlcNAcylation is already sufficient to support nanosecond-scale flexibility of FG domains under physiological conditions.
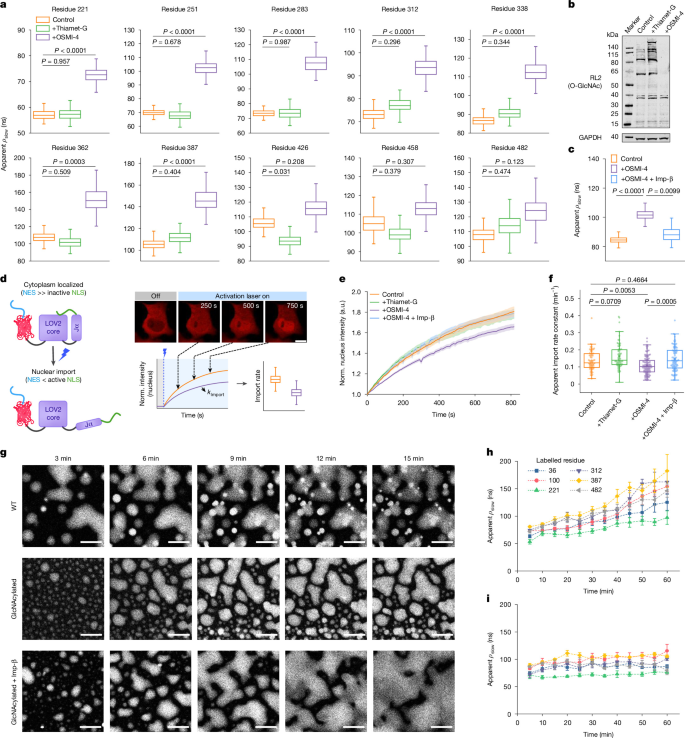
a, Apparent segmental motion, quantified by the fitted slow-component timescales, at selected FG-domain sites in live COS-7 cells treated with 10 μM Thiamet-G or OSMI-4. For Thiamet-G, n = 44, 45, 46, 46, 46, 42, 48, 46, 46 and 46 cells, and for OSMI-4, n = 44, 45, 46, 47, 45, 40, 46, 47, 47 and 42 cells, respectively, from left to right and top to bottom across three independent experiments; control n values are as in Fig. 1g. b, Immunoblot of global O-GlcNAc levels (RL2) following Thiamet-G or OSMI-4 treatment. c, Importin-β overexpression partially restored apparent segmental motion at residue 100 in OSMI-4–treated cells. n = 80, 109 and 74 cells for control, OSMI-4 and OSMI-4 + importin-β, respectively, across three independent experiments. For a,c, 200 bootstrap replicates were generated by randomly resampling and summing anisotropy-decay curves before fitting. d, Schematic of the light-inducible LINuS nuclear-import reporter assay. NLS, nuclear import signal; NES, nuclear export signal; LOV2, light-oxygen-voltage domain 2; Jα, Jα helix. e, Normalized nuclear fluorescence intensity following LINuS activation. Curves show the mean ± s.e.m. from n = 67 (control), 69 (Thiamet-G), 105 (OSMI-4) and 88 (OSMI-4 + importin-β) cells. f, Apparent nuclear-import rate constants (k) derived from the exponential fitting of the curves in e (Methods). Individual points represent individual cells. g, Time-lapse images showing phase separation of purified wild-type (WT) and O-GlcNAcylated NUP98 FG domains, with or without importin-β. h,i, TRFA measurements of apparent segmental motion in O-GlcNAcylated NUP98 FG condensates without (h) or with (i) importin-β over 1 h. Data represent mean ± s.d. from n = 3 independent replicates. For a,c,f, box plots show the median (centre line), IQR (box) and whiskers extending to data points within 1.5× IQR. Statistical significance was assessed using two-sided bootstrap hypothesis testing for a,c and two-sided Welch’s t-tests with Holm correction for multiple comparisons for f. Scale bar, 10 μm (d,g). Norm., normalized.
To assess whether these changes influence NPC function, we quantified nuclear import using a LINuS (light-inducible nuclear localization signal) reporter48 (Fig. 4d). Consistent with the reduced apparent segmental motion measured by TRFA, OSMI-4 treatment significantly slowed nuclear import, whereas Thiamet-G treatment produced transport rates comparable to untreated cells (Fig. 4e,f). These findings link O-GlcNAc-dependent changes in FG-domain dynamics to transport through the NPC.
We next asked whether the effects of O-GlcNAcylation could be reproduced in a minimal in vitro system. Purified NUP98 FG domains were enzymatically glycosylated and examined following phase separation (Fig. 4g and Extended Data Fig. 8b–e). Relative to unglycosylated condensates (Fig. 2c), glycosylated FG domains displayed markedly delayed maturation and retained liquid-like apparent segmental motion for extended periods (Fig. 4h and Supplementary Video 1). This effect was especially pronounced at residue 100, located in a region known for amyloidogenic propensity11. Although mass spectrometry confirmed only partial glycosylation (roughly 17 GlcNAc moieties per chain; Extended Data Fig. 8c), this modification was sufficient to suppress molecular ageing and delay hydrogel formation, indicating that local O-GlcNAcylation enhances chain flexibility and disrupts potentially pathological intermolecular FG–FG interactions.
Because neither O-GlcNAcylation nor importin-β alone fully reproduced the behaviour observed in cells, we next tested whether the two factors could act jointly in vitro. Glycosylated FG condensates formed in the presence of importin-β remained highly dynamic and resisted the progressive slowdown observed in unglycosylated condensates (Fig. 4g). Remarkably, the pattern of apparent segmental motion closely matched that measured in living cells across several positions; at residue 221, the fitted slow-component timescale was 72 ± 3 ns in vitro versus 59 ± 14 ns in cells (Figs. 1i and 4i, Extended Data Fig. 8f and Supplementary Video 1). This provides an in vitro system that recapitulates the relative apparent segmental-motion profile observed in living cells.
Finally, to test whether importin-β can compensate for reduced O-GlcNAcylation in cells, we overexpressed importin-β in OSMI-4-treated COS-7 cells. Importin-β overexpression partially restored apparent segmental motion at residue 100 (Fig. 4c) and concomitantly improved nuclear import (Fig. 4e,f), linking recovery of FG-domain dynamics to transport function and supporting a modulatory role for importin-β in maintaining FG-NUP dynamics, particularly when FG–FG interactions are strengthened.
O-GlcNAcylation tunes FG-NUP condensation
To mechanistically interpret these findings, we built a near-atomistic Martini 2.2 model50 of the constricted human NPC, derived from the experimentally resolved scaffold structure (Protein Data Bank (PDB) ID: 7R5K (ref. 39); Supplementary Table 3 of ref. 26). Whereas the residue-level coarse-grained model allows efficient parameter screening and fundamental physical insight extraction, the Martini model adds chemical detail for explicit FG-NUP O-GlcNAcylation. We simulated four modification states (fgly = 0%, 18%, 30% and 60% occupancy of candidate Ser/Thr sites; Fig. 5 and Supplementary Fig. 11). Protein–protein, protein–sugar and sugar–sugar interactions were parameterized against experimental data as described in Methods (Supplementary Figs. 12–14).
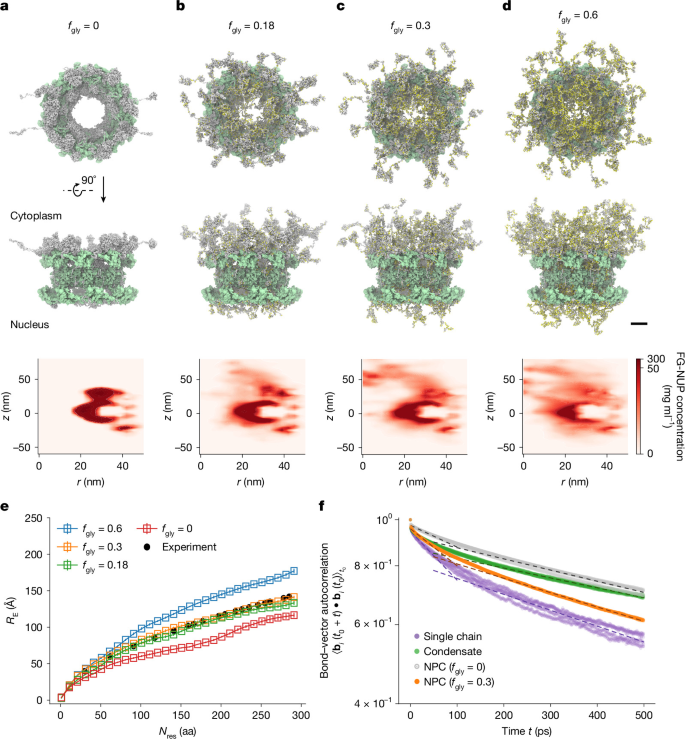
a–d, Snapshots from Martini molecular-dynamics simulations of the NPC at increasing levels of O-GlcNAcylation of FG-NUPs (NUP54, NUP58, NUP62, NUP98, NUP214, NUP358 and POM121). The fraction of O-GlcNAcylated serine/threonine residues was 0% (a), 18% (b), 30% (c) and 60% (d). Top and middle, cytoplasmic side view and cross-sectional side view of the final configuration (FG-NUPs, grey; glycosylated Ser/Thr residues, yellow; NPC scaffold, green). Bottom, azimuthally averaged FG-NUP concentration maps (excluding glycan beads and the long NUP358 chains that may form interactions beyond the modelled system) averaged over the final 600 ns. Colour scale, linear from 0 to 50 mg ml−1, with concentrations >50 mg ml−1 shown in uniform dark red; bin size Δr = Δz = 3 nm. Total simulation times are 3.5 μs (a) and 2 μs (b–d). e, Root-mean-square inter-residue distance (RE) of NUP98 FG domains in the NPC for the different O-GlcNAcylation levels. Nres denotes the sequence separation (in amino-acid residues) between residue pairs. Open squares and error bars denote the mean and standard error, respectively, calculated from n = 400 simulation snapshots (sampled every 1.5 ns) over four independent blocks of 150 ns. Experimental FLIM–FRET results are shown as black circles for comparison26. f, Autocorrelation function of bond vectors \({\langle \overrightarrow{{b}_{i}}({t}_{0}+t)\cdot \overrightarrow{{b}_{i}}({t}_{0})\rangle }_{{t}_{0}}\) for the NUP98 bond between residues 221 and 222, bi, computed from Martini simulations of NPCs without O-GlcNAcylation (silver), with 30% O-GlcNAcylation (orange), isolated FG chains (purple) and FG condensates (green). Curves were obtained from four independent 100-ns simulations sampled at 1-ps intervals. Dashed lines show exponential fits of the form a exp\((-t/{\tau }_{\mathrm{fast}})\) and \({a}^{{\prime} }\exp (-t/{\tau }_{{\rm{slow}}})\) over time windows [0, 50 ps] and [50 ps, 500 ps], respectively (fit parameters in Supplementary Table 6). All snapshots were rendered with VMD. Scale bars, 20 nm (a–d).
In the absence of O-GlcNAcylation (fgly = 0), FG-NUPs collapsed into a dense surface condensate surrounding the NPC scaffold (Fig. 5a and Supplementary Video 6), leaving a large central void and producing NUP98 chain extensions inconsistent with previous in situ FLIM–FRET measurements26 (Fig. 5e). Increasing O-GlcNAcylation progressively expanded FG domains into the central channel (Fig. 5b–d and Supplementary Videos 7–9). An O-GlcNAcylation level of fgly = 0.3 reproduced the experimentally measured RE of NUP98 FG domains particularly well (Fig. 5e) and yielded 48 predicted O-GlcNAcylation sites, closely matching the 46 sites identified experimentally in Xenopus NUP9848. Higher O-GlcNAcylation levels yielded progressively more extended chains.
O-GlcNAcylation also accelerated bond-vector relaxation, mirroring the experimental trend in which NUP98 FG domains exhibit faster segmental dynamics inside the NPC than in unglycosylated in vitro condensates, yet slower dynamics than isolated chains (Figs. 1h and 5f and Supplementary Fig. 15). The effect of explicit O-GlcNAcylation on FG-NUPs can be reproduced by implicitly weakening FG-NUP attractive interactions through an interaction-rescaling parameter, α (Extended Data Fig. 9 and Supplementary Fig. 15). Remarkably, by then matching the RE of NUP98 to the FLIM–FRET measurements, we find the FG-NUPs to be near the critical point for phase separation in the Martini model, where relatively small changes in effective interactions can strongly alter FG-NUP organization, confirming our earlier observations from the residue-level coarse-grained FG-NUP models26.
Because O-GlcNAcylation weakens effective FG–FG interactions, we next asked whether differences in modification state could also influence mixing between FG assemblies. Simulations and selective-partitioning experiments showed that differences in O-GlcNAcylation promote demixing between otherwise similar FG assemblies (Supplementary Figs. 16–18 and Methods). Thus, differences in FG-NUP PTMs, including O-GlcNAcylation in metazoans and potentially O-mannosylation or phosphorylation in yeast, may tune FG–FG interaction strengths in ways that oppose mixing21.
Together, the combination of Martini and residue-level coarse-grained simulations recapitulates key mesoscopic and microscopic features—from chain extension and apparent segmental motion to importin-β partitioning and transport behaviour—and bridges simplified in vitro studies with the crowded environment of the intact NPC. These results highlight how O-GlcNAcylation and importin-β make complementary contributions to maintaining liquid-like FG-domain conformational dynamics and generating the spatial and dynamic heterogeneity characteristic of the permeability barrier.
Discussion
By combining site-specific labelling with picosecond TRFA, we directly monitored conformational dynamics of FG-NUPs in living cells. NUP98 retained rapid apparent segmental motion even in regions that aggregate readily in vitro, sharply contrasting with aged FG condensates that transition into solid-like hydrogels. Their progressive loss of apparent segmental motion is consistent with amyloid-like interactions observed by nuclear magnetic resonance spectroscopy and electron microscopy12,36.
The discrepancy raises a key question: why do FG domains rapidly age into hydrogels in vitro4,5,13, yet remain dynamic in one of the cell’s longest-lived protein assemblies19,51? Nucleocytoplasmic transport depends on ultrafast, reversible FG–FG and FG–NTR interactions, with thousands of transient sequential contacts supporting millisecond cargo passage24,25. The apparent segmental motion detected by TRFA therefore provides a dynamic context for the rapid exchange of transient FG–NTR contacts during transport. We identify importin-β and O-GlcNAcylation as two factors that tune this behaviour. Each partially suppresses molecular ageing in vitro, whereas together they reproduce the apparent segmental-motion trends measured in living cells (Extended Data Fig. 8f).
Molecular-dynamics simulations further showed how importin-β contributes to this stabilization. Importin-β dilutes aggregation-prone FG segments, swells condensates and enhances apparent segmental motion. Although chaperone-like properties of importin-β have been proposed previously36,37,38, our work demonstrates how it modulates FG-domain dynamics at the segmental level, particularly when FG–FG interactions are strengthened, consistent with the karyopherin-centric model of the NPC barrier10,52.
PTMs provide another regulatory layer. Phosphorylation has been proposed to modulate FG-domain dynamics53, and NUP98 hyperphosphorylation promotes NPC disassembly54. However, selectively perturbing NUP98 phosphorylation in live cells remains challenging. By contrast, the extensive O-GlcNAcylation of NUP9847,48 allowed direct perturbation here. Altering O-GlcNAc levels changed both apparent segmental motion of FG domains and nuclear transport (Fig. 4e,f), linking O-GlcNAc–dependent tuning of FG-NUP dynamics to NPC function.
Serendipitously, our simulations also show the radial organization of the NPC barrier. Under experimentally matched interaction strengths (\(\widetilde{{\epsilon }}\)FG–Imp-β = 0.42), importin-β was enriched near the pore periphery, whereas extended FG domains occupied the centre; increasing FG–importin-β affinity instead drove importin-β to cluster in the pore centre (\(\widetilde{{\epsilon }}\)FG–Imp-β = 0.5; Fig. 3b,c and Supplementary Videos 3 and 4). The peripheral distribution agrees with recent three-dimensional MINFLUX tracking of NTR-bound cargos14 and with our two-dimensional MINFLUX measurements. Our simulations further indicate that this organization emerges naturally from FG-NUP grafting geometry39 and locally elevated FG density near the pore wall. Consequently, importin-β exposure may vary along NUP98, potentially leading to position-dependent rescue of apparent segmental motion (Fig. 4c).
These findings provide a complementary perspective on central plug-like densities reported by electron microscopy55,56 and high-speed AFM studies21. Differences in NPC conformation may partly underlie these observations, as in situ cryo-electron tomography shows a wider central channel in native cellular NPCs than in isolated preparations39. Because our MINFLUX measurements use NUP96 as a scaffold reference without directly resolving the inner-ring diameter, we cannot exclude effects of NPC dilation or constriction on the apparent importin-β distribution. Moreover, the central plug shown by AFM is highly mobile21, consistent with a dynamic transport-associated assembly rather than a rigid structure. Our data do not exclude importin-β from central plug-like densities, but indicate that the central axis is not its predominant location. One possible framework is a dual-route organization in which small and medium-sized cargos that interact efficiently with NTRs preferentially use the periphery, whereas larger or more slowly transported cargos occupy the central channel. In this view, some central densities could represent transient cargo or transport complexes rather than a permanent plug.
More broadly, our study illustrates how cellular context can preserve functional dynamics of IDPs in crowded environments, with implications for diseases linked to FG-NUP dysfunction, including cancer, viral infection and neurodegenerative disease57,58. Combining in-cell fluorescence measurements with multiscale computational modelling provides a general strategy for probing IDP conformational dynamics in their native cellular environment.
Methods
Cell culture, transfection and labelling
Cell culture
COS-7 cells (Sigma, 87021302) and HEK293T cells (Beyotime, C6008) were cultured in Dulbecco’s Modified Eagle Medium (Thermo Fisher, 41965-039) supplemented with 10% (v/v) fetal bovine serum (FBS; Sigma, F7524), 1% penicillin–streptomycin (Thermo Fisher, 15140-122), 1% l-glutamine (Thermo Fisher, 25030-081) and 1% sodium pyruvate (Thermo Fisher, 11360-070). U-2 OS-CRISPR-NUP96-mEGFP cells originally obtained from Cytion (300174) and provided by Y. Li were maintained in McCoy’s 5A (Procell, PM150710) supplemented with 10% (v/v) FBS and 1% penicillin–streptomycin. Cells were cultured at 37 °C in a humidified incubator containing 5% CO2 and were passaged every 2–3 days. All experiments were performed using cells in 20 passages.
To generate a doxycycline-inducible U-2 OS-CRISPR-NUP96-mEGFP cell line expressing importin-β, lentiviral particles were produced in HEK293T cells by cotransfection of pTRIPZ-importin-β-3×FLAG-ALFA-P2A-tagBFP (derived from the pTRIPZ; Addgene, 206981), psPAX2 (Addgene, 12260) and pMD2.G (Addgene, 12259) at a plasmid ratio of 4:3:1. Viral supernatants were collected 48 and 72 h after transfection and concentrated by polyethylene-glycol-8000 precipitation. U-2 OS-CRISPR-NUP96-mEGFP cells were transduced for 48 h and selected with puromycin (1 μg ml−1; Yeasen, 727136ES03) for 4 days. For MINFLUX imaging, expression of importin-β was induced with doxycycline (0.5 μg ml−1; MCE, HY-N0565) for 24 h before fixation.
Cell morphology was routinely monitored during culture. The engineered U-2 OS-CRISPR-NUP96-mEGFP/importin-β cell line was also verified by NUP96-mEGFP fluorescence and doxycycline-inducible importin-β expression. No in-house short tandem repeat profiling was performed. All cell lines were regularly tested for mycoplasma contamination by PCR and with the MycoBlue Mycoplasma Detector Kit (Vazyme, D101-01), with negative results.
Transfection
COS-7 cells were seeded on 35-mm glass-bottom imaging dishes (ibidi, 81158) 24 h before transfection to reach 60–70% confluency. Cells were transfected with plasmids listed in Supplementary Table 1 using jetPRIME (Polyplus) according to the manufacturer’s instructions. At 4–5 h post-transfection, the medium was replaced with fresh culture medium supplemented with 10 mM HEPES and either 50 μM BCN for site-specific labelling or 50 μM BOC for control experiments. Where indicated, 10 μM Thiamet-G (MCE, HY-12588) or 10 μM OSMI-4 (MCE, HY-114361) was added at this stage and maintained throughout the experiment.
Live-cell labelling
At 20–24 h following transfection, cells were washed with medium containing 50 μM BOC and 10 mM HEPES and incubated for 2 h at 37 °C to allow excess BCN to clear. Cells were then labelled with 2 μM HD653 in serum-free medium for 30 min at 37 °C. For O-GlcNAc perturbation experiments, 10 μM Thiamet-G or 10 μM OSMI-4 was included during labelling to maintain treatment conditions. Where indicated, SiR-tetrazine (Spirochrome, SC008) or JF646-tetrazine (Tocris, 7279) was used following the same protocol. After labelling, cells were washed with 1× PBS and imaged immediately in FluoroBrite Dulbecco’s Modified Eagle Medium (Thermo Fisher, A1896701) supplemented with 10% (v/v) FBS, 1% l-glutamine, 1% sodium pyruvate and 10 mM HEPES. Imaging was performed at room temperature with the dish sealed to ensure stable conditions during the roughly 2-h acquisition period.
Immunostaining of endogenous importin-β
COS-7 cells labelled with HD653 were fixed with 2% paraformaldehyde (PFA) in PBS for 10 min, permeabilized with 0.5% Triton X-100 in PBS for 15 min and blocked with 3% bovine serum albumin in PBS for 90 min. Cells were incubated with an anti-KPNB1 antibody (Abcam, ab2811; 1:1000 dilution) followed by an Alexa Fluor 488-conjugated anti-mouse secondary antibody (Thermo Fisher, A-11001; 1:1000 dilution). Immunofluorescence imaging confirmed localization of endogenous importin-β at the nuclear envelope following live-cell labelling (Extended Data Fig. 1b).
Estimation of importin-β concentration at the nuclear pore
To estimate the local concentration of importin-β at the nuclear pore, solutions containing free Alexa Fluor 488 at known concentrations (1 μm–1 mM) were added to immunostained cells. Nuclear pore fluorescence remained distinguishable from the background in the presence of up to 100 μM free dye but became indistinguishable at 1 mM (Extended Data Fig. 2a), indicating that the effective local concentration of importin-β at the nuclear pore is in the millimolar range.
Assessment of expression levels of exogenous importin-β by immunoblotting
The doxycycline-inducible U-2 OS-CRISPR-NUP96-mEGFP cell line described above was treated with doxycycline (0.5 μg ml−1) for 0, 6, 10, 15 or 24 h. Non-transduced U-2 OS-CRISPR-NUP96-mEGFP cells without doxycycline treatment were used as a parental control. Cell lysates were collected at the indicated time points and analysed by immunoblotting using an anti-FLAG antibody (Proteintech, 66008-4-Ig; 1:1,000 dilution) to detect exogenous importin-β and an anti-KPNB1 antibody (1:2,500 dilution) to detect both endogenous and exogenous importin-β. α-Tubulin detected with an anti-α-Tubulin antibody (ABclonal, AC012; 1:5,000 dilution) was used as a loading control. Doxycycline induction resulted in detectable FLAG-tagged importin-β expression, whereas the total KPNB1 signal showed no substantial increase compared with the parental control, consistent with near-endogenous expression of the exogenous protein (Supplementary Figs. 19 and 20).
Assessment of cellular O-GlcNAc levels by immunoblotting
To verify modulation of cellular O-GlcNAcylation, COS-7 cells were treated with 10 μM Thiamet-G or 10 μM OSMI-4 as described above and lysed directly in Laemmli sample buffer. Proteins were separated by sodium dodecyl sulfate polyacrylamide gel electrophoresis (SDS–PAGE), transferred to nitrocellulose membranes and probed with the anti-O-GlcNAc antibody RL2 (Invitrogen, MA1-072; 1:1,000 dilution). Bound antibody was detected using an IRDye 800CW goat anti-mouse IgG secondary antibody (LI-COR Biosciences, 926-32210; 1:10,000 dilution) and visualized using an Odyssey imaging system (Fig. 4b).
Measurement of nuclear-import rates in live cells
Live-cell nuclear-import assays were performed as described previously49 with minor modifications. COS-7 cells expressing NES–mCherry–LINuS were treated with 10 μM Thiamet-G or 10 μM OSMI-4 and imaged 24 h after transfection following Hoechst 33342 staining (10 μg ml−1, 10 min). Imaging was performed on a Zeiss LSM 980 confocal microscope. Nuclear import was induced by 488-nm illumination and monitored by mCherry fluorescence using 561-nm excitation. Images were acquired every 10 s for 820 s. Nuclear regions were segmented using Hoechst fluorescence, and nuclear mCherry intensity was quantified over time and normalized to the pre-activation signal. Apparent nuclear-import rate constants were obtained by fitting fluorescence accumulation curves to y = 1 + (b − 1)(1 − e−kt), where b is the plateau fluorescence intensity and k is the apparent nuclear-import rate constant.
Protein expression, purification and labelling
Expression and purification of NUP98 FG domain
The human NUP98 FG domain (residues 1–505) was cloned into a pQE-14his-TEV vector. As described previously26,59, the GLEBS domain (residues 157–213) was excluded to avoid misfolding of this structured region on rapid dilution from denaturant during phase separation (see ‘In vitro phase separation assay’ below); intrinsically disordered FG regions, by contrast, readily regain their dynamic ensemble under native buffer conditions. The construct was transformed into Escherichia coli BL21-AI cells and grown in terrific broth supplemented with kanamycin (50 µg ml−1) at 37 °C with shaking at 200 rpm. Protein expression was induced when optical density at 600 nm (OD600) ≈ 0.6 with 0.02% (w/v) arabinose and 1 mM iIsopropyl β-D-1-thiogalactopyranoside, followed by incubation for 16 h at 18 °C.
Cells were collected and lysed using a high-pressure cell disruptor (CF1, Constant Systems) in lysis buffer containing 6 M guanidine hydrochloride (GdmCl), 0.2 mM tris(2-carboxyethyl)phosphine (TCEP), 20 mM imidazole and 50 mM Tris-HCl (pH 8.0). Following clarification by centrifugation (12,000g, 1 h, 4 °C), lysates were incubated with nickel-nitrilotriacetic acid (Ni-NTA) resin for 2 h at 4 °C. Bound protein was washed with 2 M GdmCl buffer and eluted with 500 mM imidazole in 2 M GdmCl and 50 mM Tris-HCl (pH 8.0). After dialysis into 0.5 M GdmCl and 50 mM Tris-HCl (pH 8.0), the N-terminal His-tag was removed by overnight TEV protease digestion. The cleaved protein was separated from uncleaved protein and TEV protease by a second Ni-NTA purification step and further purified by size-exclusion chromatography (Superdex 200 Increase 10/300 GL, Cytiva, 28990944) in 2 M GdmCl, 0.2 mM TCEP and 50 mM Tris-HCl (pH 8.0). Purity was confirmed by SDS–PAGE and Coomassie staining. Protein fractions were concentrated to about 15 mg ml−1, quantified using a bicinchoninic acid assay and stored at −80 °C.
In vitro O-GlcNAcylation of NUP98 FG domain
The purified NUP98 FG domain was enzymatically glycosylated using recombinant OGT1 and UDP-GlcNAc (Sigma, U4375). The reaction mixture contained 10 µM NUP98 FG domain, 1 µM OGT1 and 1 mM UDP-GlcNAc in glycosylation buffer (50 mM Tris-HCl, pH 7.5, 200 mM NaCl, 20 mM MgCl2, 0.2 mM TCEP and 1% Tween-20). Samples were incubated for 16 h at room temperature with gentle rotation. Following O-GlcNAcylation, His-tagged OGT1 was removed using Ni-NTA resin. O-GlcNAcylated NUP98 FG domain was further purified by size-exclusion chromatography (Superdex 200) in 2 M GdmCl, 0.2 mM TCEP and 50 mM Tris-HCl (pH 8.0) and concentrated to about 40 mg ml−1. O-GlcNAcylation efficiency was assessed by mass spectrometry, confirming successful modification of the NUP98 FG domain (Extended Data Fig. 8c).
For experiments requiring higher levels of O-GlcNAc modification, the purified glycosylated protein was subjected to a second round of enzymatic O-GlcNAcylation under identical reaction conditions. Unless otherwise stated, all experiments were performed using NUP98 FG domains that had undergone a single round of O-GlcNAcylation. Proteins subjected to two rounds of O-GlcNAcylation were used only for the experiments shown in Supplementary Fig. 18.
Labelling of NUP98 FG domain
NUP98 FG-domain variants containing a single cysteine substitution (residue 36, 100, 221, 312, 387 or 482) were exchanged into 4 M GdmCl, 1× PBS, 0.1 mM EDTA and 0.2 mM TCEP (pH 7.0). Proteins were labelled overnight at 4 °C with Cy3B maleimide (GE Healthcare, PA63131) or Alexa Fluor 594 maleimide (Thermo Fisher Scientific, A10256) at a protein/dye molar ratio of 1:2. Excess dye was quenched with 10 mM dithiothreitol and removed by ultrafiltration (3 kDa molecular-weight cutoff), followed by size-exclusion chromatography (Superdex 200). Protein concentrations and labelling efficiencies were determined spectroscopically using a Duetta fluorometer (Horiba). Labelled proteins were flash-frozen in liquid nitrogen and stored at −80 °C.
Expression and purification of importin-β
The human importin-β coding sequence was cloned into a pTXB3-intein-CBD-12His vector and transformed into E. coli BL21-AI cells. Cultures were grown in terrific broth supplemented with kanamycin (50 μg ml−1) at 37 °C with shaking (200 rpm). Protein expression was induced at OD600 = 0.4–0.6 with 0.02% (w/v) arabinose and 1 mM iIsopropyl β-d-1-thiogalactopyranoside, followed by incubation for 5–6 h at 37 °C. Cells were lysed by high-pressure homogenization in 50 mM Tris, 650 mM NaCl, 5 mM MgCl2, 5 mM imidazole, 1 mM phenylmethylsulfonyl fluoride and 0.2 mM TCEP (pH 7.0). After clarification by centrifugation (12,000g, 1 h, 4 °C), lysates were incubated with Ni-NTA resin for 2 h at 4 °C. Bound protein was washed with lysis buffer containing 10 mM imidazole and 1.5 M NaCl and eluted with 400 mM imidazole. The eluate was dialysed into imidazole-free buffer and subjected to a second Ni-NTA purification step. Importin-β was further purified by size-exclusion chromatography (Superdex 200) in 50 mM Tris, 650 mM NaCl, 5 mM MgCl2 and 0.2 mM TCEP (pH 7.0). Purity was confirmed by SDS–PAGE. Purified protein was concentrated to about 500 μM, flash-frozen in liquid nitrogen and stored at −80 °C.
In vitro phase separation assays
Purified NUP98 FG domains stored in 2 M GdmCl were induced to phase separate by rapid dilution into transport buffer (20 mM HEPES, 110 mM KOAc, 5 mM NaOAc, 2 mM Mg(OAc)2, 1 mM EGTA and 2 mM dithiothreitol, pH 7.3). Unless otherwise indicated, 1 μl protein solution was mixed with 24 μl transport buffer on a chambered coverslip (ibidi, 81507) immediately before imaging. Wild-type NUP98 FG domains were used at a final concentration of 10 μM mixed with 2 nM labelled FG domain. The residual GdmCl concentration after dilution was about 80 mM and did not interfere with condensate formation.
Because O-GlcNAcylated FG domains exhibited reduced phase-separation propensity, a final concentration of 25 μM was used for the experiments in Fig. 4g–i to generate condensates of comparable size and morphology to those formed by wild-type FG domains.
For cophase separation assays, importin-β was diluted into transport buffer to the desired concentration before mixing with FG domains. Wild-type FG domains were used at 10 μM unless otherwise indicated. Glycosylated FG–importin-β condensates were prepared from 25 μM glycosylated FG domains and 10 μM importin-β to obtain condensates comparable to those formed by wild-type FG domains. The final concentration of GdmCl was maintained at 80 mM across all conditions.
Quantification of FG-condensate phase concentrations
Dense- and dilute-phase concentrations of NUP98 FG condensates were determined using trace amounts of Alexa Fluor 594-labelled NUP98 FG domain. Condensates were formed from mixtures of unlabelled wild-type NUP98 FG domain and labelled tracer protein at molar ratios of 2,000:1, 5,000:1 or 10,000:1, as described above. Immediately after formation, condensates were sedimented by centrifugation at 4,300g for 5 min.
Dense-phase fluorescence was measured on a custom-built confocal microscope equipped with a 560-nm pulsed laser. Dense-phase regions were identified from their high fluorescence intensity and characteristic condensate morphology. Fluorescence intensities were converted to protein concentrations using calibration curves generated from known concentrations of free Alexa Fluor 594 measured under matched buffer conditions. Differences in fluorescence quantum yield between free dye and dye-conjugated protein were measured independently using a Duetta fluorometer and used to correct the calculated protein concentrations.
Dilute-phase concentrations were measured by focusing well above the condensate layer and applying the same calibration and quantum-yield correction. An unlabelled/labelled protein ratio of 20:1 was used to increase dilute-phase signal while minimizing perturbation of phase behaviour. Small dynamic nanoclusters were occasionally observed in the dilute phase of wild-type NUP98 FG condensates in the absence of importin-β (Extended Data Fig. 3d).
The experimentally determined dense- and dilute-phase concentrations were used to constrain FG–importin-β interaction strengths in the coarse-grained molecular-dynamics simulations (Extended Data Fig. 3e).
O-GlcNAcylation-dependent selective partitioning of FG domains
To examine the effect of O-GlcNAcylation on FG-domain partitioning, NUP98 FG domains containing a cysteine substitution at residue 221 were site-specifically labelled with fluorescent maleimide dyes. Unglycosylated NUP98 FG domains were labelled with Alexa Fluor 488 maleimide, whereas unglycosylated, modestly O-GlcNAcylated (single-round glycosylation) and highly O-GlcNAcylated (two-round glycosylation) NUP98 FG domains used as probe molecules were labelled with LD655 maleimide.
Preformed condensates were generated from unglycosylated NUP98 FG domains (final concentration roughly 10 μM supplemented with 4 nM Alexa Fluor 488-labelled protein) as described above. Samples were incubated for 30 min at room temperature to allow condensate maturation before probe addition. LD655-labelled probe proteins (unglycosylated, modestly glycosylated or highly glycosylated NUP98 FG domains) were then added to the chamber at a 1:1 volume ratio, yielding a final probe concentration of 20 nM. The incorporation of probe molecules into preformed condensates was monitored by time-lapse confocal microscopy using a Zeiss LSM 980 microscope (Supplementary Fig. 18).
TRFA measurements
Instrument configuration
TRFA measurements were conducted on a custom-built confocal microscope equipped with picosecond pulsed laser diodes (560 nm: LDH-D-TA-560, PicoQuant; 660 nm: LDH-D-C-660, PicoQuant) controlled by a Sepia II PDL 828 multichannel laser driver26. The excitation beam was delivered through a single-mode polarization-maintaining optical fibre (KineFLEX-P-2-S-405/640-2.5-2.5-p2), passed through a Glan-laser polariser (Thorlabs), directed through a FLIMbee laser scanning system (PicoQuant) and focused onto the sample through a ×60 water immersion objective lens (SR Plan Apo IR, 1.27 NA, Nikon). Fluorescence emission was collected through the same objective, spatially filtered using a pinhole (100 μm for live-cell measurements and 50 μm for in vitro measurements) and separated into parallel and perpendicular polarization components using a polarizing beam splitter. Each component was further separated spectrally by dichroic filters (ZT561 RDC and T647 LPXR, Chroma), passed through bandpass filters (Cy3B: 612/69 BrightLine HC, Semrock; HD653: ET700/75m, Chroma) and detected with hybrid photon-counting detectors (PMA Hybrid 40, PicoQuant). Photon arrival times were recorded with a HydraHarp 400 time-correlated single-photon-counting module at 16-ps resolution. Data were acquired using SymPhoTime 64 software (v.2.6, PicoQuant).
Instrument response functions (IRFs) were measured daily using Erythrosine B in saturated potassium iodide solution and used for reconvolution analysis. Detection channels were aligned using the measured IRFs. We note that a small discontinuity around 4 ns is observed in the raw anisotropy-decay curves; this arises from weak optical reflections in the time-correlated single-photon-counting setup and is accounted for in the analysis by reconvolution with the measured IRFs.
Live-cell measurements
HD653 fluorescence intensity at the nuclear rim was first verified under 660-nm laser excitation (optimized to 50 μW average power at 40 MHz) to assess the expression level, ensuring comparable expression levels and avoiding overexpression artefacts. Data acquisition was performed using T3 mode, with fluorescence photons collected separately by parallel and perpendicular detectors. Imaging parameters included a pixel size of 100 nm, an image size of 256 pixels × 256 pixels, a pixel dwell time of 150 µs and an imaging time of 5 min. Regions of interest corresponding to the nuclear rim were selected, where thresholding algorithms were applied to identify regions of interest on the basis of pixel intensity and average fluorescence lifetime. The time-resolved intensity curves for parallel and perpendicular channels were extracted for further analysis.
In vitro measurements
Condensates were imaged immediately after formation as described above. Fluorescence photons were collected in T3 mode using 560-nm excitation (40 MHz repetition rate). To minimize photobleaching and ensure representative sampling, the imaging field was changed every 5 min to examine different condensates throughout the measurement period. Imaging parameters included a pixel size of 150 nm, an image size of 256 pixels × 256 pixels, a pixel dwell time of 203 μs and a time resolution of 16 ps. Condensates were identified on the basis of fluorescence intensity and morphology, and time-resolved intensity curves were extracted from condensate regions using SymPhoTime 64 software.
For measurements of individual FG chains in solution, purified and labelled FG domains were diluted in transport buffer to a final concentration of 10 nM. Data acquisition and analysis were performed as described above for condensate measurements.
TRFA decay analysis
Fitting procedures
TRFA decay, r(t), was calculated from fluorescence emissions collected parallel (\({I}_{\parallel }(t)\)) and perpendicular (\({I}_{\perp }(t)\)) to the excitation polarization according to60
where L1 and L2 are polarization mixing factors caused by the high numerical aperture of the objective lens and G accounts for the differential detection efficiencies between the parallel and perpendicular polarization components:
To determine L1 and L2, the fluorescence decays of a reference sample, yellow fluorescent protein (YFP), were measured. YFP has a known fluorescence rotational relaxation time (ρ = 16 ns) (ref. 61). The fluorescence decays for the parallel and perpendicular components of YFP were globally fitted using the following equations61:
where I0 is the initial fluorescence intensity, τ is the fluorescence lifetime and ρ is the rotational correlation time of YFP. The G factor was determined by measuring the ratio of the average intensities in the perpendicular and parallel channels using a solution of tris(2,2’-bipyridyl)dichlororuthenium(II) chloride ([Ru(bpy)3]Cl2), which exhibits isotropic rotational motion.
For IDPs, r(t) can be modelled using a double-exponential decay32:
where r0 is the fundamental anisotropy of the fluorophore, ρfast is the fitted rotational correlation time associated primarily with local dye/linker motion, rp is the residual anisotropy remaining after fast local motion and reflecting slower, larger-scale chain motions and ρslow is the fitted slow-component timescale used here as an apparent segmental-motion parameter. Values approaching the upper fitting bound of 1,000 ns were interpreted as indicating very slow apparent segmental motion and were not considered well resolved.
When ρfast is much smaller than ρslow, equation (5) can be approximated and simplified to
where βfast = 1 − rp/r0 and βslow = rp/r0 represent relative amplitudes of the fast (local) and slow (segmental) components, respectively.
The fluorescence lifetime (τ) was first determined by fitting the total fluorescence decay obtained from the parallel and perpendicular emission channels. The resulting τ value was then fixed during the subsequent global fitting of the parallel and perpendicular fluorescence decays using the 2_exp_rot model implemented in TauFit in the PAM package62, where IRFs were included through reconvolution analysis. Here we interpret ρslow primarily as an apparent segmental-motion parameter for relative comparisons rather than as a precise absolute rotational correlation time. Rotational components slower than the fluorescence lifetime can nevertheless influence the measured anisotropy decay and be estimated by model-based fitting, with precision depending strongly on photon statistics and decreasing as the correlation time increasingly exceeds the fluorescence lifetime63,64. Although three-exponential models were also evaluated, the additional component was consistently negligible or degenerate with existing components and therefore did not improve the fits.
To calculate steady-state anisotropy (rss), the integrated intensities of the fluorescence emissions collected in the parallel (\({I}_{\parallel }\)) and perpendicular \(({I}_{\perp }\)) channels were used. The steady-state anisotropy was computed using the equation
The steady-state anisotropy value provides a single, time-averaged measurement of the overall fluorescence anisotropy, which complements the dynamic information obtained from TRFA decay analysis.
Statistical analysis
For live-cell measurements, single-cell anisotropy-decay traces were used for subsequent analysis. In Fig. 1i, the fitted slow-component parameter (ρslow) was calculated on a per-cell basis to capture relative temporal trends in apparent segmental motion. For all other experiments, a non-parametric bootstrap strategy was applied to improve signal-to-noise and ensure robust curve fitting.
For each condition, 200 bootstrap replicates were generated by resampling single-cell decay traces with replacement, summing photon counts and fitting the resulting decays in TauFit62. Bootstrap depth was selected on the basis of convergence analysis (Supplementary Fig. 2). Differences between conditions were assessed using two-sided bootstrap tests. P values were calculated as the proportion of null resamples with absolute differences greater than or equal to the observed effect. Percentile confidence intervals were derived from the empirical distribution of independent bootstrap differences.
For in vitro measurements, anisotropy decays were analysed every 5 min and fitted individually. Reported values represent the mean ± s.d. from three independent experiments.
Validation of HD653 for anisotropy measurements
To assess the suitability of HD653 as a probe for TRFA, control experiments were performed using a globular protein with known rotational properties. Purified EGFP containing a single BCN at residue 39 was site-specifically labelled with either HD653 or the rigid, well-characterized anisotropy dye Cy3B30,31. TRFA measurements were conducted on both unlabelled and labelled EGFP at 10 nM in 1× PBS. The rotational correlation times were obtained by fitting TRFA decay curves using the 2_exp_rot model function in TauFit62. For globular EGFP, the fitted slow component, ρslow, corresponds to its overall rotational correlation time and was used to determine the hydrodynamic radius:
where kB is the Boltzmann constant, T is the absolute temperature and \(\eta \) is the solvent viscosity. Hydrodynamic radii determined for labelled EGFP were consistent with wild-type EGFP and previously reported values65,66, confirming HD653 as a reliable anisotropy probe and supporting its use for segmental dynamics measurements in live-cell and in vitro assays.
MINFLUX measurements
Sample preparation for MINFLUX imaging
Doxycycline-induced U-2 OS-CRISPR-NUP96-mEGFP cells expressing importin-β-3×FLAG-ALFA were prepared as described above. Cells were fixed with 4% PFA for 10 min, washed three times with 1× PBS containing 100 mM glycine and permeabilized and blocked for at least 30 min at room temperature in blocking buffer consisting of 3% bovine serum albumin, 10% donkey serum and 0.3% Triton X-100 in 1× PBS.
DNA docking strand-conjugated anti-GFP and anti-ALFA nanobodies (Massive Photonics) were diluted 1:200 in antibody incubation buffer (Massive Photonics) and incubated with cells for 1 h at room temperature. Samples were washed three times with washing buffer (Massive Photonics) and post-fixed with 2.4% PFA for 8 min. Gold nanoparticles (250 nm diameter; BBI Solutions) were then added for 10 min as fiducial markers for active drift correction, followed by extensive washing with 1× PBS.
Cy3B-labelled DNA-PAINT imager strands (Massive Photonics) were diluted in imaging buffer (Massive Photonics) to a final concentration of 200–500 pM. Samples were mounted in custom imaging chambers, and imager solution was added immediately before imaging. All MINFLUX measurements were completed within 2 days of sample preparation.
Two-colour DNA-PAINT MINFLUX imaging
Two-colour DNA-PAINT MINFLUX measurements were performed on a commercial MINFLUX microscope (Abberior Instruments) based on an Olympus IX83 inverted microscope equipped with a ×100 UPlanXApo objective and controlled by Imspector software. The excitation beam pattern and pinhole position were calibrated daily using fluorescent calibration nanoparticles (Gold 150 nm and 2C Fluor 120 nm; Abberior Instruments).
Cells expressing the inducible importin-β construct were identified by tagBFP fluorescence. Imaging was performed at the basal surface of the nucleus adjacent to the coverslip. Transient DNA-PAINT binding events were verified by rapid confocal imaging before MINFLUX acquisition. At least three gold fiducials were present in each field of view and were used by the active stabilization system to correct real-time drift, maintaining subnanometre lateral stability throughout acquisition.
Regions of interest were imaged using the standard two-dimensional MINFLUX acquisition sequence with a pinhole diameter of 0.83 Airy units. Following acquisition of the first target, imager strands were exchanged using a custom perfusion system while maintaining uninterrupted MINFLUX acquisition and active stabilization. Buffer exchange was performed at about 10 μl s−1 until DNA-PAINT binding events were no longer detected, indicating complete removal of the first imager strand. The second imager strand was subsequently introduced and imaging resumed. Sequential two-colour imaging and strand exchange typically required roughly 4 h.
NPC alignment and radial density analysis
NPCs were analysed using custom MATLAB routines adapted from the published MINFLUX_NPC_Tracking workflow14. Candidate NPCs were selected from the NUP96 channel and filtered using geometry-based quality-control criteria to exclude incomplete or poorly resolved pores.
For each NPC, the pore centre was determined from NUP96 localizations and used for spatial registration. The eightfold rotational phase was estimated from the angular distribution of NUP96 localizations using the complex order parameter \({z}_{8}=\langle {e}^{i8\theta }\rangle \). Individual NPCs were rotated into a common eightfold reference frame, and the same rigid-body transformation was applied to the corresponding importin-β localizations. Aligned NUP96 coordinates were rendered directly to preserve the native octagonal architecture of the NPC scaffold.
Because importin-β localizations did not exhibit a robust eightfold angular organization, their spatial distribution was quantified using radial density analysis relative to the NUP96-defined pore centre. Localizations were binned by radial distance, corrected for annular area, normalized in each NPC and averaged across pores. Individual radial profiles were smoothed before calculation of the population mean and s.e.m. The resulting mean radial density profile was rotationally symmetrized to generate the final importin-β density map. To assess the contribution of radial geometry, a uniform random two-dimensional distribution was generated in the analysed pore radius and processed using the same radial binning, annular-area correction, normalization, smoothing and symmetrisation as the experimental localizations (Fig. 3g).
Molecular-dynamics simulations
Residue-based coarse-grained model of NPC and importin-β
We adapted a previously established coarse-grained model of the NPC26 to incorporate importin-β proteins. In this model, each amino acid (p) of NPC and importin-β proteins is represented by a single bead, the nuclear envelope is modelled using fixed membrane particles (m), and the solvent is treated implicitly. Protein residues are divided into three sub-categories: scaffold residues (sc) and FG residues (FG) of NPC proteins and importin-β residues. The potential energy of the system is given by
Non-bonded interactions between particles i and j are described by Lennard–Jones potentials, whose strength \({\widetilde{{\epsilon }}}_{{ij}}\), length σij and cutoff values \({r}_{{\rm{c}}}^{{\rm{\alpha }}}\) are provided in Supplementary Table 2. The Lennard–Jones potentials were shifted by their values at the corresponding cutoff radii: that is, \({U}_{{\rm{LJ}}}({r}_{c}^{\alpha })\). The bond potential between adjacent beads of the FG-protein was modelled using the finitely extensible nonlinear elastic potential67 with kFE = 30kBT and RFE = 1.5σ. The radiall positions of importin-β were confined by a half-harmonic potential with stiffness kc = 100kBT/σ2, limiting their radial distance to r ≲ Rc = 81σ ≡ 48.6 nm.
Simulations were performed in LAMMPS (Release Sept. 2021)68,69. Time is reported in units of \(\tau =\sqrt{m{\sigma }^{2}/{k}_{{\rm{B}}}T}\), where m is the bead mass (identical for all bead types). Following earlier work26, we determined the reduced length scale of Lennard–Jones potential obtained as σ ≡ 0.6 nm by matching the root-mean-square inter-residue distance (RE) of a single NUP98 FG chain (amino acids 1–499) in both the homopolymer model and the corresponding Martini representation in the weakly interacting regime70. We found that \(\widetilde{{\epsilon }}\)FG–FG = 0.5 reproduces the RE of a single NUP98 FG chain measured by single-molecule FRET, whereas \(\widetilde{{\epsilon }}\)FG–FG = 0.42 best matches in situ FLIM–FRET for the NUP98 FG domain in the NPC26, reflecting in particular the effects of PTMs.
The membrane particles representing the nuclear envelope were constructed from a 100 × 100 nm2 coarse-grained POPC bilayer using the Python script insane.py71,72, with a reduced area per lipid (0.3 nm2) to prevent solvent permeation (command: insane.py -l POPC -x 100 -y 100 -z 100 -a 0.3 -o bilayer.gro). A half-toroidal pore was then generated using BUMPy71 (command: bumpy.py -s double_bilayer_cylinder -f bilayer.gro -z 10 -g l_cylinder:10 r_cylinder:430 r_junction:120 l_flat:1920). To reduce computational cost, only phosphate beads were retained. NPC scaffold and membrane particles were fixed throughout the simulations. To prevent FG domains and importin-β molecules from crossing the membrane, a Lennard–Jones potential with a large repulsive range was applied (Supplementary Table 2).
We used the constricted NPC model II26 including the following FG-NUPs: NUP54, NUP58, NUP62, NUP98, POM121, NUP214, NUP153 and NUP358. Importin-β was modelled using PDB ID 3W5K (ligand Snail1 removed)73. Importin-β molecules were treated as rigid bodies using a rigid-body integrator with a Langevin thermostat and a damping coefficient 10τ (LAMMPS command: fix rigid langevin molecule). FG beads were integrated using the Verlet algorithm74. NUP98 FG chains were thermalized using Langevin thermostats with damping coefficient 10τ (ref. 75).
Preparation and equilibration of importin-β inside the NPC
Importin-β molecules were added to systems of size 320σ × 320σ × 400σ. FG-NUPs were first equilibrated at \(\widetilde{{\epsilon }}\)FG–FG = 0.5 for 106τ, during which they formed a surface condensate on the NPC scaffold. These compact conformations allowed us to efficiently introduce NImp-β = 100 importin-β molecules76 with random initial positions and orientations around the NPC. With FG-NUPs frozen and weak interactions (\(\widetilde{{\epsilon }}\)FG–Imp-β = 0.1), importin-β molecules were allowed to diffuse for 3.4 × 10⁴τ with thermostat damping coefficient 1,000τ. Subsequently, the full system was equilibrated with \(\widetilde{{\epsilon }}\)FG–FG = 0.42 and \(\widetilde{{\epsilon }}\)FG–Imp-β = 0.1 for 105τ using a time step δt = 10−3τ and thermostat damping coefficient 10τ. Production conditions were then applied by setting \(\widetilde{{\epsilon }}\)FG–FG and \(\widetilde{{\epsilon }}\)FG–Imp-β to their target values, followed by simulations of at least 106τ. Three independent configurations from the equilibration phase were selected as starting points for independent production runs. Structural visualization was performed using VMD77.
Martini model of the NPC
To examine how O-GlcNAcylation affects FG-NUP dynamics, we performed molecular-dynamics simulations of the human NPC using the Martini 2.2 coarse-graining scheme. We used the constricted NPC structure (PDB ID: 7R5K, ref. 39). NUPs were grouped into scaffold proteins and disordered FG-NUPs and converted to Martini CG models using the martinize.py script50,78. FG-NUPs included NUP54, NUP58, NUP62, NUP98, POM121, NUP214 and NUP358 (Supplementary Table 3). All scaffold proteins and grafting-anchored ordered domains of FG-NUPs were restrained with a harmonic spring (1,000 kJ mol−1 nm−2).
We generated O-GlcNAcylated NPC models at three modification levels (fgly = 0.18, 0.3 and 0.6), where fgly denotes the fraction of O-GlcNAcylated Ser/Thr sites (Supplementary Fig. 11). Potential O-GlcNAcylation sites were predicted using YinOYang79, which assigns each residue a probability p ∈ [0,1]. Residues with p ≥ pth were considered glycosylated. The resulting number of modified sites Ngly determined fgly = Ngly/Ntotal, where Ntotal = 58,768 is the total number of Ser/Thr residues across all FG-NUPs.
Simulations were performed using GROMACS (v.2020.6 and v.2025.2)80,81. Interaction strengths for protein–protein, protein–sugar and sugar–sugar interactions were rescaled by parameters α, λ and γ, respectively70,82. The optimal α = 0.78 was determined by matching RE of an untreated NUP98 FG chain to single-molecule FRET measurements (Supplementary Fig. 12) and the dense-phase density of FG condensates (Supplementary Fig. 14 and Supplementary Tables 4 and 5). For O-glycosylated FG-NUPs, interactions involving sugars used λ = 0.15 and γ = 0.5, consistent with experimental osmotic second virial coefficients of aqueous sugars and protein–sugar mixtures83,84.
Equilibration of the Martini NPC systems
A cubic box (170 nm per side) was constructed to accommodate the NPC. Secondary-structure restraints were assigned using DSSP85. Elastic networks in ordered domains were generated using Elastic Network in Dynamics86 (default parameters; a distance range of 0.9 nm; force constant 500 kJ mol−1 nm−2). All FG domains were modelled as coils except for locally ordered regions in NUP358 (Supplementary Table 3). The system was solvated with Martini water containing 10% antifreeze beads87 and neutralized with NaCl to 150 mM. The total number of solvent particles was about 4 × 10⁷.
Initial energy minimization used steepest descent with maximum step size 0.01 nm and force tolerance 1,000 kJ mol−1 nm−1. During this step, position restraints (1,000 kJ mol−1 nm−2) were temporarily removed to allow global relaxation. Lennard–Jones and Coulomb potentials were first softened using the GROMACS free-energy framework (parameters: couple-lambda0=vdw-q; sc-alpha = 0.1; sc-coul= yes; sc-power = 2; sc-sigma = 0.3), followed by a second minimization using full potentials.
Equilibration proceeded as follows. First, NVT simulations at 310 K were performed for 100 ns (velocity-rescaling thermostat88, time constant 1 ps, time step δt = 0.015 ps) using reduced interaction scaling (α = γ = λ = 0.3) to relax chains into coil-like conformations. Next, NPT equilibration at 310 K and 1 bar was performed for 100 ns (velocity-rescaling thermostat88, semi-isotropic Berendsen barostat89, time constant 12 ps, compressibility 3 × 10⁻⁴ bar−1). Interaction parameters were then gradually increased. For untreated NPCs, α was raised from 0.3 to 0.5 and then 0.6. For O-glycosylated NPCs, α was increased from 0.3 to 0.6 and then 0.7, with γ = 0.5 and λ = 0.15. This stage lasted 1.5 μs. Production simulations were conducted for at least 2 μs at target α values, using the same thermostat and barostat parameters as in the final equilibration step and a time step δt = 0.02 ps.
Statistics and reproducibility
Sample sizes were not determined by formal statistical power calculations but were based on previous experience with the respective imaging and biophysical assays26, practical considerations and the requirements for robust and reproducible measurements. For molecular-dynamics simulations, replicate numbers and trajectory blocks were selected on the basis of convergence and reproducibility criteria. Exact sample sizes, numbers of independent experiments and independent sample preparations are reported in the corresponding figure legends.
For experiments in which representative images are shown, including those in Figs. 1b, 2a, 3e and 4b, Extended Data Figs. 1a,b, 2a and 8e and Supplementary Figs. 18–20, experiments were independently repeated at least three times and yielded similar results. Representative images were selected from these independent experiments. Randomization was not applicable because treatments were applied to entire cell cultures or biochemical samples. Experimental variability was minimized by using matched culture, sample-preparation and acquisition conditions.
Reporting summary
Further information on research design is available in the Nature Portfolio Reporting Summary linked to this article.