 Newshot
Main
The one-child policy (OCP) is widely considered to be one of the most stringent public policies in modern global history11. However, China’s total fertility rate (TFR) declined very little following its implementation in 1979–1980 (Fig. 1). Although some past research suggests that the OCP effectively reduced fertility rates8,12, the policy’s rapid implementation across the country also makes disentangling its impact from secular fertility trends difficult. If the policy were in fact effective, China’s modest gradual decline in fertility throughout the 1980s implies that early enforcement was, at best, weak (Supplementary Note 1).
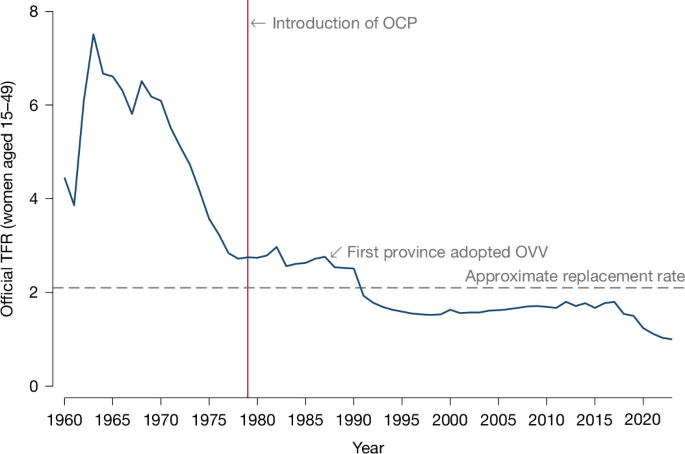
China’s TFR, sourced from the World Population Prospects 2024 by the UN Population Division62. The replacement rate is the fertility rate needed for a population to exactly reproduce itself from one generation to the next (without migration). Generally, this rate is roughly 2.1 children per woman in many higher-income countries, although it varies with a population’s mortality rates63,64.
By contrast, during the early 1990s China’s TFR fell abruptly by more than one-third, dropping below the replacement fertility rate. Here we study how strengthening bureaucratic incentives under the one vote veto (OVV) policy during the 1990s was instrumental to more effective implementation of the OCP, and was also responsible for the OCP’s delayed impact on fertility more than a decade later. Provincial and local governments are responsible for implementing central government policies such as the OCP and OVV (and possess autonomy within their jurisdictions), but the central government strongly influences subordinate provincial and local officials through the cadre evaluation system—the linchpin of bureaucratic control in China13,14,15,16 (Supplementary Note 2). Dating back to the Mao era, the cadre evaluation system is a multidimensional performance evaluation system used to rank local officials according to achievement of established policy goals (Supplementary Note 3). Importantly, performance evaluations through this system largely determine professional advancement among bureaucrats in China, and are therefore central to their career concerns13,14,15,17,18.
The OVV policy greatly strengthened cadre evaluation incentives to adhere to OCP targets; it strictly prohibited promotion within the Chinese bureaucratic system for the duration of a bureaucrat’s career in the event of adherence failure. Specifically, for local bureaucrats failing to achieve priority targets (in our case, population and family planning targets set by higher levels of government; OCP targets were the only priority targets when the OVV was introduced), a performance veto disqualifies any other achievements, resulting in an unsatisfactory overall performance evaluation (Supplementary Note 4). This unsatisfactory performance veto strictly prevents promotion and can even lead to removal from a position, creating powerful incentives among bureaucrats to adhere to priority targets. Demographers have long argued—on the basis of qualitative and administrative evidence—that this tightening of enforcement drove China’s fertility decline during the 1990s11,12,19,20 (Supplementary Note 5), although this hypothesis has not been tested causally nor its magnitude quantified. Supplementary Table 1 shows the timing of OVV adoption across the 30 mainland Chinese provincial-level administrative units that implemented it21. We note that the timing of OVV adoption did not follow a clear geographic pattern, and OVV timing was only weakly related to levels of pre-OVV provincial characteristics (Supplementary Fig. 1). We also test directly for a relationship between fertility trends and the timing of OVV adoption (see evidence presented in the ‘Annual Probability of Birth’ section below). By 1996, coverage of the OVV policy had expanded to almost the entire population of China (Extended Data Fig. 1).
Drawing on complete contraceptive and fertility histories from a large retrospective survey, we show that the OVV sharply reduced women’s annual probability of birth, with declines concentrated among higher-order births. Notably, the OVV did so in part by sharply increasing the use of intrauterine devices (IUDs)—the most prevalent form of modern contraception in China—with substantially larger relative increases in IUD use recommended by local officials than in voluntary use. Using these estimates to construct sequential multi-decrement fertility life tables (following the general approach of Van Hook and Altman22 and Babiarz et al.9), we find that the policy accounts for about half of the decline in China’s TFR during the 1990s, the first time that fertility in China fell below the replacement rate.
Our findings have implications for two broad areas of research. First, they inform long-standing debate about whether or not China’s decline in fertility below the replacement rate reflects enforcement of population policies11,12,19,20 or rapid economic development23. Although our results confirm elements of both views (background forces unrelated to the population policies account for about half of the decline during our study period), we provide new quantitative evidence that enforcement of population policy accounts for the other half—more than previously suggested7,8,9,10—and we document government officials’ direct influence over contraceptive use. Second, our findings contribute to scholarship on bureaucratic incentives, providing new evidence on how their intensity—and not just the existence of policy targets (even in a system with China’s administrative reach)—has directly shaped demographic outcomes under an unpopular coercive mandate. Overall, our research suggests that population policy contributed more to fertility decline in China than it has in other countries around the world1,2,3,4,5,6,7,8,9,10, but only after substantial strengthening of bureaucratic incentives.
OVV implementation and fertility records
We use two primary sources of data in our analyses. First, we compiled provincial-level OVV implementation dates using government documents contained in official archival publications (Supplementary Table 1). These documents are published in provincial gazetteers, chronicles of major events and yearbooks, as well as the Family Planning Yearbook of China.
Second, we use the 2001 National Family Planning and Reproductive Health Survey24. The National Family Planning Commission (NFPC) conducts this survey approximately twice per decade to assess demographic and reproductive behaviour in China, and to formulate population policy (Supplementary Note 6). This nationally representative survey of women aged 15–49 in 2001 used a stratified sampling method, selecting 1,041 communities and including roughly 45,000 women (Supplementary Note 7). For each woman interviewed, the survey collected complete contraceptive use, pregnancy and birth history information, including the end date and outcome of each sampled woman’s pregnancies.
With this pregnancy and birth history data, we construct a retrospective sample of more than 63,000 pregnancies, and more than 44,000 live births between 1980 and 2001 (Supplementary Note 8). In addition to information about past pregnancies and births, the survey also contains detailed information on women’s contraceptive use, as well as on the two most common forms of modern contraception in China: IUDs and female sterilization25. It also includes an explicit measure of whether or not contraceptive use was the choice of a woman and her family, or was instead recommended by others (including government officials; Supplementary Note 9). Supplementary Table 2 and Supplementary Fig. 2 report descriptive statistics from our sample, and Supplementary Fig. 3 shows the distribution of women’s ages when the OVV policy was implemented in their province of residence, suggesting that our sample has reasonable coverage across age groups relevant for our analysis.
Annual probability of birth
We begin by estimating how the OVV policy affected women’s annual probability of giving birth. We regress an indicator for whether or not a woman gave birth in a given calendar year on event-year indicators for years relative to the adoption of the OVV in her province, controlling for her education and ethnicity, and including provincial and calendar-year fixed effects (equation (1); refer to the Methods for the full estimation details). Figure 2 and Supplementary Table 3 show event study estimates of \(\widehat{{\beta }^{k}}\) from equation (1) (Methods; event year –1 is omitted). Our primary estimates use the two-way fixed effects correction method proposed by Cengiz and co-workers26, but we also show that our results are similar when using alternative correction methods. Before the OVV, we find little evidence of differential fertility trends correlated with the timing of the policy. All \(\widehat{{\beta }^{k}}\) estimates for k < 0 are close to zero and statistically insignificant (and jointly insignificant as well, F(7,161) = 1.19, P = 0.313). These results are consistent with our assumption that the timing of provincial-level OVV adoption is orthogonal to pre-existing fertility trends.
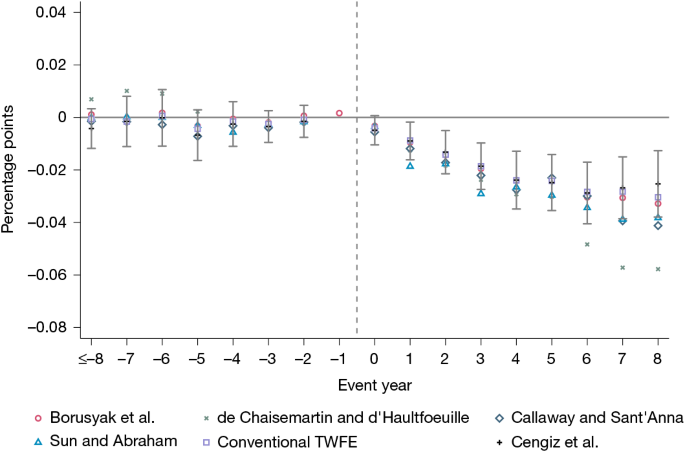
Difference-in-differences estimates from equation (1) for annual probability of birth (pre-policy mean = 0.106) using six different estimators: a dynamic version of the two-way fixed effects (TWFE) model, estimated using ordinary least squares; Cengiz et al.26; Sun and Abraham65; Callaway and Sant’Anna66; de Chaisemartin and d’Haultfoeuille67; and Borusyak et al.68. For the ordinary least squares, Sun and Abraham65 and Cengiz et al.26 estimators, the coefficient at event time t ≤ −8 represents the accumulated effect for all periods t ≤ −8. For the other estimators, it represents the specific effect at exactly t = −8. The 95% confidence intervals are shown only for the Cengiz et al.26 estimator, our main specification, and are two-sided and pointwise (not adjusted for multiple comparisons). Inference for the Callaway and Sant’Anna66 estimator is based on the wild cluster bootstrap. Standard errors for the Cengiz et al.26 estimator are clustered at the treatment cohort × province level. Standard errors for the remaining estimators are clustered at the province level. The outcome variable is the occurrence of a live birth. The sample includes women aged 15–49 in 2001, and their births between years 1980 and 2001 (n = 1,906,333 stacked woman-year observations; 36,375 unique women). The vertical dashed line represents when the OVV was implemented. Data are from the 2001 National Family Planning and Reproductive Health Survey.
By contrast, after the adoption of OVV, women’s annual probability of birth declined immediately and rapidly. Pooling across all parities, Fig. 2 shows that these reductions are statistically significant for all event years following implementation of the OVV, except for the initial year in which the policy was adopted (two-sided P-values range from <0.001 to 0.016 across event years 1 through 8; Supplementary Table 3). By the final event year, the reduction in annual probability of birth was 2.5 percentage points (95% confidence interval = −0.038 to −0.013, two-sided P < 0.001, n = 1,906,333 woman-years), a decline of about 24% relative to the pre-policy mean (Supplementary Note 10).
Extended Data Fig. 2 also reports estimates from equation (1) separately by birth parity (refer to Supplementary Table 4 for details). One might expect these reductions to be present for second- and higher-parity births (births to which the OCP applies), but not first births (Supplementary Note 11). Consistent with these expectations, estimates for first births are generally small and statistically insignificant. By contrast, there are then large and significant declines in second and third births (1.4 and 0.9 percentage points, respectively) by the final event year (second births: 95% confidence interval = − 0.019 to −0.008, two-sided P < 0.001, n = 1,906,333; third births: 95% confidence interval = −0.012 to −0.006, two-sided P < 0.001, n = 1,906,333), representing reductions of 41.3% and 76.5%, respectively, relative to their unconditional means before the OVV (Supplementary Note 12). Finally, although fourth and higher-parity births account for a very small fraction of the sample, they also decline significantly following OVV implementation. Although the absolute reduction is small—reaching a statistically significant –0.24 percentage points by event year 8 (95% confidence interval = −0.004 to −0.001, two-sided P = 0.004, n = 1,906,333)—this represents a 53.3% decline relative to the pre-OVV unconditional mean (Supplementary Note 13).
Stronger bureaucratic incentives for enforcement of the OCP under the OVV might also be expected to produce convergence in fertility rates across provinces, with larger declines in provinces with higher pre-OVV fertility rates. Extended Data Fig. 3 reports estimates from equation (1) separately for provinces with above- and below-median fertility before the OVV, showing markedly larger declines in the annual probability of birth in provinces with initially higher fertility (a difference that is statistically significant: F(8, 116) = 4.39, P < 0.001; Supplementary Note 14).
We also estimate saturated models, extending equation (1) to allow heterogeneous event year coefficients by ethnicity, residency status and educational attainment. In doing so, we would expect OVV effects to be larger for Han (versus an ethnic minority) women, rural (versus urban) women, and those with less (versus more) education (refer to Extended Data Fig. 4 for the results). The OVV effects are large and statistically significant among Han individuals (event year 8: −0.0262, 95% confidence interval = −0.038 to −0.014, two-sided P < 0.001, n = 1,906,333; Extended Data Fig. 4a), whereas estimates for ethnic minorities are not statistically distinguishable from zero (Extended Data Fig. 4b), consistent with the fact that minorities in China were generally exempt from OCP quotas27. The effects are large and statistically significant among rural residents (event year 8: −0.0312, 95% confidence interval = −0.046 to −0.016, two-sided P < 0.001, n = 1,906,333; Extended Data Fig. 4c), whereas the OVV had little effect among urban women (Extended Data Fig. 4d), presumably because enforcement of the OCP was already more stringent in urban areas11. The effects of the OVV are also concentrated among less-educated women (Extended Data Fig. 4e) and are smaller among the more educated (Extended Data Fig. 4f), potentially reflecting greater demand for large families among less-educated women before the OVV.
Finally, a potential concern is possible manipulation of reported fertility to conform to policy targets28,29,30. To assess data quality, we compare results from our sample with results from two independent sources of data. As our pregnancy history data is retrospective, it is potentially less prone to manipulation by local officials, whose career concerns are tied to current performance relative to targets; however, we also repeat our event study analysis using both the 2000 Population Census and the 2005 Population Survey (Supplementary Note 15), finding patterns of births similar to those in Fig. 2 (Extended Data Fig. 5).
Reproductive behaviour and pregnancy
To investigate which changes in reproductive behaviour may have led to the reductions in births shown in Fig. 2, we use a similar empirical framework to study changes in induced abortion, pregnancies and women’s use of modern contraceptives under the OVV.
One potential reason for the decline in probability of birth that we find in Fig. 2 could be an increase in induced abortion31 (Fig. 3a and Supplementary Table 5). In general, these estimates are small and statistically insignificant following the introduction of the OVV. Although not clearly coincident with the timing of the decrease in births in Fig. 2, estimates for induced abortion do rise by 0.59 percentage points by event year 7 (95% confidence interval = 0.002 to 0.010, two-sided P = 0.008, n = 1,906,333), representing a relative increase of about 26.6% (Supplementary Note 16).
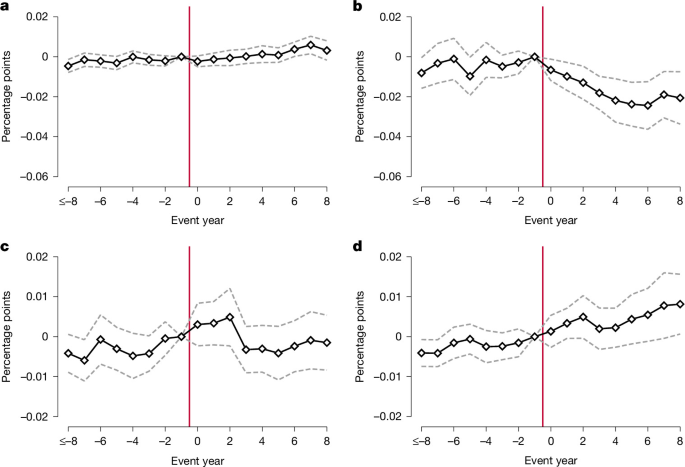
a, Induced abortion. b, Pregnancy. c, Female sterilization. d, IUD use. DiD estimates from equation (1) for four outcomes using Cengiz and colleagues’ approach26. Standard errors are clustered at the treatment cohort × province level. The sample used includes women aged 15–49 in 2001, and their induced abortion, pregnancy, sterilization and IUD use between 1980 and 2001 (n = 1,906,333 stacked woman-year observations; 36,375 unique women). Data are presented as estimated DiD event-study coefficients (point estimates) with 95% confidence intervals. Solid lines with markers show the coefficient estimates, whereas dashed lines show the corresponding 95% confidence intervals, which are two-sided and pointwise (not adjusted for multiple comparisons). The red vertical lines indicate when the OVV policy was implemented. Data are from the 2001 National Family Planning and Reproductive Health Survey.
Given that the timing of this increase in induced abortion does not closely coincide with the reduction in births, women were presumably preventing pregnancies at higher rates as well. Consistent with this interpretation, Fig. 3b then shows a statistically significant decline in the number of pregnancies, which closely coincides with the OVV policy. The magnitude of this reduction in pregnancies is also sizable (event year 8: −0.0206, 95% confidence interval = −0.034 to −0.007, two-sided P = 0.002, n = 1,906,333)—a decline of about 16% relative to the mean before the OVV (Supplementary Note 17). This decline in pregnancies can largely account for the reduction in births under OVV shown in Fig. 2 (Supplementary Note 18).
To study more precisely what changes in contraceptive use led to this reduction in pregnancies, Fig. 3c,d then present results for female sterilization and IUD use, which are the most prevalent forms of modern contraception in China25 (Supplementary Note 19). Figure 3c shows that female sterilization generally did not change for three years after the OVV, and although the point estimates turn slightly negative afterwards, they remain statistically indistinguishable from zero, and therefore presumably cannot account for the decline in pregnancies or births (Supplementary Note 20 and Supplementary Fig. 4). By contrast, Fig. 3d shows a gradual increase in IUD use under the OVV that becomes statistically significant in the later periods, with estimates reaching 0.81 percentage points by the final event year (95% confidence interval = 0.001 to 0.016, two-sided P = 0.033, n = 1,906,333; Extended Data Fig. 6 shows these results separately by maternal parity). This is an increase of 52.3% relative to the mean rate of IUD use before the OVV (Supplementary Note 21).
Given that the OVV policy strengthened incentives for bureaucrats to comply with the OCP, we directly consider the role of actions by government officials in this large increase in IUD use. Figure 4 and Supplementary Table 6 show separate event study estimates for IUD use: both chosen voluntarily by women and their families (Fig. 4a), and recommended by officials (Fig. 4b). We speculate that some women may have reported recommended use as voluntary (although we are unable to provide direct evidence of this). The figure panels show that there were similar absolute increases in both voluntary and recommended IUD use under the OVV by the final event year, but their timing differed (refer to Supplementary Note 22 and Supplementary Fig. 5 for estimates of female sterilization). Specifically, recommended IUD use increased almost immediately after the policy’s implementation, becoming statistically significant in event year 1 (0.0015, 95% confidence interval = 0.000 to 0.003, two-sided P = 0.046, n = 1,906,333). By contrast, voluntary use initially remained flat and only began to trend upward beginning in event year 4, becoming statistically significant by event year 6 (0.0054, 95% confidence interval = 0.002 to 0.009, two-sided P = 0.004, n = 1,906,333). As recommended use was much less common before the OVV, the relative increase in recommended use of about 150% is much larger (event year 8: 0.0051, 95% confidence interval = 0.002 to 0.009, two-sided P = 0.004, n = 1,906,333)—seemingly more than twice the 67% relative increase in voluntary use (event year 8: 0.0072, 95% confidence interval = 0.003 to 0.012, two-sided P = 0.002, n = 1,906,333; Supplementary Note 23). Overall, these results are consistent with the interpretation that substantially stronger bureaucratic incentives under the OVV policy led to greater effort by Chinese government officials to enforce the OCP.
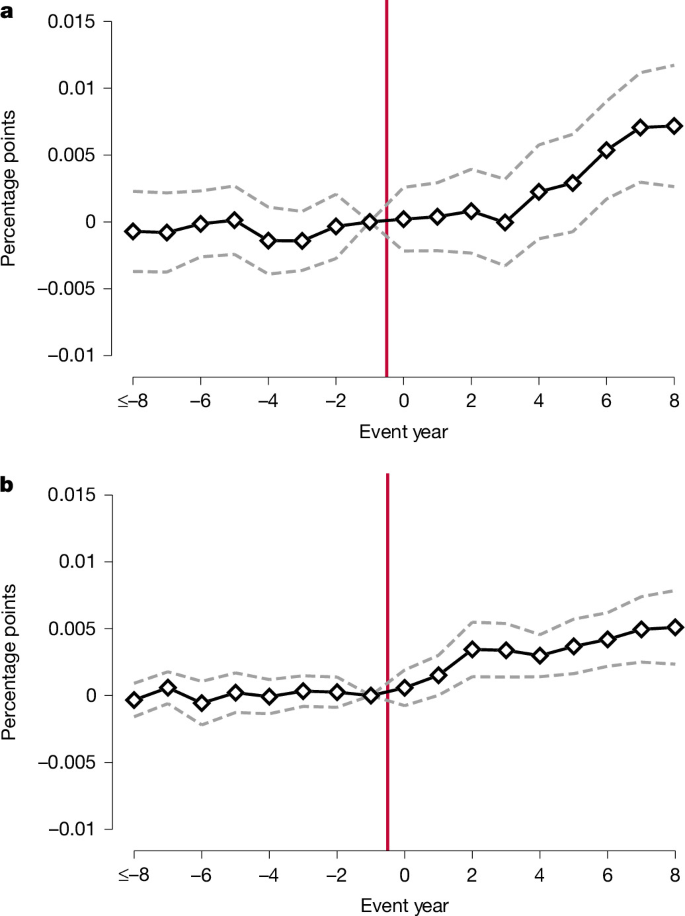
a,b, DiD estimates from equation (1) for use of IUDs using Cengiz and colleagues’ approach26, estimated separately for voluntary use by women and their families (a), and recommended use by officials (b). Standard errors are clustered at the treatment cohort × province level. The sample used includes women aged 15–49 in 2001, and their use of IUD between years 1980 and 2001 (n = 1,906,333 stacked woman-year observations; 36,375 unique women). Data are presented as estimated DiD event-study coefficients (point estimates) with 95% confidence intervals. Solid lines with markers show the coefficient estimates, whereas dashed lines show the corresponding 95% confidence intervals, which are two-sided and pointwise (not adjusted for multiple comparisons). The red vertical lines indicate when the OVV policy was implemented. Data are from the 2001 National Family Planning and Reproductive Health Survey.
Total fertility rates
Finally, we use equation (2) to generate regression-adjusted predictions for annual probabilities of birth by maternal age and parity necessary to build sequential multi-decrement fertility life tables (Methods), which we then use to derive decrements in China’s TFR over time due to the OVV policy (Supplementary Table 7 shows these calculations in detail).
Extended Data Fig. 7 presents these results, with TFR declines that generally match the pattern of births over time in Fig. 2 and Extended Data Fig. 2. To convert these event-year TFR estimates to calendar years, we match each provincial event year with its corresponding calendar year, weight each provincial calendar year estimate by the provincial female population in our survey data, and compute a weighted average for the corresponding Chinese population included in our sample. Figure 5 shows these results, both for the actual TFR and the counterfactual TFR without the OVV policy (generated using regression predictions with OVV indicators set to 1 and 0). China’s TFR declined by 0.98 births per woman between 1987 and 1999, and we calculate that about 48% of this decline (0.48 births per woman) is attributable to the OVV policy (Supplementary Note 24). Although other independent background forces were also at work, this fertility decline under the OVV represents the first time that China’s TFR fell below the replacement rate. Extended Data Fig. 8 shows comparable figures for actual and counterfactual (that is, without the OVV) age-specific fertility rates (ASFRs), suggesting that the TFR reductions in Fig. 5 are largely driven by reductions in ASFRs among women aged 20–24 and 25–29.
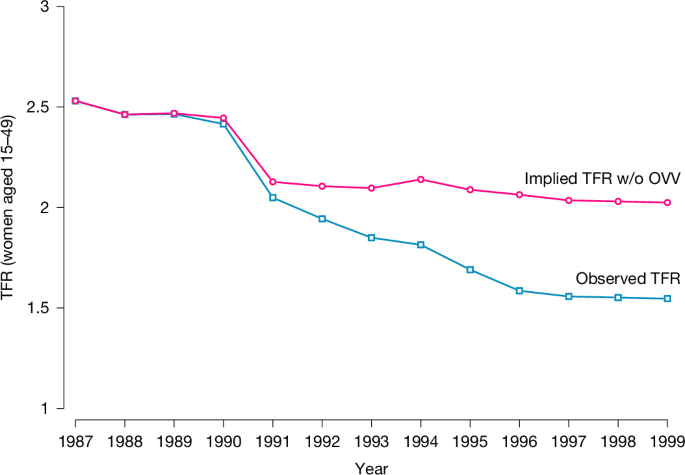
The observed TFR (blue line with square markers) and the counterfactual TFR (pink line with circle markers), calculated by subtracting the policy-driven change in TFR implied by estimates in the TFR section from observed TFR in each event year, derived from the event-study sample (n = 1,906,333 stacked woman-year observations; 36,375 unique women). Data are from the 2001 National Family Planning and Reproductive Health Survey.
Changes in TFRs simultaneously capture both changes in the number of births and changes in the timing of births. To consider these TFR components separately, we first estimate discrete-time hazard models to predict the implied density functions of maternal age at childbirth with and without the OVV policy at different parities (following Babiarz and colleagues9). Extended Data Fig. 9 shows these results; the distributions of maternal age at childbirth are similar across all parities with and without the policy, suggesting little effect on the timing of births. We then also conduct a Bongaarts–Feeney quantum-tempo decomposition32. The results from this decomposition, shown in Extended Data Fig. 10, also suggest that China’s TFR decline due to the OVV is predominantly a quantum rather than tempo effect (that is, fewer lifetime births rather than delayed childbearing). Overall, these results suggest that China’s TFR decline under OVV was largely a reduction in completed fertility rather than a change in birth timing.
Robustness and alternative interpretations
In this section we assess the robustness of our main results to alternative specifications and estimation samples, conduct a falsification exercise, and probe the sensitivity of our findings to the possibility of undetected pre-existing trends and to multiple hypothesis testing.
First, focusing on our primary estimates for the annual probability of birth, we evaluate the robustness of our results to alternative model specifications: (1) Supplementary Fig. 6a,b presents estimates that include controls for provincial characteristics (GDP per capita, urban population share, health care facilities per capita and the under-five mortality rate), as well as region-by-year fixed effects; (2) Supplementary Fig. 7 presents estimates that include controls for women’s rural or urban residency; (3) Supplementary Fig. 8 reports estimates controlling for five-year age group fixed effects; (4) Supplementary Fig. 9 shows estimates conditioning on maternal fixed effects (that is, a fixed effect for each mother), even though doing so effectively excludes women with only one child; (5) Supplementary Fig. 10 examines the extent to which our results are sensitive to changes in sample composition across event years. As later-adopting provinces have fewer post-treatment observations (as Supplementary Table 8 shows), we re-estimate our primary event study model using progressively restrictive samples that include only provinces observed through event year +k (k = 1, … , 8). (6) Supplementary Fig. 11 also assesses the robustness of our results to sample restrictions through a leave-one-out exercise, re-estimating equation (1) excluding each province sequentially (one-by-one) to test for the undue influence of any single province. In all cases, the resulting estimates for the annual probability of birth are similar to those presented in Fig. 2.
Second, we conduct a falsification exercise by randomizing the timing of OVV implementation across provinces. Specifically, for each province, we randomly assign a false year of OVV implementation between 1988 and 2000 (the first and last years of OVV in our sample), excluding each province’s actual year of implementation. When repeating this reassignment and then re-estimating a variant of equation (1) 1,000 times (Supplementary Note 25), Supplementary Fig. 12 shows the empirical probability density function of the resulting estimates, which is centered around zero (Supplementary Note 26). The vertical red line represents our actual estimate for the effect of the OVV policy (–0.015), which falls below the fifth percentile of the empirical distribution of false estimates, allowing us to reject the hypothesis that the actual treatment effect is statistically equivalent to the expectation of the false estimates at the 1% significance level.
Third, although Fig. 2 suggests that OVV implementation is not correlated with pre-existing fertility trends, we consider how well-powered our assessment of this possibility is (following Roth33). To do so, we first establish the magnitude of the minimum linear pre-OVV trend that we are powered to detect. Sensitivity analysis (Supplementary Fig. 13) suggests that our event study design has 80% power to detect a downward linear pre-trend with a slope as small as 0.146 percentage points per year. If such a trend were to persist after the implementation of OVV, it would accumulate to a bias of 1.02 percentage points by event year 6 (the event year point estimate largest in magnitude). However, even accounting for this potential undetected bias, our peak event year estimate of 2.88 percentage points (in event year 6) remains nearly three times as large, suggesting that our results are not primarily driven by secular trends (Supplementary Note 27). In addition to accounting for linear pre-trends, we also address the possibility of non-linear secular trends correlated with the timing of OVV implementation by applying the approach of Rambachan and Roth34, which bounds the extent to which the slope of any unobserved differential trend can evolve after OVV implementation. As Supplementary Fig. 14 shows, the decline in fertility by event year 6 remains statistically significant, even allowing an unobserved confounding trend to accelerate or decelerate its slope by 0.06 percentage points each year (Supplementary Note 28).
Finally, to address potential concerns about serial correlation and multiple hypothesis testing in our event-study estimates, we construct simultaneous (uniform) 95% confidence bands following appendix B of Marcus and Sant’Anna35 using a cluster-level multiplier bootstrap. These uniform bands control for the family-wise error rate across all event year estimates after the implementation of OVV. As shown in Supplementary Fig. 15, our primary results remain robust.
Discussion
An extensive literature demonstrates that family planning programmes and population policies influence fertility, but the strongest evidence suggests that these programmes and policies do not explain a large share of fertility decline across many environments1,2,3,4,5,6. Although population policy in China is often considered to be an outlier in global experience8,11,12, a large body of quantitative evidence has not generally supported the view that policy was central in China’s fertility decline7,8,9,10. By contrast, an important contribution of this paper is showing that the OCP was in fact central in China’s more recent fertility decline, pushing fertility below the replacement rate—albeit not when it was first introduced, but rather when it was enforced more forcefully under the OVV policy more than a decade later. Notably, this new evidence confirms arguments long made by demographers on the basis of qualitative and administrative evidence11,12,19,20, quantifying their magnitude. By strengthening bureaucratic incentives, OVV produced a delayed impact of the OCP on fertility in China, accounting for about half of the decline during the 1990s.
Our paper also makes a new contribution to research regarding the personnel economics of the state and the study of state capacity36,37. A central issue in this literature is that high-powered incentives are challenging to implement in bureaucracies, especially given the multiple responsibilities of bureaucrats and well-known concerns about multitasking37,38,39,40,41. Nonetheless, performance incentives for bureaucrats are used in many countries in sectors such as education and health42,43,44, as well as in efforts to stimulate local economic growth15,16,45, but they have been applied much less to population policy (at times in India and South Korea, for example), and, as in China, applications to population policy have been linked to concerns about coercion11,19,20,46,47,48,49,50,51 (Supplementary Note 29). Both India and South Korea introduced incentives for reproductive outcomes among government officials (promotion incentives in India during the Emergency period and financial bonuses for contraceptive service provision in South Korea), but to our knowledge, their effects on demographic outcomes have not been isolated and quantified. In the context of a broader literature on political economy and fertility52,53,54,55,56,57, our paper shows that by linking performance incentives with career concerns58,59,60,61, China’s OVV policy induced substantial increases in bureaucratic effort, helping to explain the effectiveness of a centrally mandated but unpopular policy. More generally, our findings provide new evidence on the importance of intensity of bureaucratic incentives, not simply the existence of policy targets (even in a system with China’s administrative reach).
Chinese policymakers now confront the challenge of persistently low fertility rates—far below the replacement rate—and accompanying population decline. Although relaxing the OCP has not reversed this trend, our research suggests that population policy contributed more to fertility decline in China than it has in other countries around the world, with strength of its bureaucratic incentives playing a critical role.
Methods
Context
China’s national population control policies date back to the ‘later, longer, fewer’ campaign launched in the early 1970s, and they became increasingly stringent over time, ultimately culminating in the OCP in 1979–198069 (Supplementary Note 30). In principle, households violating the OCP faced serious consequences such as fines, loss of social benefits, and prohibition of job promotion (or even demotion)7. There was variation across provinces in the magnitude of these fines, although we find little evidence that fine rates changed with the implementation of the OVV (Supplementary Fig. 16). In some cases, women who exceeded birth quotas underwent coerced abortion or sterilization70,71,72. However, implementation of the OCP was also heterogeneous and, particularly in rural areas, it was unpopular and difficult in practice to enforce. In the aggregate, China’s TFR ultimately declined very little following its initial implementation in 1979–1980 (Fig. 1).
To address enforcement challenges, the OVV policy then greatly strengthened cadre evaluation system incentives to adhere to OCP targets, strictly prohibiting the career advancement of government officials for adherence failure73. As with many implementation-focused policies, the OVV was initially introduced and developed through local government experimentation before it was embraced by higher government authorities. Specifically, it was first conceived and introduced in the Changde prefecture of Hunan province across five counties in 1982, and within a year, all other counties in Changde prefecture had adopted it. The Changde government viewed the OVV as successful by 1988. The Hunan provincial government then embraced the OVV, implementing it across the province; several other provinces (including Hebei, Liaoning, Jiangxi and Shandong) followed, adopting the OVV before 1990. Following the release of a central government report in 1991, other provinces then revised their policies on OCP enforcement as well, gradually adopting the OVV, albeit at varying points in time. Refer to Supplementary Section B for more details on China’s birth control policies and the OVV.
Figure 1 shows that more widespread implementation of the OVV policy during the early 1990s coincided with a sharp decline in China’s TFR. Throughout most of the 1980s, China’s TFR was relatively stable and consistently above 2.5 children per woman despite the OCP. However, as the OVV was implemented across provinces early in the 1990s, China’s TFR declined rapidly, dropping below replacement fertility (Supplementary Note 31). By the end of the 1990s, the TFR had fallen to about 1.6 children per woman, plateauing at that rate for almost two decades (the OCP was in effect until 2015). Although period TFR was relatively stable through the 1980s, cohort fertility had been declining for some time as successive cohorts of Chinese women born at least as early as 1950 had progressively lower completed fertility. Supplementary Fig. 17 illustrates this point, showing women’s cumulative fertility by birth cohort, measured at ages 30, 35 and 40. Note that a sharp decline in the period TFR during the 1990s would appear as a gradual decline across cohorts—each cohort is exposed to the OVV only during childbearing years under the policy (Supplementary Note 32).
Estimation
Estimation for annual probability of birth
We first estimate the effect of the OVV policy on women’s annual probability of birth. To do so, we exploit the staggered implementation of the OVV policy across provinces. Specifically, we use a generalized DiD event study framework to estimate:
where \({{\mathsf{Birth}}}_{ipt}\) is an indicator for whether or not woman i in province p gave birth in calendar year t; k denotes event year (relative to the year of OVV implementation in woman i’s province, defined as event year 0); \({D}_{pt}^{k}\) is an event year dummy variable for the kth year before or after province p adopted the OVV policy; Xi is a vector of individual characteristics of woman i (highest level of education and ethnicity); and μp and νt are province and calendar-year fixed effects, respectively. Our primary coefficient of interest (βk) measures the dynamic effect of the OVV policy on the annual probability of birth over time, before and after its implementation. The lead term βk(k < 0) allows us to test for the presence of pre-existing birth trends correlated with the timing of the implementation of the OVV.
To address concerns about traditional two-way fixed effects estimation with heterogeneous treatment effects and staggered treatment timing, we use the approach proposed by Cengiz et al.26 and also report results using alternative approaches65,66,67,68 (Supplementary Note 33). We cluster our standard errors at the provincial level, or at the treatment cohort × province level when using Cengiz and colleagues’ procedure26 (Supplementary Note 34 and Supplementary Fig. 18).
We also re-estimate equation (1) separately by maternal parity (first, second, third and fourth or above), restricting the sample to women at risk of a birth of each parity. Furthermore, to explore the mechanisms underlying changes in annual probabilities of birth, we then re-estimate equation (1), replacing \({{\mathsf{Birth}}}_{ipt}\) with other outcomes including induced abortion, pregnancy, and contraceptive use (by type, and also degree of consent for IUD use and female sterilization).
Regression-adjusted life table construction
To assess how changes in the annual probability of birth translate into changes in the TFR, we then use a discrete-time hazard framework analogous to equation (1), estimating the following probit model:
where \({M}_{it}^{g}={\mathbb{1}}({\mathrm{Age}}_{it}=g)\) is an indicator for maternal age group g (15–19, 20–24, … , 45–49). The coefficient θg captures baseline fertility differences across age groups, whereas \({\delta }_{g}^{k}\) captures the effect of the OVV policy in event year k specific to age group g. All other variables are defined as in equation (1). We estimate equation (2) separately by parity and use the resulting coefficient estimates to generate regression-adjusted predictions of birth probabilities for women at risk of first-, second-, third- and fourth-or-higher-order births (by maternal age group) in each event year. We then use these predicted probabilities of birth (qx) to construct sequential multi-decrement fertility life tables by event year, following the approach of Van Hook and Altman22, and Babiarz and colleagues9. By allowing the coefficients for event-year indicators and their interactions with maternal age groups to vary flexibly, this specification captures time-varying and age-by-parity effects of the OVV policy9. With predicted probabilities, we compute survival probabilities (lx, that is, the probabilities of not having a parity-specific birth by age x) and then maternal age-by-parity birth rates (dx). Aggregating the dx values across all parities yields ASFRs, and summing these ASFRs produces the TFR for a given event year (Supplementary Note 35).
Ethics statement
This study is based on secondary analysis of de-identified data from the 2001 National Family Planning and Reproductive Health Survey. The survey was designed and administered under the supervision of the National Family Planning Commission of China. Informed consent was obtained from all participants at the time of the survey.
Reporting summary
Further information on research design is available in the Nature Portfolio Reporting Summary linked to this article.